

eCommerce LBO Underwriting Template – Excel XLSX
Excel (XLSX)
VIDEO DEMO
BENEFITS OF THIS DOWNLOADABLE EXCEL DOCUMENT
- A reusable underwriting tool for modeling out potential ecommerce business acquisitions.
ECOMMERCE EXCEL DESCRIPTION
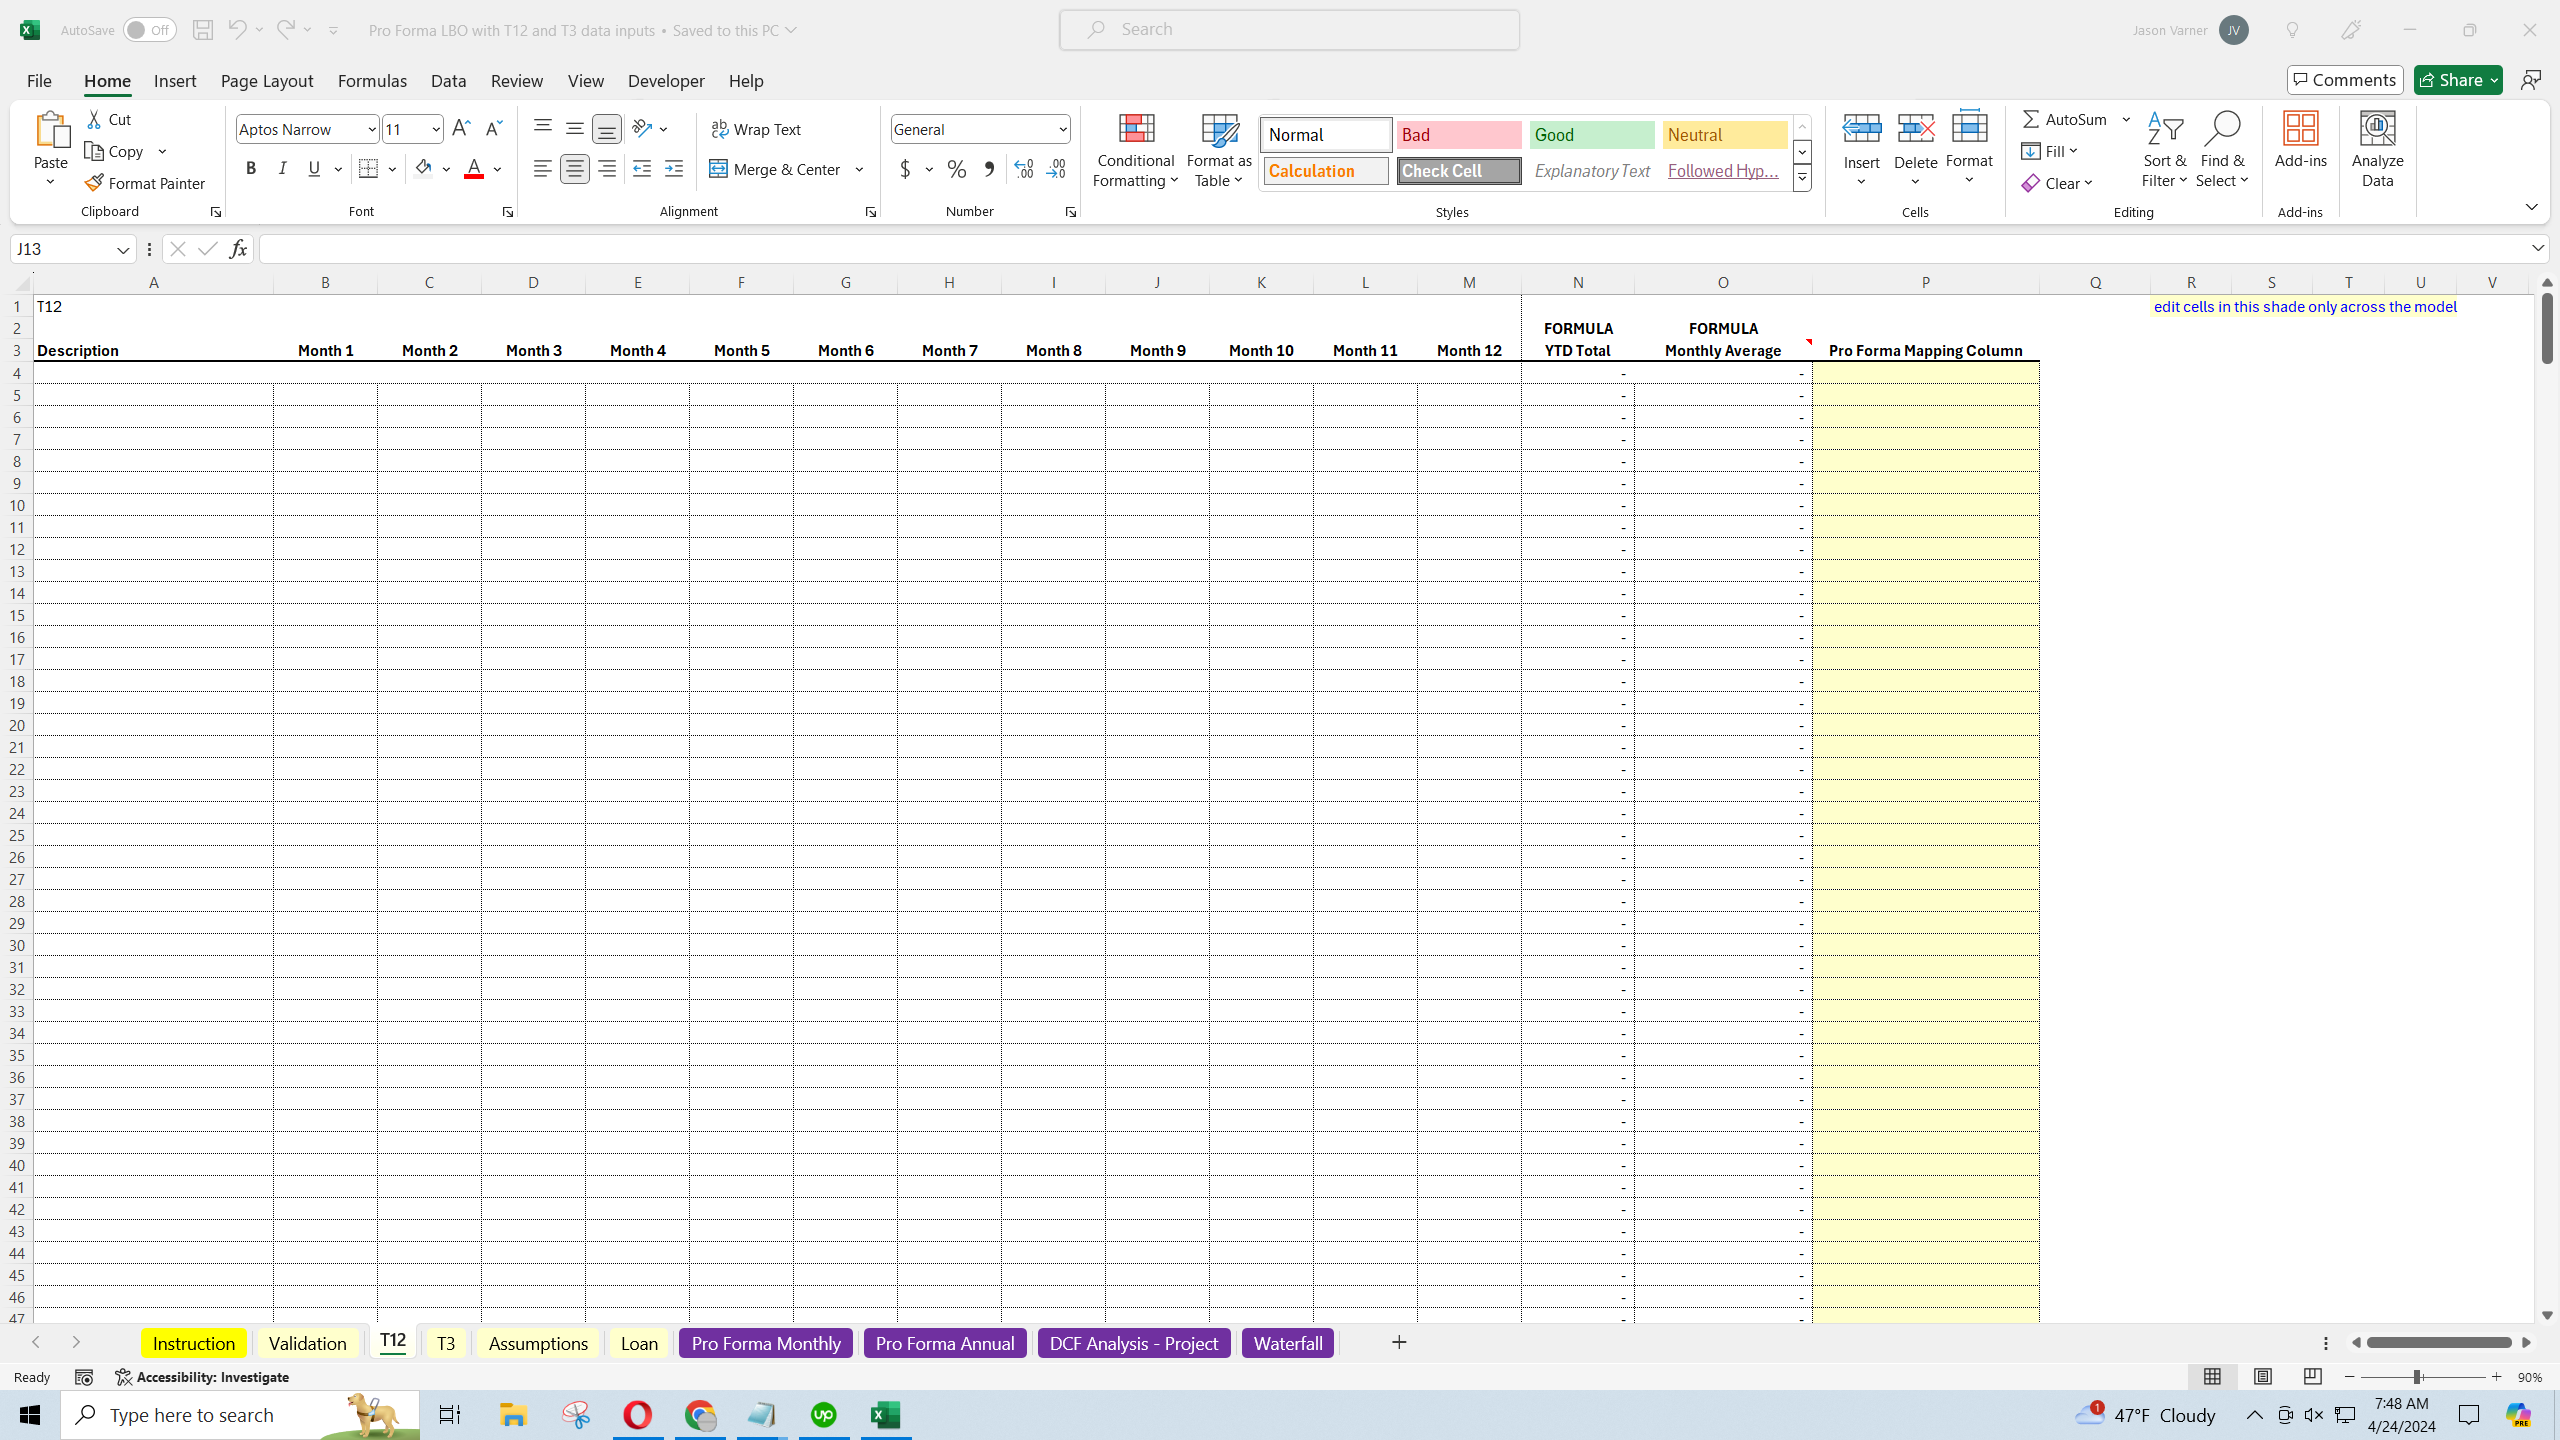
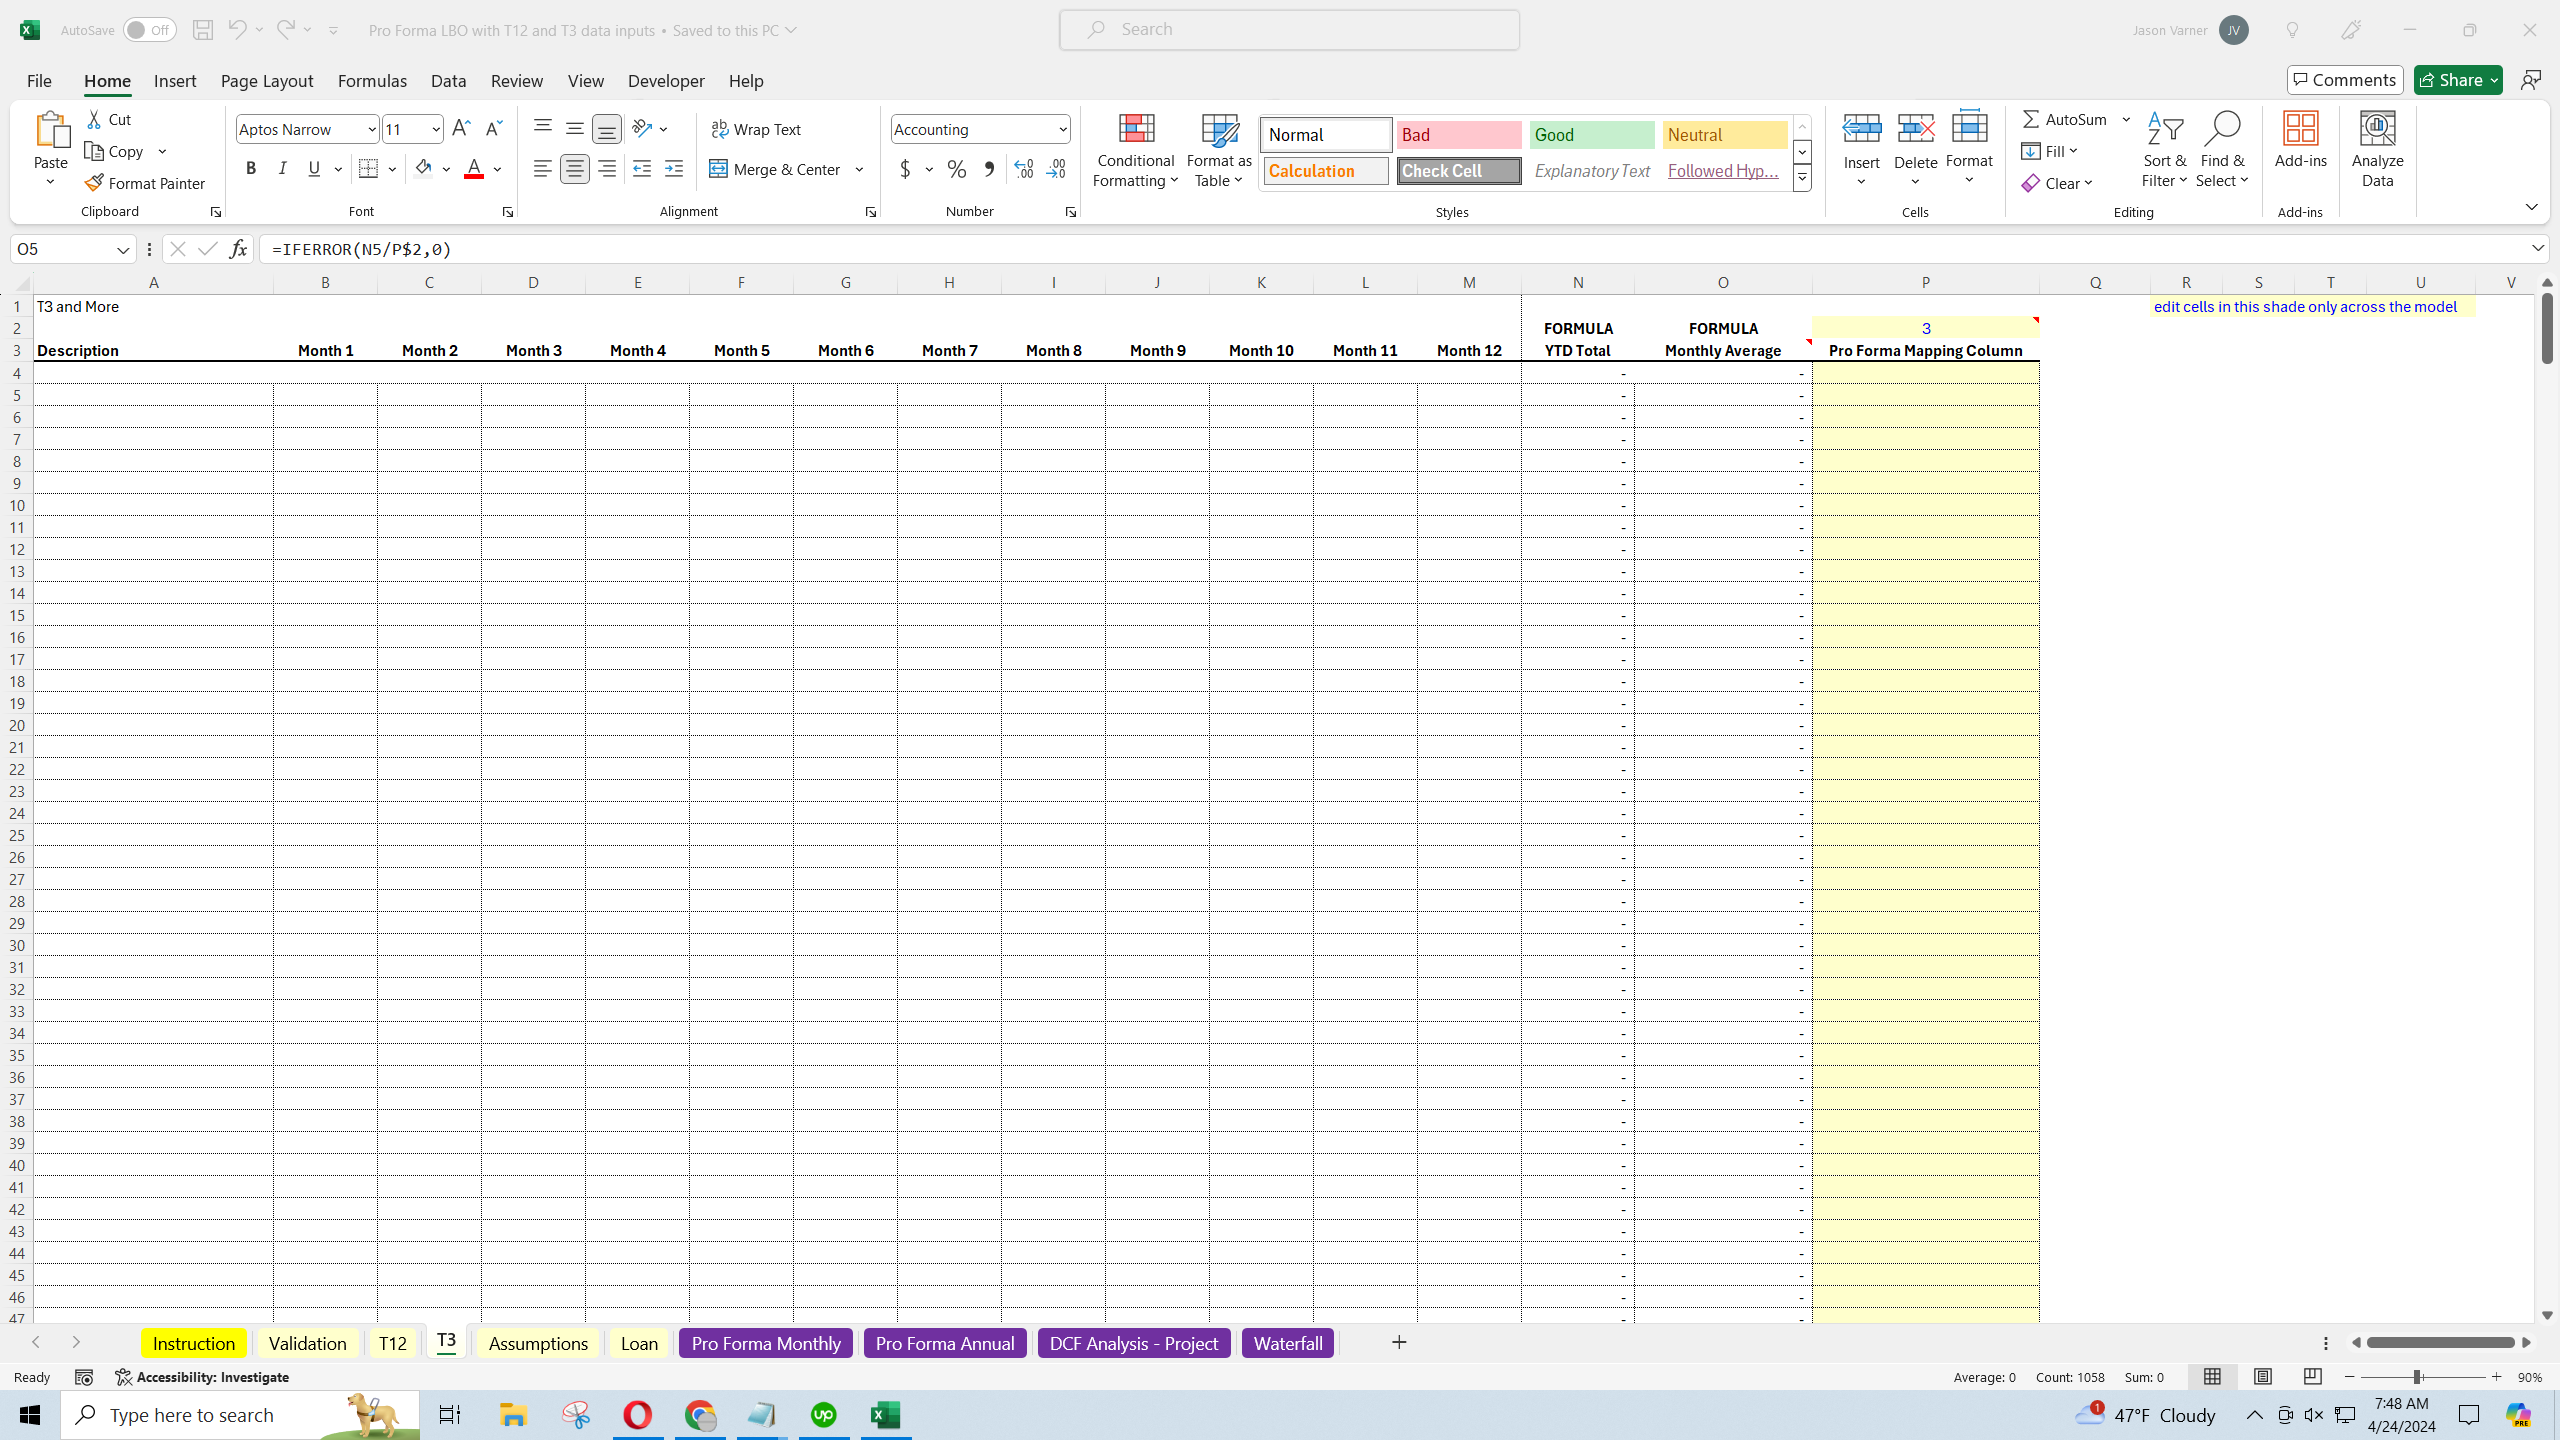
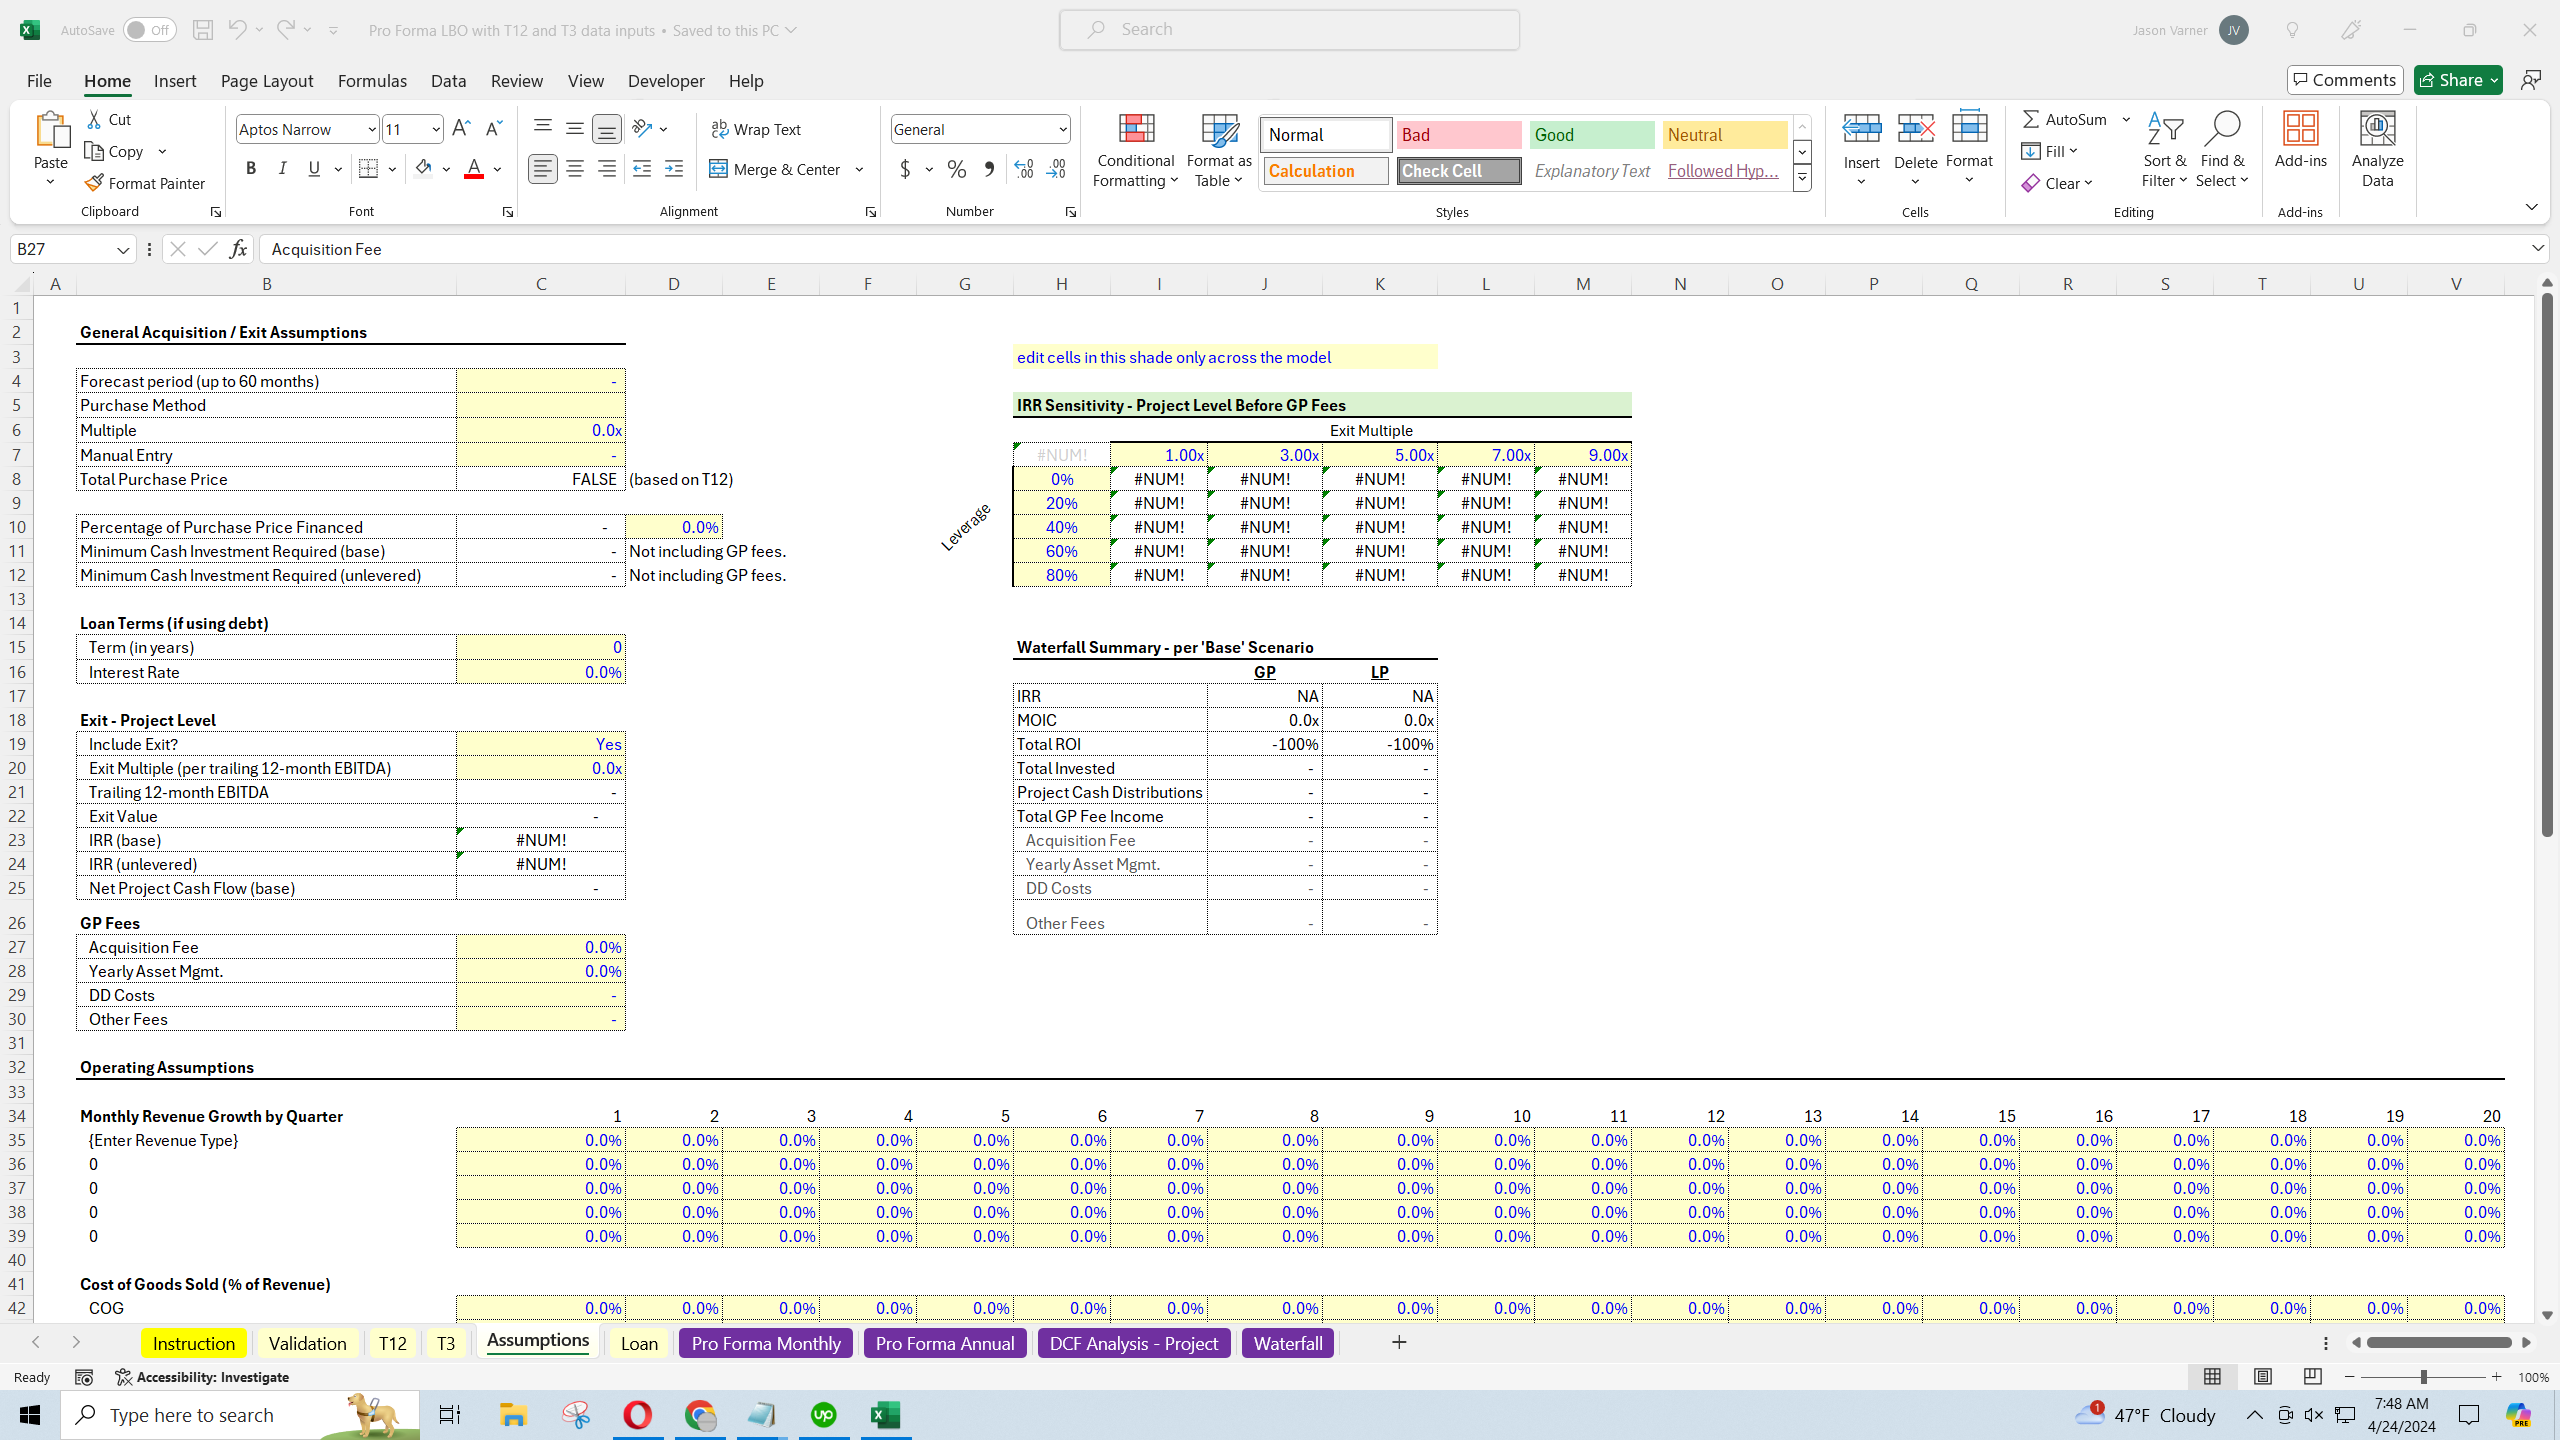
Here we are looking at T12 and T3 historical data, mapping that to a pro forma, and then entering assumptions about expected future revenue and expenses in order to understand the core deal economics and potential returns. I've also included an IRR sensitivity table for exit multiple and leverage rate sensitizing.
The initial use case for this was underwriting potential ecommerce business acquisitions, but the general top-down assumptions make it usable for many types of businesses, both brick and mortar and online.
Additionally, I integrated a joint venture waterfall with IRR hurdles in case you wanted to see what the deal looks like if the deal is between an operator and investor where the operator gets higher and higher share of all distributable cash flows as the overall IRR increases for the LP (powerful incentive structure).
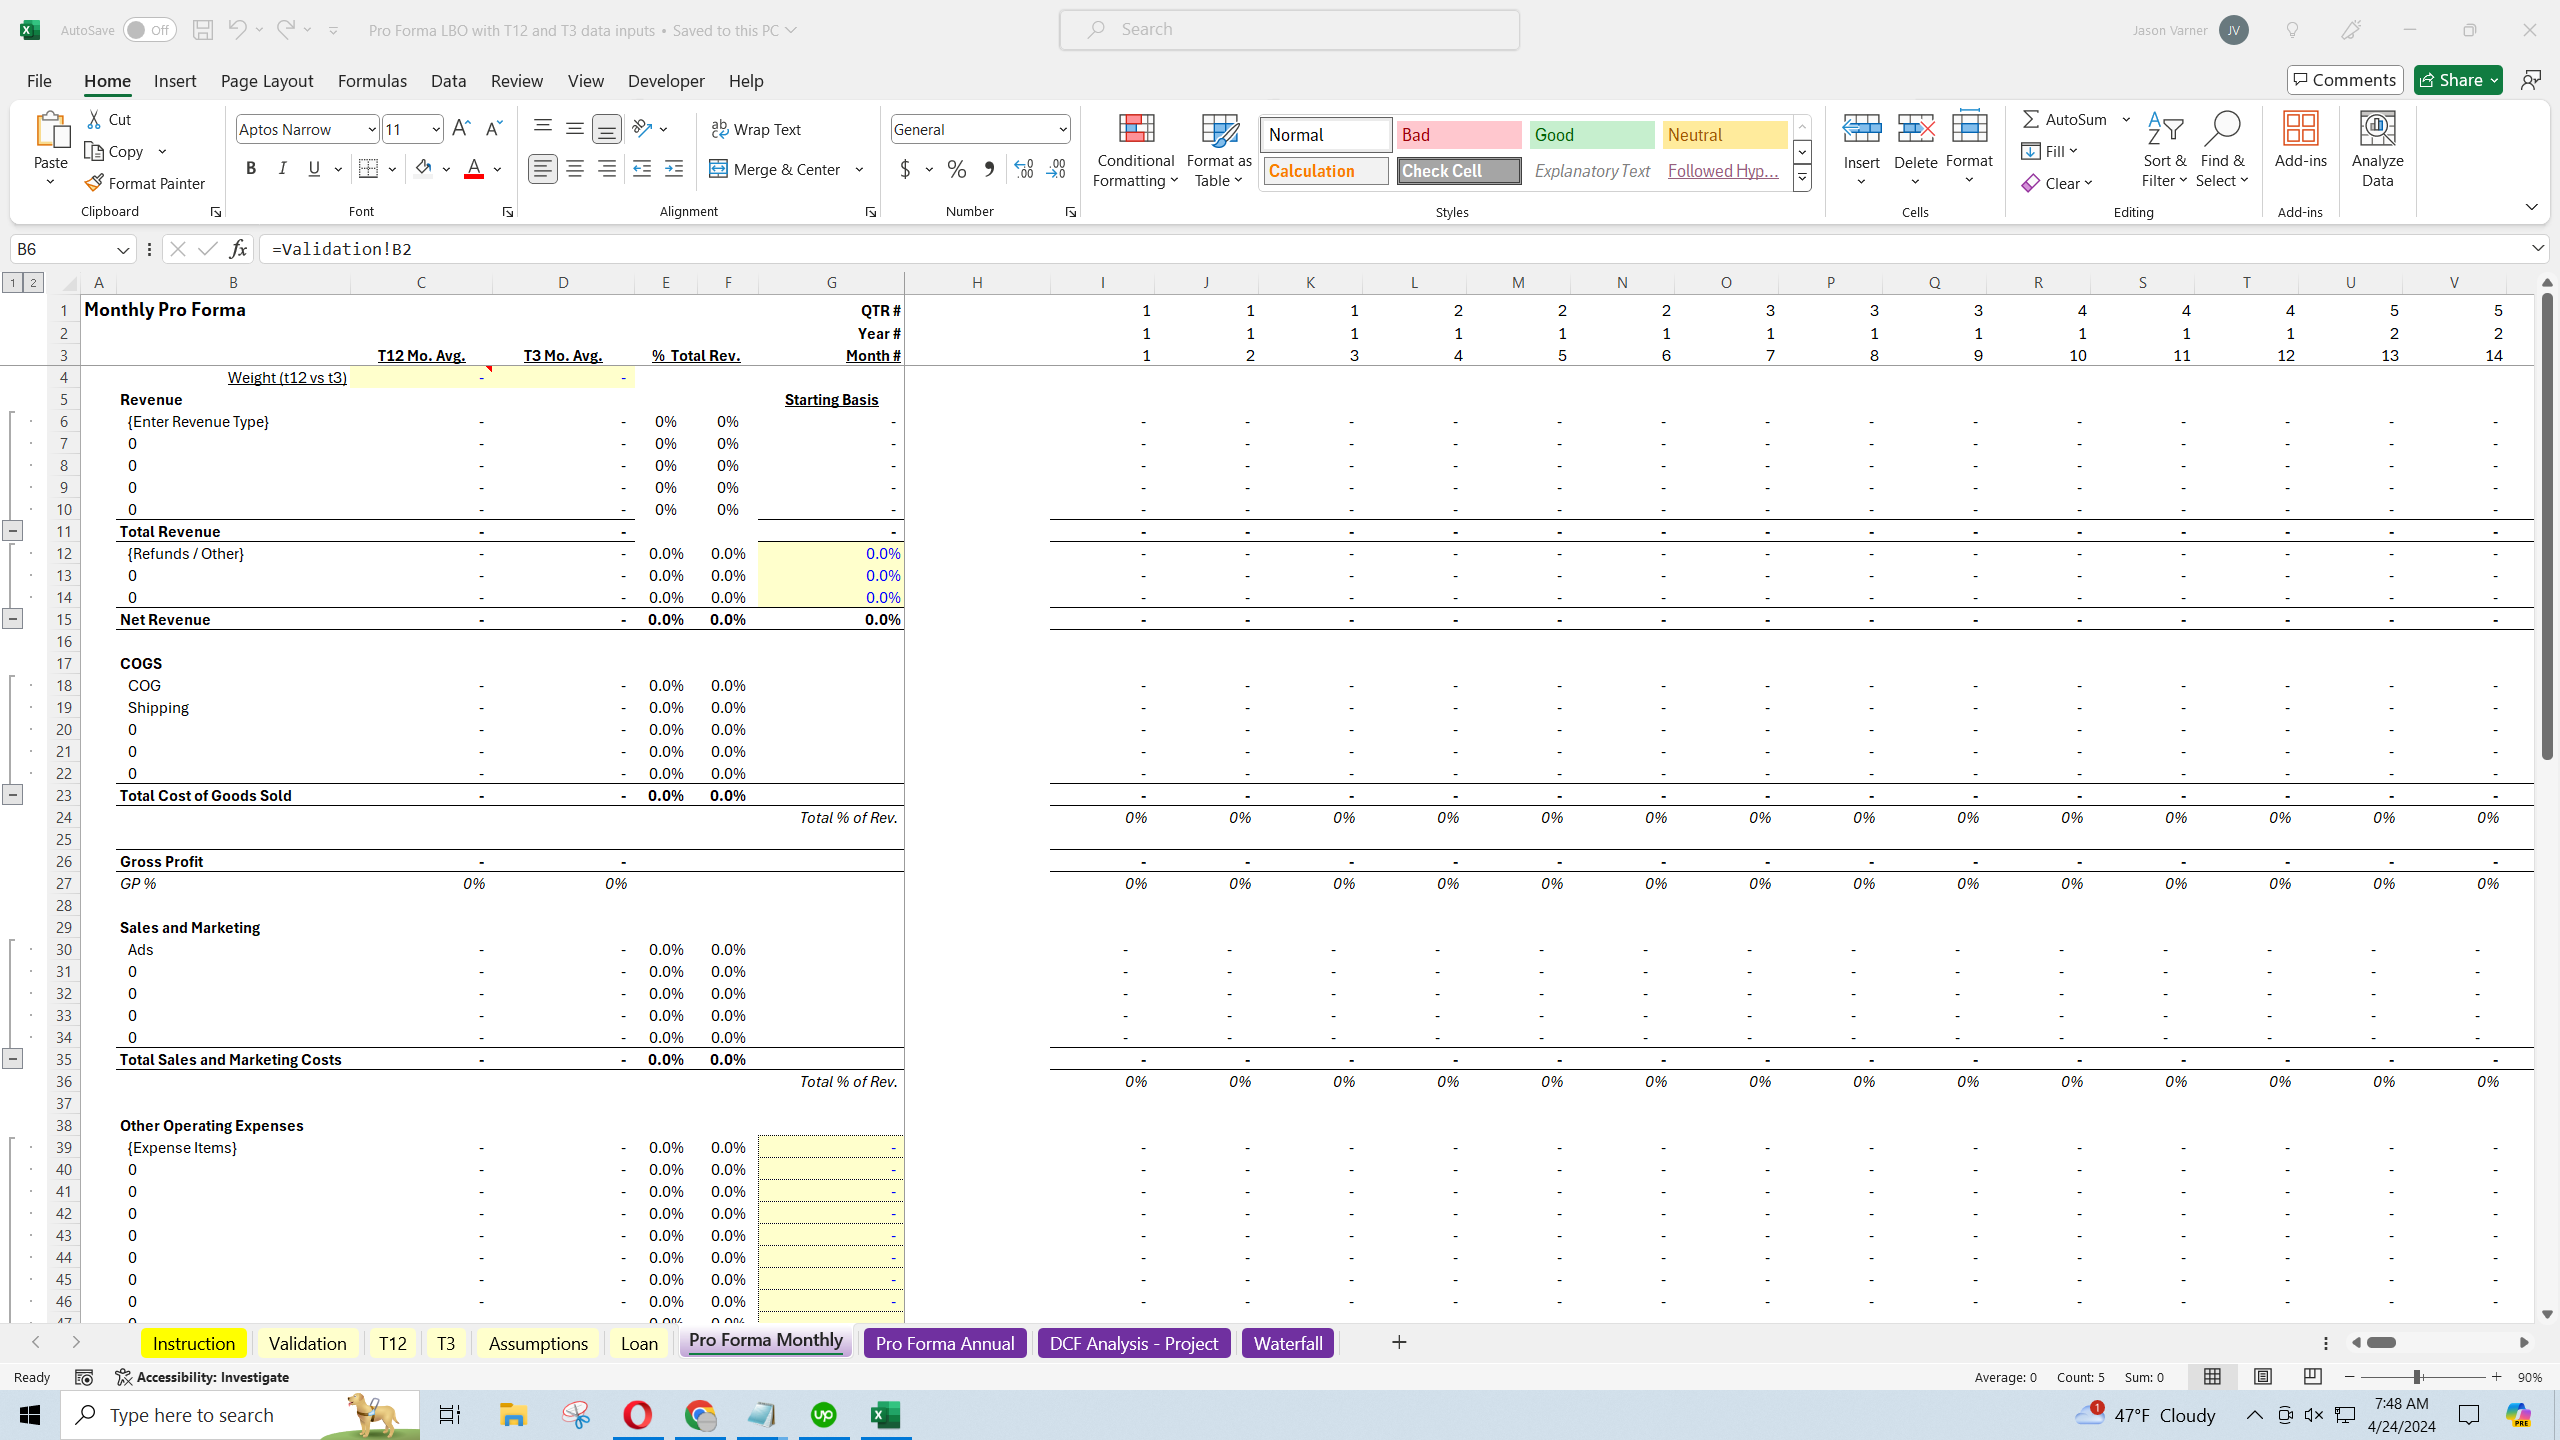
The primary output is a monthly and annual pro forma that extends for a maximum of 10 years. This will show EBITDA and cash flow line items based on the entered assumptions.
The purchase price can be based on an entry EBITDA multiple based on T12/T3, a revenue multiple, or a manually entered purchase price.
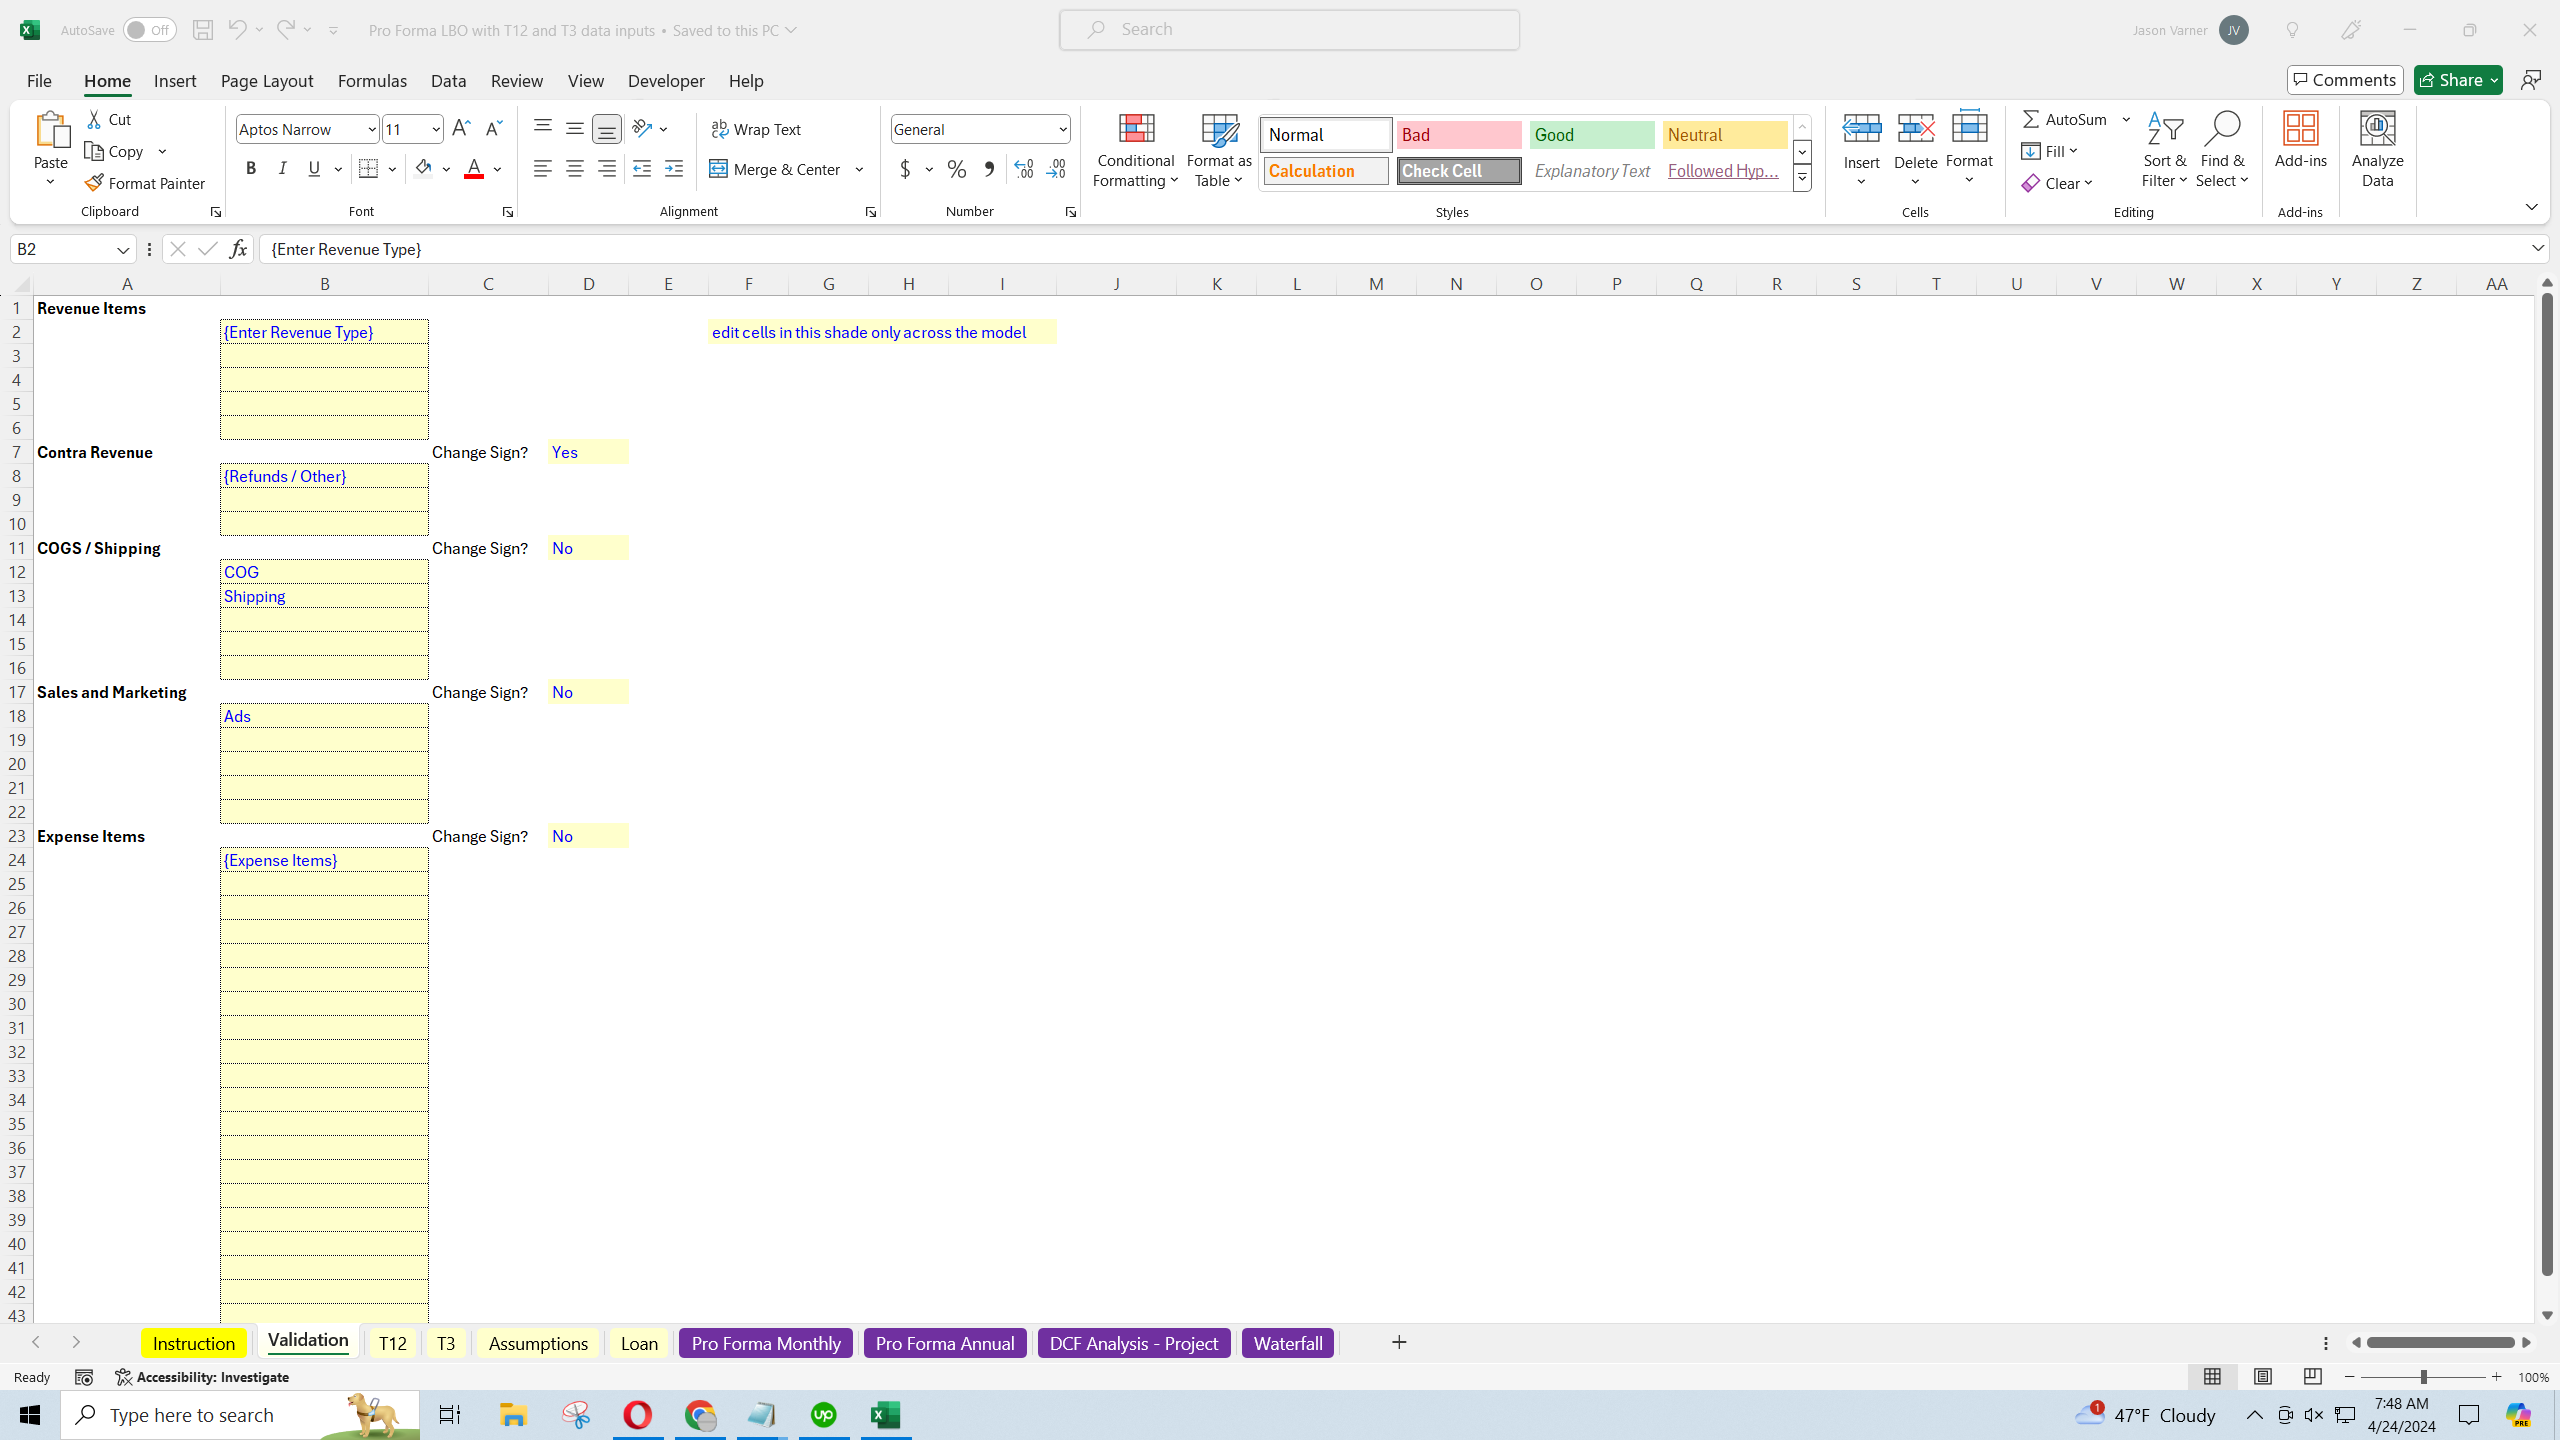
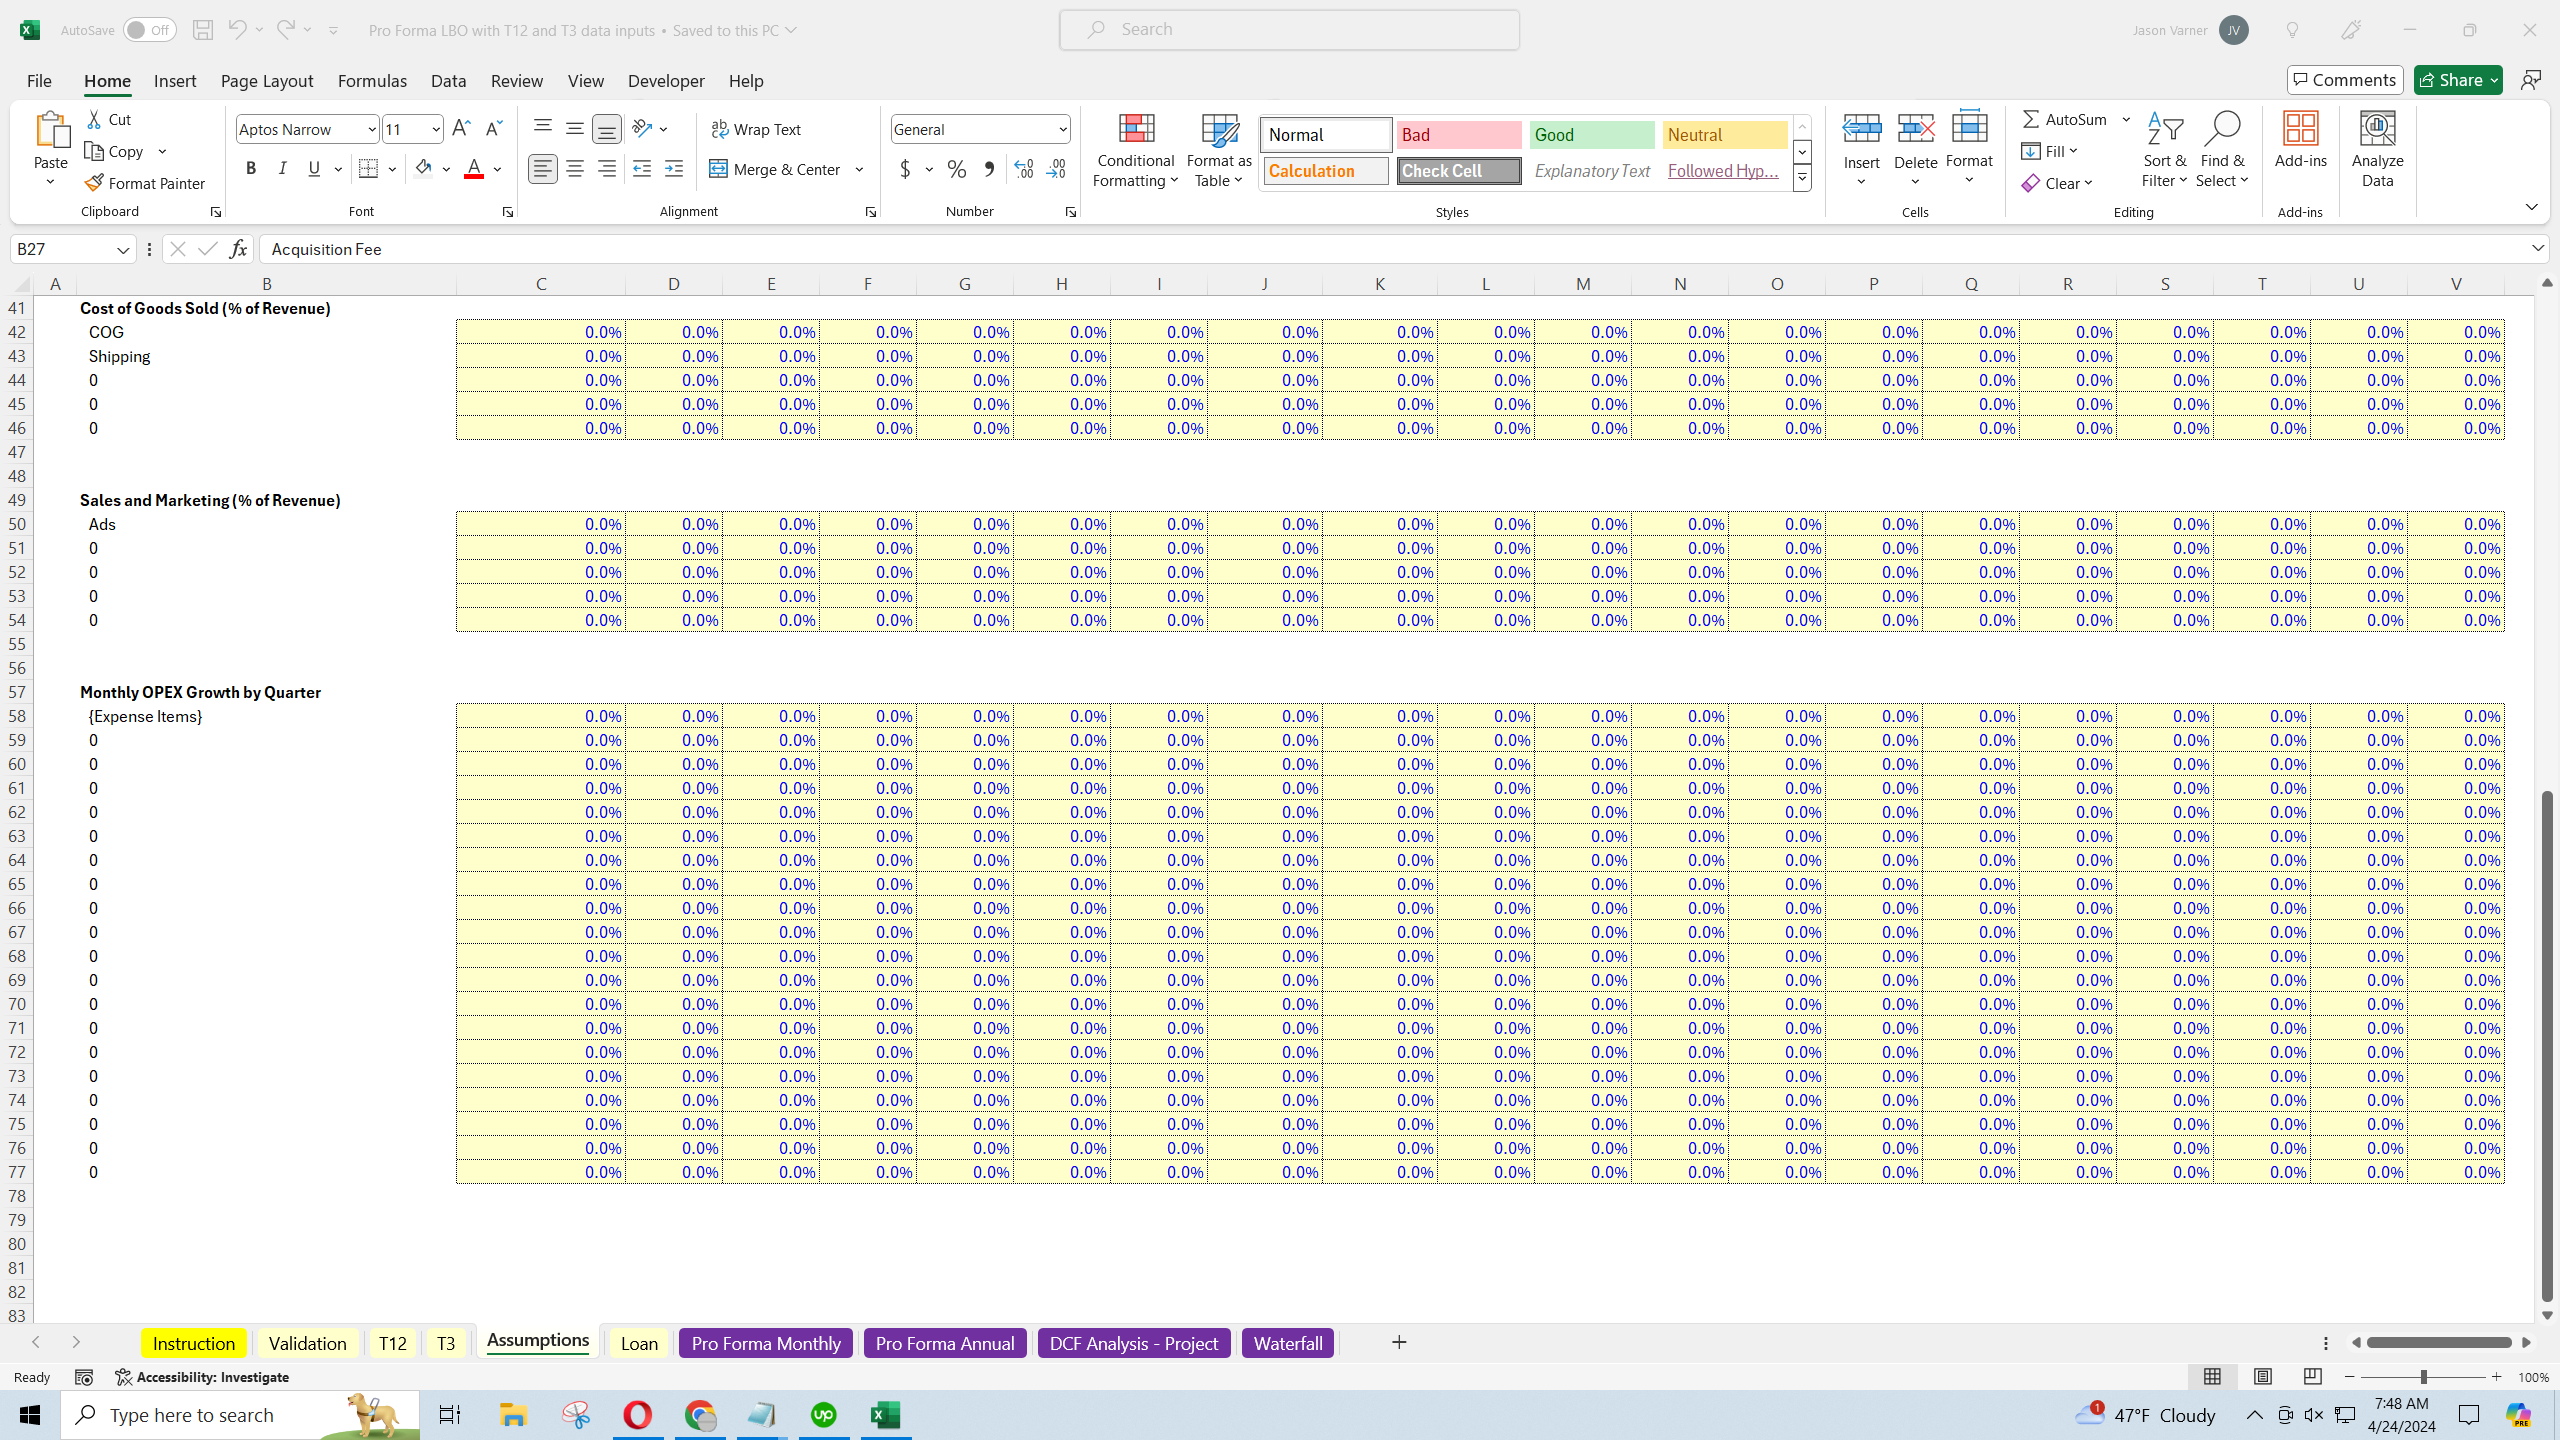
Revenue assumptions allow for up to 4 revenue streams, 3 contra revenue items, 5 cost of goods sold line items, 5 sales and marketing line items, and many fixed cost line items.
The user can enter the monthly expected growth rate (adjustable by quarter) for each revenue stream and that will apply to the current in-place average monthly revenue. The user can also weight the T12 and T3 data in case the more recent partial year data is more likely to be a better basis for revenue growth.
Contra revenue, cost of goods sold, and sales / marketing are all based on a defined % of revenue that is adjustable by quarter. You will be able to see the average monthly costs for all those sections based on the T12 and T3 in order to get an idea of what the actuals were like.
For fixed expenses, there are inputs to define the starting monthly cost for each and a % growth rate for those over time, adjustable by quarter.
There is a separate section for additional capex items as well.
The exit multiple is defined against trailing 12-month EBITDA from the exit month of the forecast.
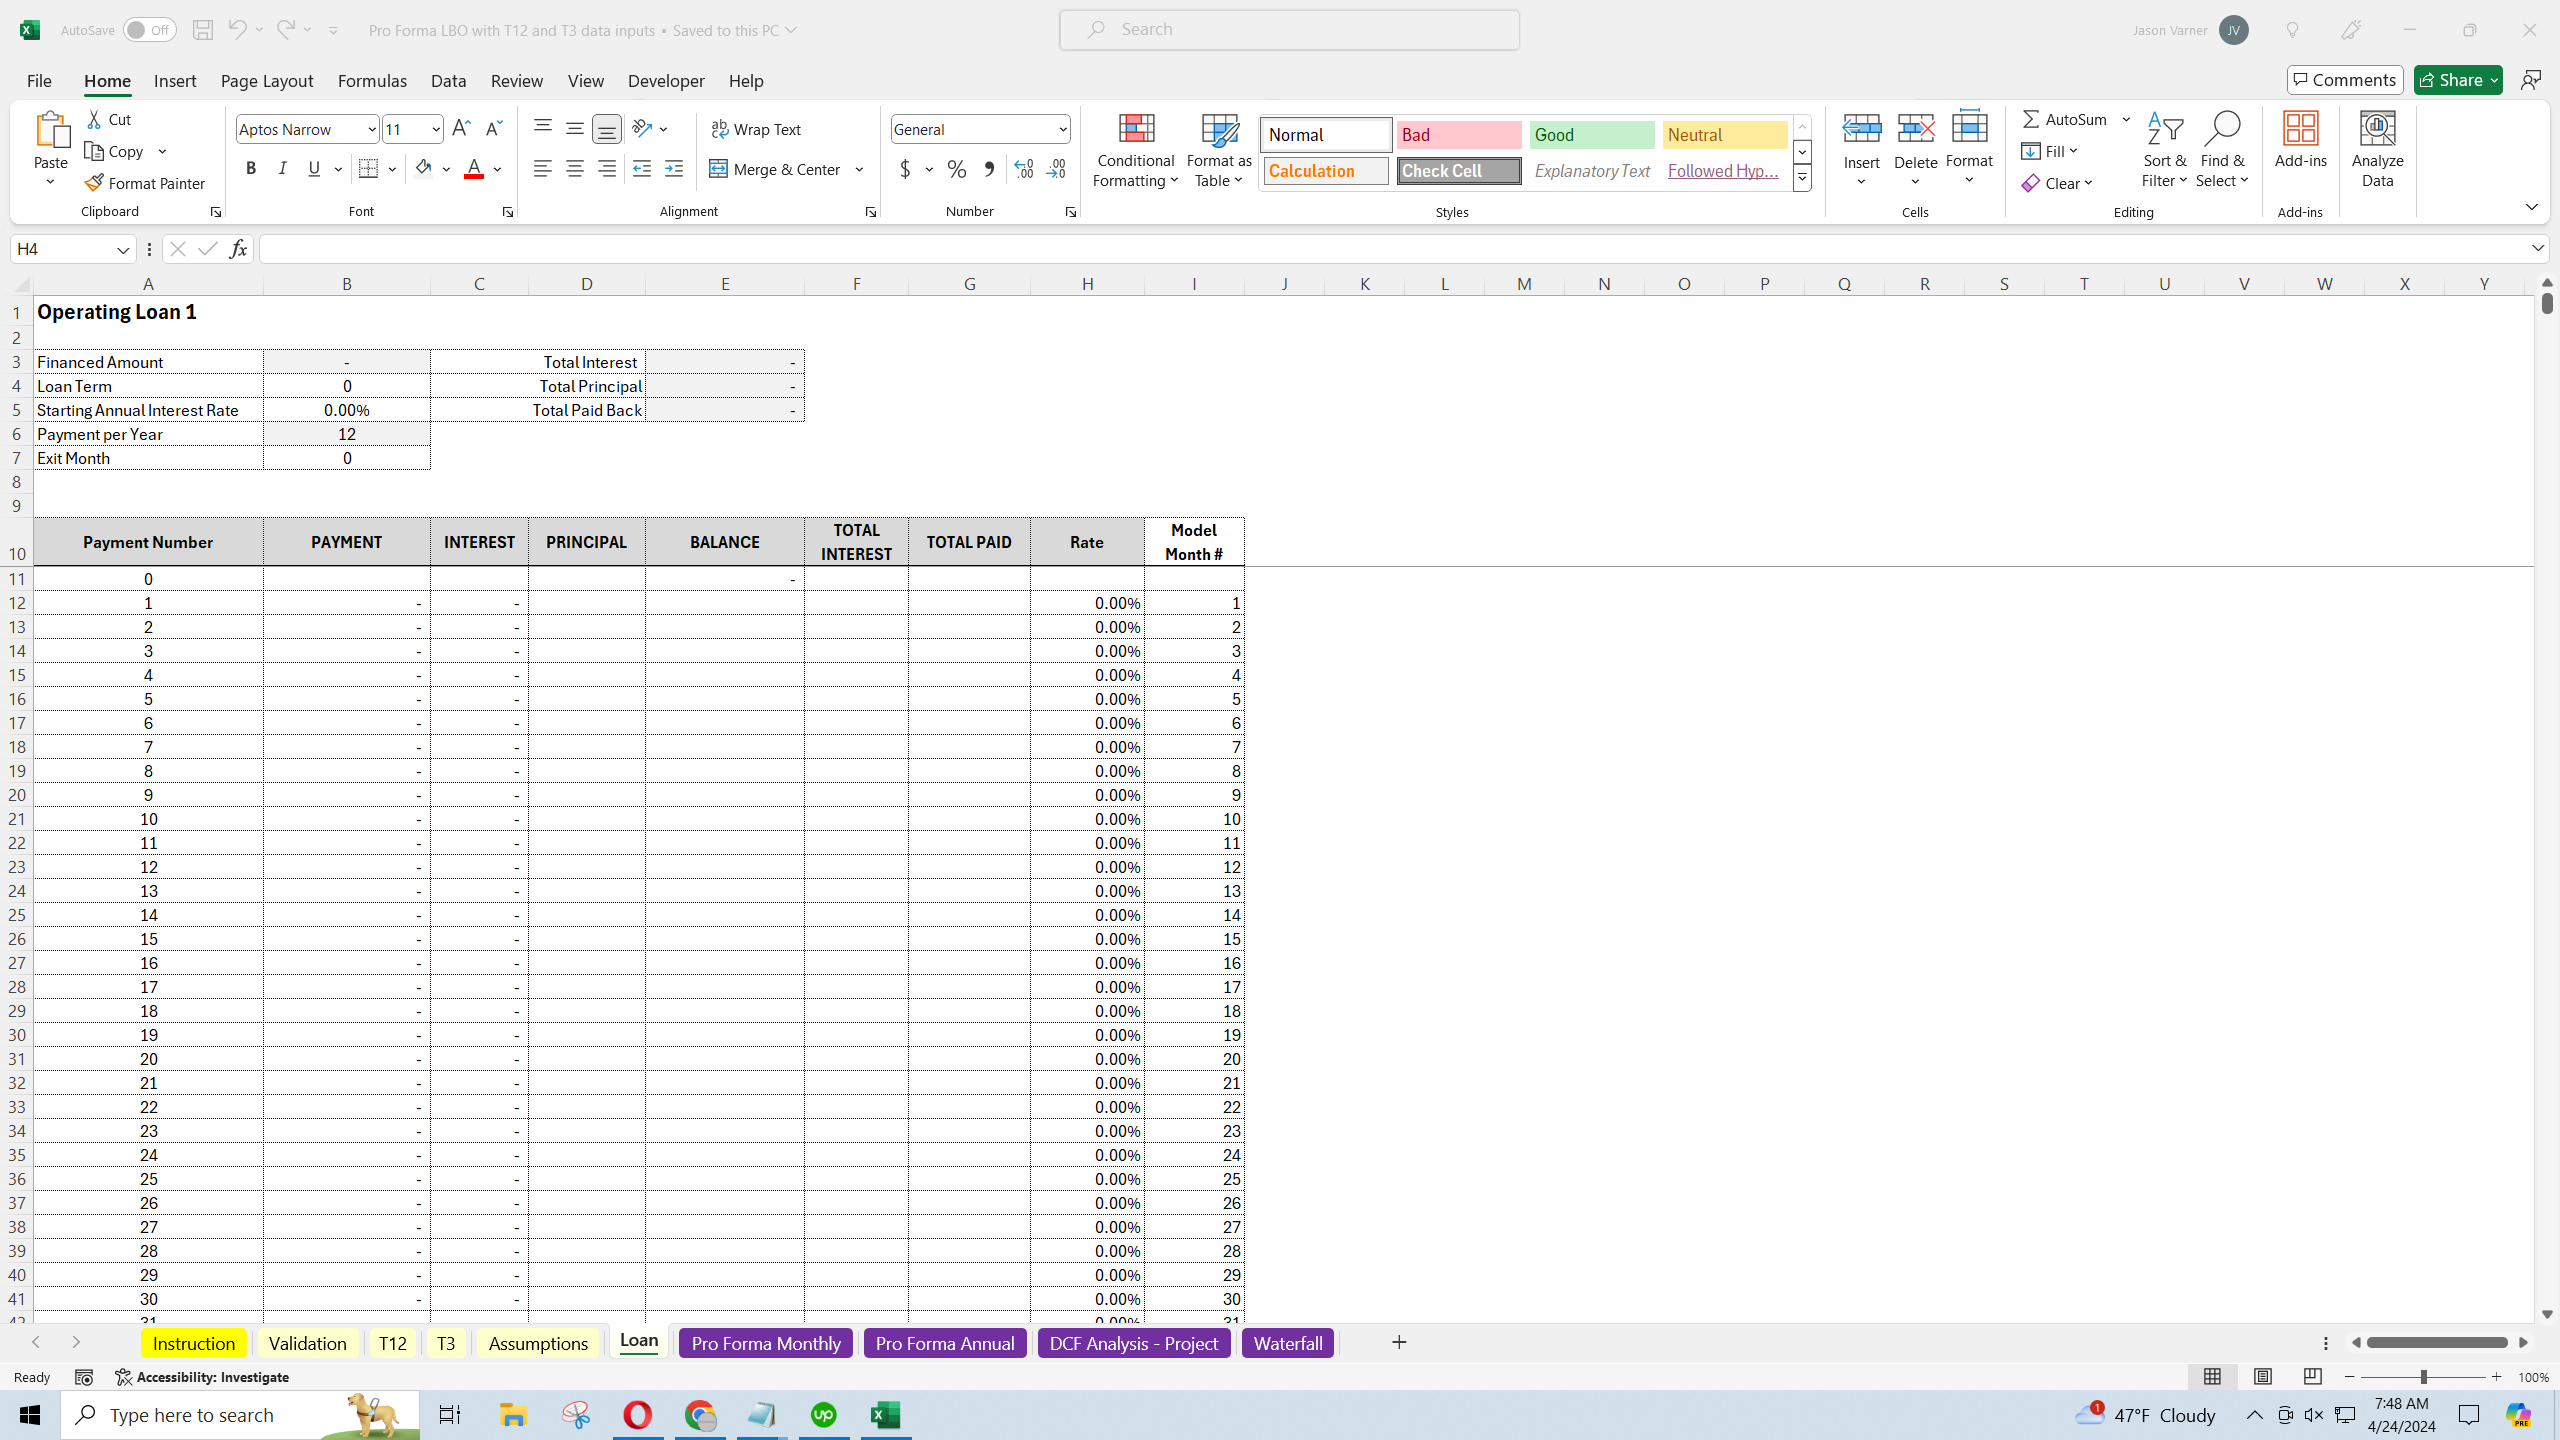
The user can define how much of the initial purchase price is going to be financed with debt and the interest rate / term of that loan. It will be assumed to be fully repaid at the exit month.
Instructional video included in the file.
Got a question about the product? Email us at support@flevy.com or ask the author directly by using the "Ask the Author a Question" form. If you cannot view the preview above this document description, go here to view the large preview instead.
Source: Best Practices in Ecommerce Excel: eCommerce LBO Underwriting Template Excel (XLSX) Spreadsheet, Jason Varner | SmartHelping
ABOUT THE AUTHOR
I graduated in 2011 with a Bachelor's degree in Accounting and began my career as a financial analyst at a small chain of auto repair shops. After gaining valuable experience, I launched my own practice specializing in real estate underwriting, later expanding into general business modeling.
I honed my spreadsheet modeling expertise by completing over 400 projects on Upwork with a 100% success
... [read more]
Ask the Author a Question
You must be logged in to contact the author.
