Editor's Note: Take a look at our featured best practice, Lean - Inventory Analysis (55-slide PowerPoint presentation). The first law of inventory : The Day you put an item into stock it becomes the wrong item.
This presentation is prepared to assist during Cash flow improvement assignment while performaing Inventory Analysis, This is step by step analysis and understanding of Process in detail.
This can also be [read more]
* * * *
US businesses spent $2.4 trillion on logistics in 2025, about 7.8% of GDP, according to the Council of Supply Chain Management Professionals’ 2026 State of Logistics Report. Yet when leadership teams pick a warehouse footprint, the conversation still tends to start and end with rent per square foot. That’s a thin way to make a decision that shapes delivery speed, tariff exposure, labor risk and working capital for years.
Treat footprint as a strategy variable instead. This article offers four lenses for the decision: location, sourcing shifts, resilience and cubic capacity. Then it closes with a scorecard you can take into your next network review. None of it requires a consulting engagement, only honest numbers and a willingness to challenge the lease you already have.
Lens 1: Location – What a West Coast Footprint Buys You
Inventory positioned near San Pedro Bay can cut days off the path from container to customer
Transit time is the most concrete argument for a West Coast position. Ocean freight from Asia typically takes 12 to 18 days to reach Los Angeles or Long Beach, and every extra day inventory spends on a truck or rail car is a day it isn’t selling. An importer that takes delivery through San Pedro Bay can shorten that chain considerably by pairing with a west coast 3PL warehouse that starts receiving and fulfilling within a day or two of container release, rather than waiting on a cross-country move from an eastern distribution center.
The volume behind that logic is real. The Port of Long Beach set a record of 9.9 million TEUs in 2025, as SupplyChainBrain reported, and that concentration of cargo is why dense service networks of carriers, drayage firms and warehouses have built up around it. Our look at logistics clusters explains why those networks keep compounding once they form.
Outsourcing the location decision is increasingly the norm. Armstrong & Associates estimates that US third-party logistics gross revenue grew 5.0% to $323.4 billion in 2025, with value-added warehousing and distribution reaching $72.7 billion. The tradeoff is control. A 3PL gives you geographic flexibility fast, but you accept its systems, its labor model and its priorities when volume spikes.
Lens 2: Sourcing Shifts and Tariffs Change the Map
Where goods come from matters as much as where they land. The Port of Long Beach has seen China-tied cargo fall from roughly 70% to about 60% of its volume over six years as Vietnam and Thailand grow, according to gCaptain’s 2026 port coverage. Tariff policy keeps moving as well; the temporary Section 122 duty expired in July 2026 and Section 301 duties of 10% to 12.5% now apply to many trading partners. Confirm current rates with your customs broker before you model anything.
Volume is holding up regardless. The Port of Los Angeles handled 890,861 TEUs in April 2026, up 5.7% year over year, per the Port of Los Angeles. Importers front-load shipments when duties look likely to rise, which means your warehouse can face a surge one quarter and a lull the next.
The practical lesson is that inventory placement should follow the sourcing map, not last decade’s habits. If a growing share of your product now ships from Southeast Asia, the case for a Southern California position holds, but the ideal safety stock may change. Building that flexibility is what agility in supply chains looks like in practice: the ability to reroute without rebuilding.
Lens 3: Resilience – Budget Labor and Port Risk as a Line Item
A split-port model spreads disruption risk across coasts
Most companies treat port disruption as an unpredictable event. It’s better treated as a budgeted cost. West Coast dockworkers have negotiated under ILWU contracts for decades, and past slowdowns showed how quickly a single gateway can turn into a bottleneck. You can’t forecast the next one, but you can price a reasonable provision for it.
Carra Globe’s 2026 U.S. port strategy overview describes a split routing model, often framed as a 60/40 East-West allocation. That figure is one provider’s modeling, not a universal standard, so test it against your own lanes. The principle is sound though: keep a second gateway, such as Savannah or Houston, warm enough that you can shift volume without a scramble. Hold buffer stock where the cost of a stockout is highest, and line up more than one drayage provider.
Resilience also lives inside the building. A site with sloppy slotting and unreliable data can’t absorb a surge, regardless of where it sits. Good warehouse management frameworks give you the dashboards to spot that before a disruption does.
Lens 4: Cubic Capacity – The Space You Already Pay For
A mezzanine turns unused overhead volume into a second working level
Square footage is the number on the lease, but cubic volume is what you can actually use. A 100,000 square foot building with 30 feet of clear height holds 3 million cubic feet, and many facilities fill only the bottom third of that. Ask what your cube utilization is before you ask what a bigger building costs.
Before paying for expansion or relocation, look at warehouse mezzanine systems that add a working level inside the existing shell. SC Solutions and Pallite both estimate that a single mezzanine level can deliver 1.7 to 2 times the usable floor area in the footprint it covers. Treat that as a vendor estimate and run your own numbers, but even a conservative gain often beats the cost, lead time and disruption of a move.
There are limits. Mezzanines suit small parts, e-commerce picking and packing, not heavy pallet flow. Floor loads, egress, guarding and load posting all fall under OSHA’s walking-working-surfaces rules, so involve an engineer early. And a mezzanine is a fixed asset; if your product mix is volatile, a flexible 3PL arrangement may serve you better.
A Simple Scorecard for Your Next Network Decision
Run each candidate setup, whether owned, leased or outsourced, through five measures:
Cost per order by delivery zone
Dock-to-stock time in days
Cubic utilization as a percentage of usable volume
A dollar provision for port or labor disruption
Total cost of 3PL versus owned operation
Our position is to outsource location flexibility and own the discipline of cubic efficiency. A partner can give you a presence near the port next month. Only you can decide whether your racking, slotting and vertical space are working hard enough.
Conclusion
Footprint isn’t a real estate line; it’s one of the few supply chain levers that moves cost, speed and risk at once. Review it every year against tariff conditions, port volumes and your own sourcing mix. If the answer changes, change the network before the quarter forces you to.
This tool is designed to compute optimum inventory level in a manufacturing environment based on customer service level, sales forecast, capacity utilization, and distribution channel. It can be used to estimate optimum level of pre-build stock, safety stock, in-transit stock and cycle stock by SKU [read more]
Do You Want to Implement Business Best Practices?
You can download in-depth presentations on Inventory Management and 100s of management topics from the FlevyPro Library. FlevyPro is trusted and utilized by 1000s of management consultants and corporate executives.
For even more best practices available on Flevy, have a look at our top 100 lists:
These best practices are of the same as those leveraged by top-tier management consulting firms, like McKinsey, BCG, Bain, and Accenture. Improve the growth and efficiency of your organization by utilizing these best practice frameworks, templates, and tools. Most were developed by seasoned executives and consultants with over 20+ years of experience.
Readers of This Article Are Interested in These Resources
This document provides a collection of 100+ Key Performance Indicators (KPIs) related to the Supply Chain functions listed further below.
Keeping in mind that each organization is different, the enclosed KPIs are intended as a general reference and their relevance depends on the specific [read more]
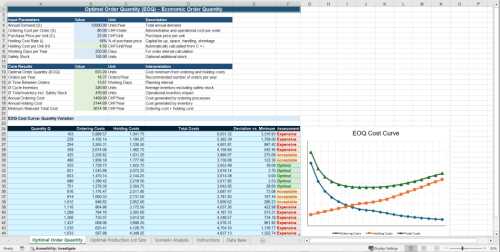
The EOQ & EPQ Inventory Cost Optimizer is a professional operations research and financial modeling tool designed for supply chain managers, procurement directors, and production planners. Maintaining the right inventory balance is a constant challenge: ordering or producing too frequently spikes [read more]
What good is Inventory Management if the inventory is not 98-100% accurate daily, everyday? No good! Cycle Counting is important to every department in your company.
Inaccurate inventory leads to loss of sales, poor customer experience, and may indicate a more drastic issue of retail theft. [read more]
 US businesses spent $2.4 trillion on logistics in 2025, about 7.8% of GDP, according to the Council of Supply Chain Management Professionals’ 2026 State of Logistics Report. Yet when leadership teams pick a warehouse footprint, the conversation still tends to start and end with rent per square foot. That’s a thin way to make a decision that shapes delivery speed, tariff exposure, labor risk and working capital for years.