Editor's Note: Take a look at our featured best practice, Supply Chain Resilience (23-slide PowerPoint presentation). Supply Chain "resilience" is the Supply Chain's ability to respond and recover quickly to potential disruptions. It can return to its original situation or grow by moving to a new, more desirable state in order to increase customer service, market share, and financial performance.
Resilience is [read more]
* * * *
For decades, industrial Supply Chains were designed around a simple rule: lowest landed cost wins. Production consolidated in a handful of giant plants, inventory was stripped out, and just-in-time flows were treated as proof of managerial discipline. That model delivered scale. It also created concentration risk that later shocks made impossible to ignore.
Pandemic shutdowns, climate events, and abrupt trade-policy changes exposed how brittle those networks had become. Many organizations responded with the opposite: nearshoring, duplicate suppliers, and heavier inventories under a “resilience at all costs” banner. The correction was understandable, but expensive. When the United States imposed a 10% baseline tariff on imports in April 2025, with additional duties of up to 50% on goods from dozens of countries and peak US–China rates that briefly reached 145%, those extra buffers stopped looking like insurance and started looking like a second cost stack. It is estimated that 20 to 30% of manufacturing EBIT margins are now at risk from higher tariffs alone.
The Cost of Resilience Megatrends and Strategy framework is the middle path between those 2 failed tenets. It does not ask leaders to choose efficiency or robustness. It asks them to build manufacturing and sourcing networks that can flex under disruption without giving up margin or share. Resilience is treated as an investment with a measurable price, not as an open-ended premium. Competitive advantage then shifts to whoever buys the least-cost resilience that still survives the shocks that matter.
That is a design problem, not a slogan. An organization still needs low-cost capacity. It also needs optionality when a port floods, a tariff jumps, or a critical skill pool dries up. The model works by making those trade-offs explicit: which products need dual sources, which plants must be regional, which risks can be automated away, and which costs should sit in the P&L as a managed line rather than an after-the-fact surprise.
The Cost of Resilience framework is organized into 3 building blocks:
Cost of Resilience Megatrends: The external forces that make a static, lowest-cost network obsolete.
Network Strategies: The structural choices that add resilience at the lowest acceptable cost.
Supply Chain Resilience Leadership Tactics: The operating moves that hardwire the balance into visibility, Risk Management, automation, climate planning, access to key talent, and Procurement KPIs.
Let’s discuss the first 2 building in detail, for now.
Cost of Resilience Megatrends
Four megatrends are redesigning Supply Chains.
Economic Statecraft has made government policy an input to supply network design. Tariffs, inbound and outbound FDI screening, sovereign investment vehicles, and “giga-incentives” now shape plant location as much as wage rates do. The penalty for ignoring that shift is uneven. US original-equipment manufacturers that still depend heavily on China for parts can see EBIT margins fall by 5 to 7%, while more globally diversified peers face a hit closer to 1 to 3%. Concentration in any single geopolitical corridor has become a P&L variable.
Climate Risk has moved from Scenario Planning to site selection. Nineteen of the world’s 30 largest ports, handling about 35% of global volume, face material risk from extreme weather and sea-level rise, with Shenzhen among the most exposed. Across the 50 largest manufacturing hubs, climate events threaten roughly 8% of output. Consumer electronics is particularly at high-risk. Climate hardening is therefore a supply network decision—e.g., which hubs to dual-source and which processes to move inland—not a corporate-social-responsibility appendix.
Talent Bottlenecks also constrain where factories can actually start. Shortages span blue-collar, white-collar, and digital skills, while 23% of skilled workers are actively looking to move abroad. Digital talent pulls R&D and even headquarters toward dense tech ecosystems. Blue-collar labor follows the plant—and can become the binding constraint once a region is flooded with new investment. Talent corridors and visa pipelines, such as Italy’s Piano Mattei, are becoming as relevant to site selection as freight lanes.
Advanced Robotics changes the cost map. Cheaper, more capable systems can lift productivity by up to 50% and quality by up to 25% in labor intensive, high-automation sectors such as automotive and logistics. China already accounts for more than half of global robot installations and has committed large public capital to the sector. Automotive deploys about six times more robots per 1,000 employees than other industries. Robotics does not eliminate the location choice. It changes which locations remain viable when wages and tariffs rise.
Network Strategies
Supply Chain leaders should maintain a balance between cost and resilience. Progress along the Supply Chain network adds cost. The aim should be to achieve the level that survives economic shocks.
Geographic diversification strategy places capacity in low-cost and geopolitically neutral countries. Multi-sourcing strategy splits volume across plants and suppliers. Dual sourcing strategy is the minimum standard for critical SKUs rather than a premium feature. Multinational intermediaries with plants in several countries offer flexibility without a full owned footprint. Redundant capacity must be reserved for strategic sectors such as semiconductors and critical minerals, where a single failure is unacceptable. Regionalization or local Supply Chain structures also help counter disruption. Shared capacity strategy through contract manufacturers and joint ventures buys scale.
The right strategy depends on whether the world goes bipolar and multipolar. In a bipolar outcome, trade hardens into rival US-led and China-aligned blocs and neutrality becomes difficult to sustain. Organizations that sell into both spheres may need parallel Supply Chains for contested categories. In a multipolar outcome, dedicated regional networks, anchored in nonaligned manufacturing hubs, serve the United States, Europe, China, or Southeast Asia separately.
Case Study
The auto industry is the cleanest illustration of why the middle path matters. For years, China-centric parts networks delivered cost advantage into the US market. When tariffs rose in 2025, that same concentration transmitted the shock straight into OEM earnings. China-dependent US OEMs faced several points of EBIT compression, while diversified networks contained the damage to a much narrower band. The difference was how many qualified alternative sources and regional plants already existed when the tariff landed.
Foreign EV makers poured tens of billions of dollars into US capacity between 2021 and 2024 as policy incentives and customer proximity favored local production. That was a rational resilience move. It did not cancel the tariff problem. Duplicate tooling, safety stocks, and dual designs still carry landed costs, and tariffs inflate those costs rather than replace them. Organizations that treated reshoring as a complete answer discovered they had bought geographic protection and then paid duty on the remaining imported content. Those that paired reshoring with multi-sourcing by SKU, automation to offset higher local labor, and explicit EBIT-at-risk analysis were in a position to choose how much of the new cost to absorb, pass through, or design out.
FAQs
What is the difference between “resilience at all costs” and the Cost of Resilience model?
The first treats extra Inventory, extra plants, and extra suppliers as inherently good. The second prices those extras against the disruptions they are meant to absorb and keeps only the options that protect margin and share.
Why not simply pass every tariff through to customers?
Some recovery is often necessary. Full pass-through is not always available. Where rivals have a more diversified footprint, they can price below a concentrated competitor and take volume. Network design and Pricing Strategy have to be decided together.
Is dual sourcing required for every SKU?
No. Dual sourcing is the emerging minimum for critical components and long-lead items. Commodity SKUs with many qualified sources and short changeover times can stay single-sourced if the switching time is short and visible.
Should the network be built for a US-China split or for many regional blocs?
Neither assumption should be locked in. A bipolar world argues for parallel chains in contested categories. A multipolar world argues for regional, local-for-local structures. The robust design hedges both.
Where should a leadership team start?
Map EBIT at risk by corridor and SKU, then by climate and talent exposure at the same nodes. Only after that should the organization choose a rung on the network ladder and the KPIs (e.g., single-plant dependence, source-switch time) that will keep the chosen cost of resilience visible in the P&L.
Closing Thoughts
Tariffs did not create the resilience problem. They made an already expensive solution unaffordable and forced a clearer question: how much robustness can this business actually pay for? The Cost of Resilience model answers that question in sequence—read the megatrends, choose a network that matches the plausible worlds ahead, then manage the carrying cost with the same rigor once reserved for purchase-price variance. Cost is no longer king. Unpriced resilience is no longer strategy. The firms that hold both ideas at once will be the ones still standing when the next shock arrives.
You can download in-depth presentations on this and hundreds of similar business frameworks from the FlevyPro Library. FlevyPro is trusted and utilized by 1000s of management consultants and corporate executives.
For even more best practices available on Flevy, have a look at our top 100 lists:
This presentation is a comprehensive collection of Key Performance Indicators (KPI) related to Supply Chain Management (SCM). A KPI is a quantifiable measure used to evaluate the success of an organization, employee, or process in meeting objectives for performance.
KPIs are typically [read more]
Readers of This Article Are Interested in These Resources
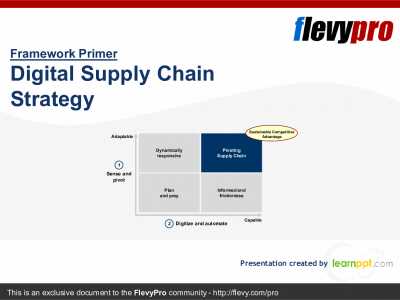
In today's Digital Age, organizations are faced with the changing nature of the demand curve and the element of uncertainty in the Supply Chain. For Operations Teams, the challenge and Competitive Advantage has become: How well we respond and execute against ongoing uncertainty.
With the world [read more]
This presentation has 32 slides in all and covers the following topics:
Why PFEP - Benefits
Develop an Implementation Plan
Create a future state VSM
Plan For Every Part - Implementation
Step 1: Create PFEP Database - Current State (Part, Container, Shipping, Supplier, Consumption, Part [read more]
Objective of the Presentation:
To understand and explore opportunities in supply chain optimization solutions in manufacturing by analysing overall demand trends, identifying potential end-user use cases, company profiling, and benchmarking major players in the market
Sections included: [read more]
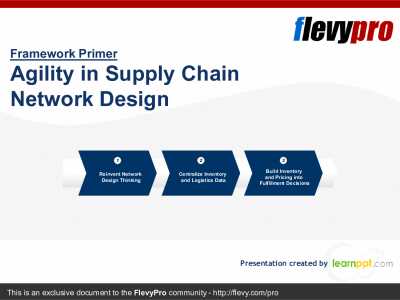
Online retailing has changed. Before, e-commerce companies fulfilled consumer demand from a small number of large-scale warehouses that carried similar catalog of items. Inventory for low-volume products were maintained in a few locations as possible while maintaining service levels that met [read more]