Here's a business secret. Top global consulting firms—like Deloitte, Bain, BCG—that sell multi-million dollar engagements on the promise of expertise and past project experience often deploy inexperienced, fresh-out-of-school consultants who do the actual work. Despite their lack of experience, these new consultants still achieve impressive outcomes. How?
The secret is: they use business strategy frameworks. The true expertise and experience come not from the individual consultants, but from these robust frameworks. These tools are well-researched, time-tested, and offer clear guidance. Like recipes for a chef, frameworks provide direction to the management consultant. They allow the consultants to conduct the right types of analysis and draw the right conclusions.
What Is a Business Strategy Framework?
A business strategy framework is a structured methodology designed to tackle common business challenges in an organized, thorough, and efficient manner. These frameworks are the secret tools being heavily used behind the scenes, empowering all the tier-1 strategy consulting firms.
Most things in business and life are governed by Pareto's 20/80 Principle, where 20% of the effort drives 80% of the results. Business frameworks allow us to eliminate the 80% of ineffective effort to focus on the 20% that drive the most impact. This saves us time, effort, and capital, so we can focus our resources on more value-added activities. It is the essence of strategic efficiency.
20 Powerful Business Strategy Frameworks
In this article, we will provide primers to 20 of the most impactful business strategy frameworks, from well recognized strategic classics to newer emerging management models. These frameworks include ones that analyze both internal and external factors. We have also included several maturity models, which are especially relevant to organizations experiencing growth challenges, providing insights into how they can overcome these hurdles and improve their operations.
These frameworks are listed in alphabetical order.
Balanced Scorecard (BSC)
The Balanced Scorecard (BSC) is the leading strategic performance management framework, pioneered by Robert Kaplan and David Norton. Whereas conventional strategic performance management focuses on financial metrics, the BSC takes a "balanced" approach, in that it factors in both financial and non-financial metrics (i.e. customer relationship, internal business process, and learning).
BSC also relies on 4 key management processes to connect short-term activities to long-term objectives:
- Translating the Vision
- Business Planning
- Communicating and Linking
- Feedback and Learning
Most Fortune 500 companies have adopted a BSC as their strategic performance management system of choice.
Blue Ocean Strategy (BOS)
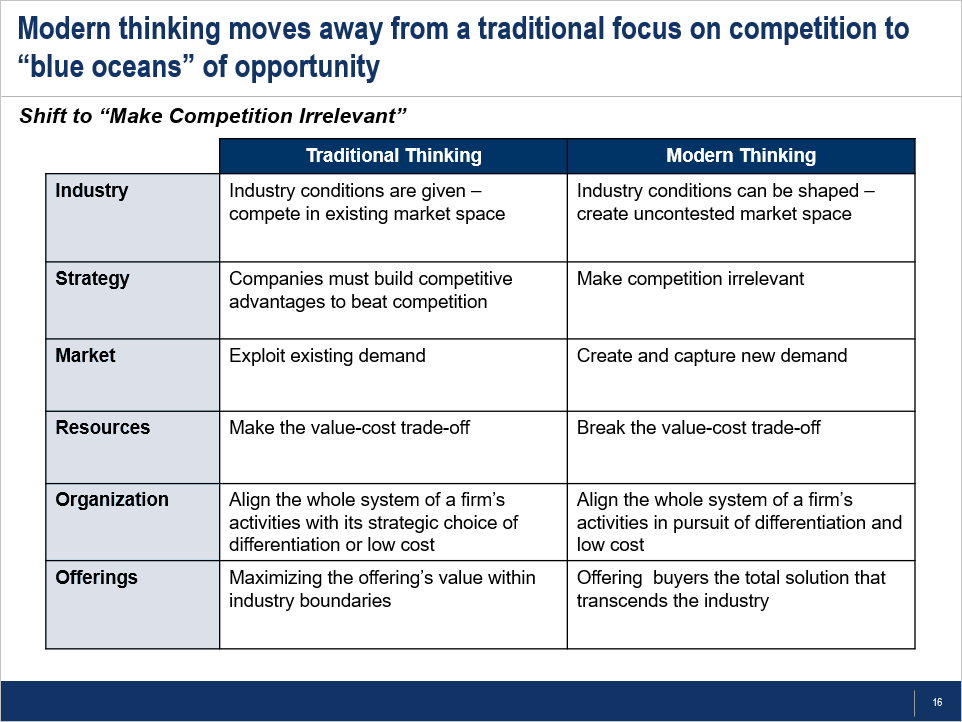
Blue Ocean Strategy (BOS) is a Growth Strategy, Innovation Management, and Value Creation framework focused on the idea of creating an uncontested market space with minimal or non-existent competition—in other words, a "blue ocean." The BOS framework evolved from a framework called Value Innovation, developed by Kim and Mauborgne in the late 90s at Gemini Consulting (now Capgemini).
Developing a Blue Ocean Strategy involves innovating your offerings by enhancing or introducing features where competitors are absent and reducing or eliminating aspects where competitors are present. Through this, you can carve an emergent, uncontested market. These 4 primary actions of raise, create, reduce, and eliminate are also known as the "4 actions" of BOS.
An example of BOS in practice is Airbnb. Airbnb created new, uncontested market by focusing on unique, personalized lodging experiences, including unique accommodations (e.g. treehouses, castles), while it de-emphasized traditional, costly hotel chain amenities and experiences (e.g. nice hotel lobby, bar, room service, etc.).
When BOS was first introduced through the Harvard Business Review, it quickly gained extreme interest due its contrarian strategic principles. Whereas conventional strategic thinking, pioneered by Michael Porter, focused on fighting competitors head-on within fixed industry forces, BOS sought to make competition irrelevant by reshaping the industry.
BOS can be leveraged to drive Business Model Innovation (BMI).
BCG Growth-Share Matrix
The BCG Growth-Share Matrix is a classic Strategy framework introduced in the 1970s by the Boston Consulting Group to determine competitive positioning for products and business lines. This business strategy framework is designed to help with long-term strategic planning.
The BCG Matrix is captured as a 2x2 matrix with the 2 axes defined as Market Growth and Market Share.
The 4 quadrants of the BCG Matrix each have distinct cash flow characteristics and implications. They are called:
- Cash Cows (Low Market Growth, High Market Share): Cash Cows generate more cash than they consume, supporting other business units that need investment. The strategy is to invest just enough to maintain market share without trying to grow, allowing the company to use the generated surplus in other areas.
- Stars (High Market Growth, High Market Share): Stars are leaders in high-growth markets, requiring significant investment to sustain their growth and fend off competitors. The goal is to ensure they turn into Cash Cows as market growth slows.
- Question Marks (High Market Growth, Low Market Share): Question Marks, sometimes also referred to as Problem Children, require significant resources to increase market share, but there's no guarantee of success. Strategic choices typically involve investing to grow, divesting, or discontinuing.
- Dogs (Low Market Growth, Low Market Share): Dogs have a weak position in low-growth markets and typically do not generate substantial cash for the company. The recommended strategy often involves divesting these business units to reallocate resources more efficiently to areas with higher returns.
Each quadrant requires a distinct strategic approach, helping firms allocate resources more effectively and make informed decisions about where to invest, develop, harvest, or divest. For instance, a product in the dog quadrant exhibits both low growth and low market share, so we should consider divesting or winding it down. We can also map competitors to conduct competitive analysis.
Note that in today's rapidly changing Digital Age, market share is no longer as direct a predictor of business performance.
Consolidation Curve
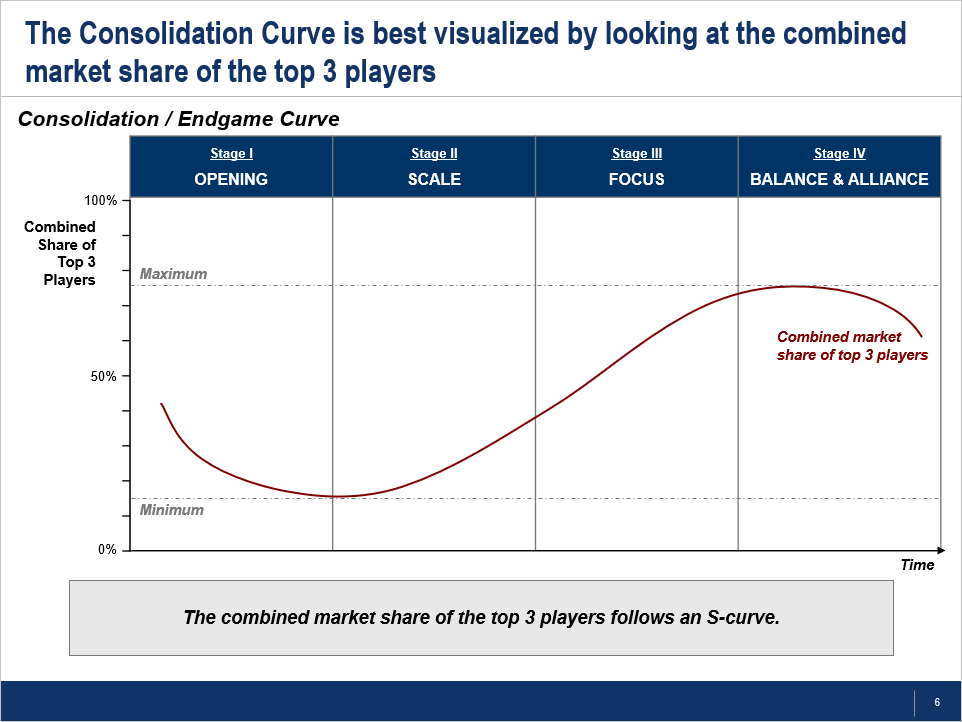
The Consolidation Curve framework is not a well-known framework, but is one that offers incredible insights into market dynamics and competitive strategies. This business strategy framework, a maturity model, was developed by global consulting firm AT Kearney. It is based on research of 25,000 firms, representing 98% of the global market cap. AT Kearney realized that all industries evolve through the same 4-stage lifecycle—i.e., the Consolidation Curve.
The 4 stages of the Consolidation Curve are:
- Opening: In the initial Opening stage, the industry is fragmented, with many small players. There is little consolidation. The prevailing strategy at this stage is to focus on innovation, establishing market presence, and creating a unique value proposition to stand out.
- Scale: In the second stage, some leading players begin to emerge, leading to increased industry concentration. At this stage, organizations should focus on achieving economies of scale, improving operational efficiencies, and pursuing mergers and acquisitions to gain market share and strengthen competitive positioning.
- Focus: During Focus, a few large players begin to dominate the market. These major players have usually established strong positions in their respective segments. At this stage, organizations should concentrate on core competencies, enhance their value chain, and possibly pursue strategic partnerships or acquisitions to solidify their market position and prepare for the next stage.
- Balance and Alliance: At this final, most mature stage, the industry becomes highly consolidated, with a few global giants dominating the market. Competition is based more on innovation and strategic alliances than on price. Organizations focus on global expansion, innovation, and forming strategic alliances or partnerships. There's also a focus on efficiency and adapting to market changes to maintain a competitive edge.
By first identifying what stage our industry is in, we can better understand and predict competitive behavior and other market forces (e.g. regulatory changes). The stage also helps us understand what type of management and leadership style works best for the organization. In other words, the CEO who leads the organization through Scale (stage 2) may not be the right leader during Balance (stage 4).
We recommend every organization to integrate this model into their strategic planning process.
Consumer Adoption Curve (and) Product Lifecyle
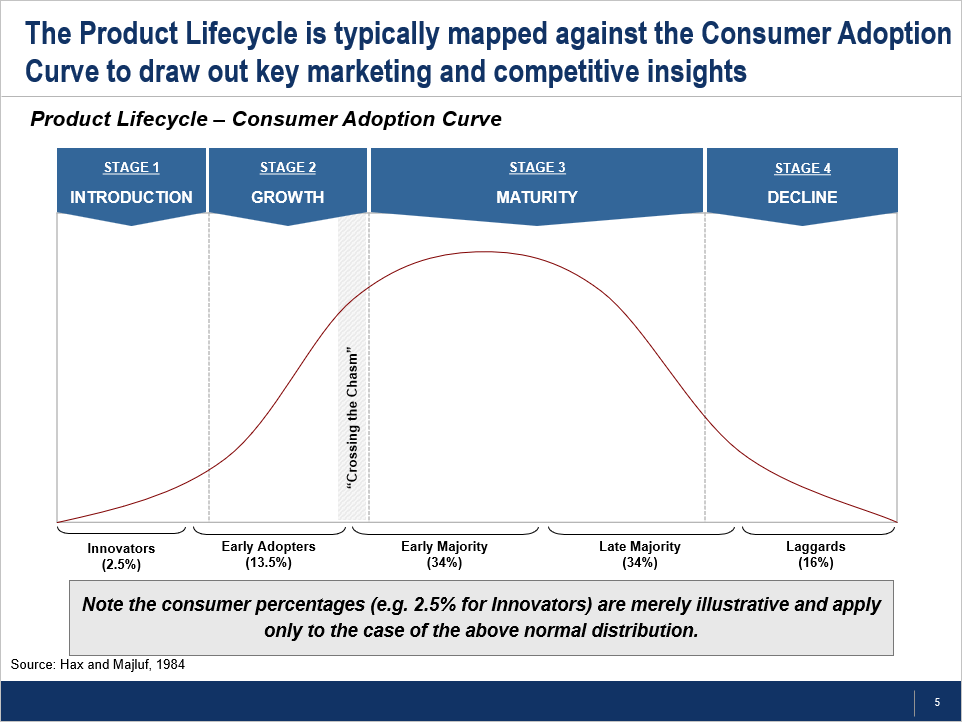
The Consumer Adoption Curve and Product Lifecycle are 2 strategic maturity models. Let's discuss them together, as we will shortly see they are quite complementary.
The Consumer Adoption Curve consists of five stages:
- Innovators: These individuals are the earliest adopters of a new product, characterized by a willingness to take risks, young age, high social class, financial acumen, strong social networks, and interaction with influential sources.
- Early Adopters: They exhibit significant opinion leadership, are typically younger, possess higher social status, financial stability, advanced education, and are socially progressive.
- Early Majority: This group adopts the product after some time, with a longer adoption period compared to Innovators and Early Adopters. They have above-average social status, contact with Early Adopters, and limited opinion leadership.
- Late Majority: Adopters who join after the majority, with a high degree of skepticism. They tend to have below-average social status, limited financial stability, and minimal opinion leadership.
- Laggards: The final group to adopt is characterized by resistance to change, older age, focus on tradition, lowest social status, financial stability, and limited social networks beyond family and close friends.
This framework helps us better understand our target customer and extent of market penetration. It also provides guidance on how to adjust our targeting to increase market penetration.
The Product Lifecycle framework outlines the 4 stages a product goes through, from creation to obsolescence:
- Introduction: At this initial stage, the product is launched and we must define our go-to-market and pricing strategies. An important strategic question is whether to focus on market penetration for greater consumer adoption or market skimming for higher a profit margin.
- Growth: Here, the focus shifts to improving sales and market share. This is done by improving Customer Satisfaction to foster Customer Loyalty and drive repeat purchases, often targeting the Early Majority market segment.
- Maturity: By this stage, sales growth begins to plateau, as the product becomes well-established and competition intensifies. Organizations in this stage choose between maintaining, defending, or innovating, based on competitive dynamics within the industry.
- Decline: In the final stage, sales start to decline, as the product becomes outdated or disrupted; or the market is already saturated. Strategic decisions revolve around focusing on innovation or making an exit strategy.
By considering the product category's maturity, this framework helps us forecast sales expansion, anticipate behaviors from customers and competitors, and thereby inform the strategic approach to product marketing.
Using the Product Lifecycle with the Consumer Adoption Curve frameworks together further enhances strategic insight, enabling organizations to identify the most suitable market segment to target at various phases of the product's life. Furthermore, it also aids in tailoring communication and product development strategies to meet the evolving needs and preferences of consumers. This alignment ensures that marketing efforts more effectively resonate with the intended audience, maximizing engagement and adoption rates throughout the product's lifecycle.
Digital Transformation Strategy
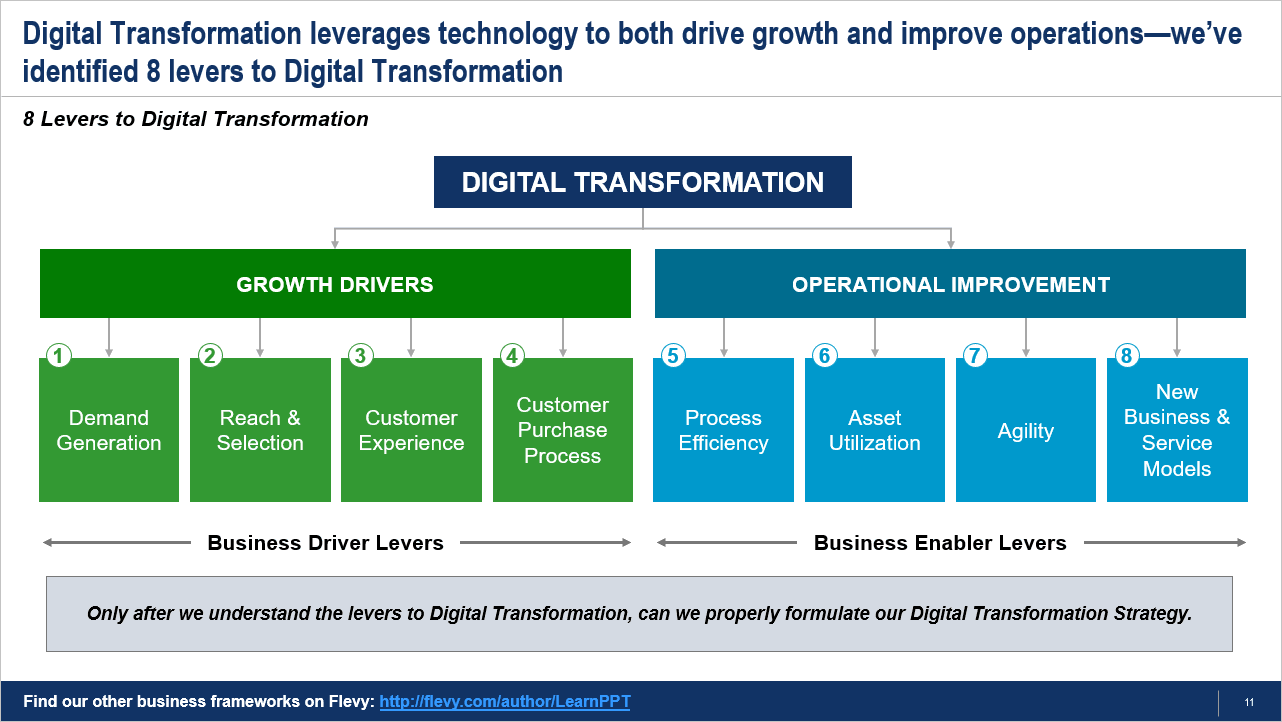
There are numerous Digital Transformation Strategy frameworks put forth by strategy consulting firms. In this article, we will discuss the one developed by LearnPPT Consulting, according to which Digital Transformation is driven by 8 levers:
- Demand Generation
- Reach & Selection
- Customer Purchase Process
- Customer Experience
- Process Efficiency
- Asset Utilization
- Agility
- New Business & Service Models
The first 4 levers are business growth drivers. Each lever allows organizations to drive top-line revenue growth. This represents a fundamental shift in thinking of how technology supports organizations and is a key difference between a Digital Transformation Strategy vs. a conventional IT Strategy. Whereas traditional IT Strategy views technology as merely a support function, Digital Transformation Strategy also views technology as a strategic function.
The next 4 levers are business enablers that drive operational improvement. These help organizations make processes more efficient and reduce costs.
Five Stages of Business Growth
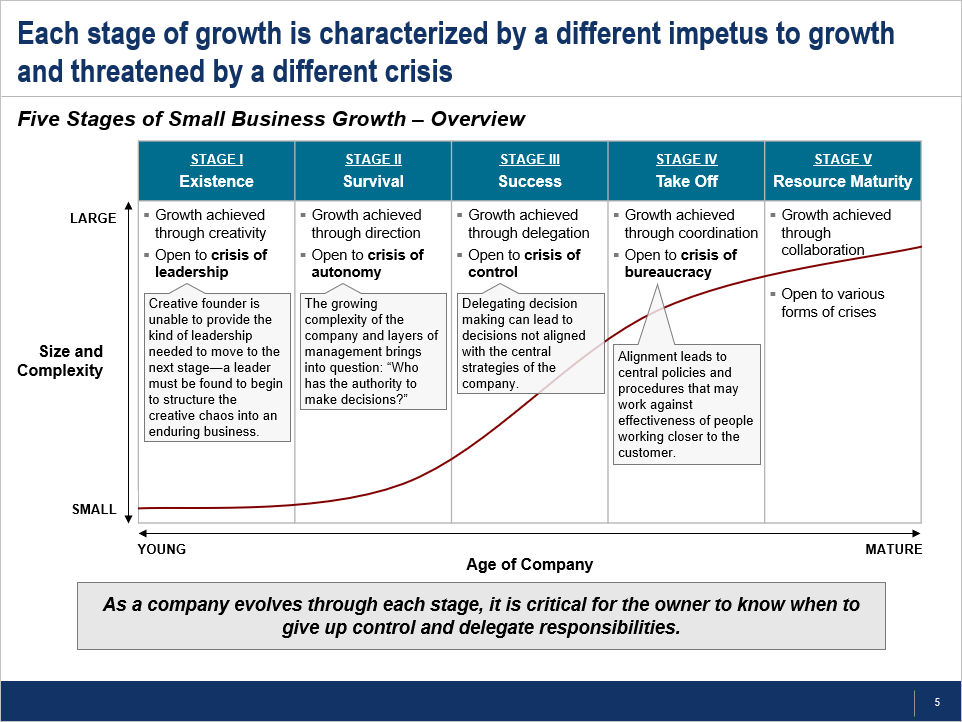
The 5 Stages of Business Growth is a strategic maturity model based on the fact that all organizations experience common problems that arise at similar stages in their development.
The 5 stages are defined as:
- Existence
- Survival
- Success
- Take Off
- Resource Maturity
Every growth stage is marked by unique growth drivers and faces distinct challenges. For instance, at the Success stage, growth is achieved through delegation, but the organization is now open to the "crisis of control," as delegating decision making can lead to decisions not aligned with the central strategies of the organization.
Each stage also has other defining characteristics, such as management style, strategic focus, critical success factors, owner involvement, and others. Just like with the Consolidation Curve, knowing what stage we are operating in can unlock powerful insights.
As the organization matures from small to enterprise, the need for varied management approaches often necessitates changes within the management team itself. In fact, there comes a time where it is imperative for the owner to relinquish control and entrust others with key responsibilities. A reluctance or delay in doing so can significantly hinder (or permanently stall) the company's growth trajectory and limit its ultimate potential.
This is a powerful business framework that not only provides guidance on Corporate Strategy, but also insights on Leadership and Organizational Design.
GE-McKinsey Matrix
GE-McKinsey Matrix is another classic strategy framework. It was developed by McKinsey in the 1970s, when they were commissioned by General Electric to develop a Portfolio Management Model. This strategic tool evaluates business units on 2 critical dimensions:
- The attractiveness of the industry
- The competitive strength of the unit within that industry
It takes the form of a 3x3 matrix that uses a multi-factorial analysis technique to determine the product(s)—that should be essentially added to the product portfolio—and the opportunities to invest in the market. More specifically, organizations leverage the GE-McKinsey Matrix to allocate resources effectively, steering investments towards units with the most potential for growth and profitability, while considering divestment from those in less attractive industries or with weaker competitive positions.
Greiner Growth Model
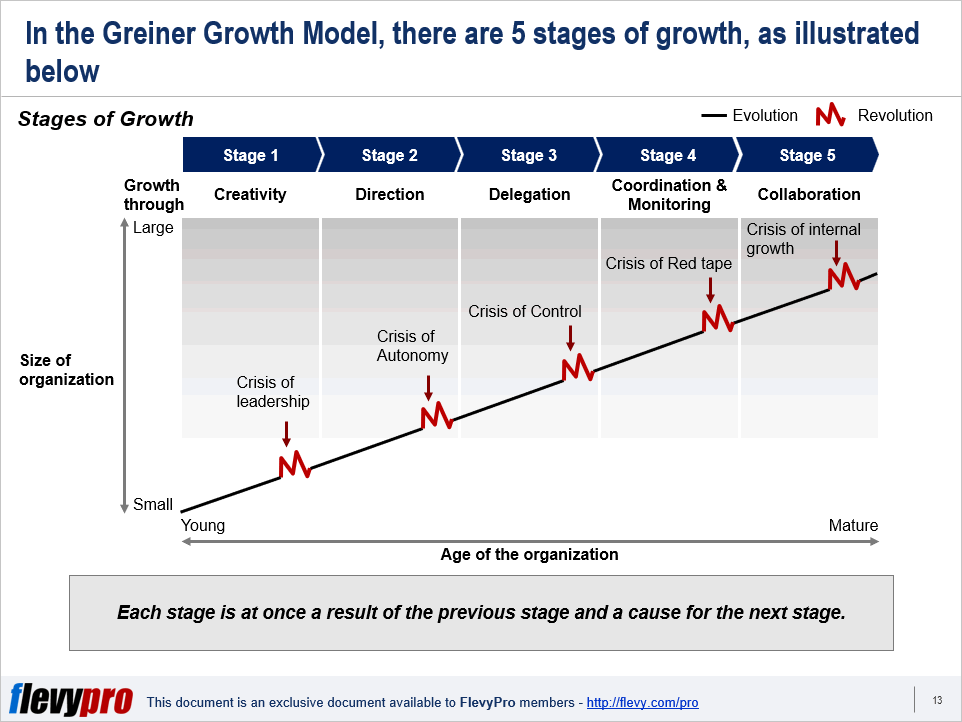
Developed by Larry Greiner, the Greiner Growth Model, is a strategic maturity model describing how organizations evolve through 5 stages of growth:
- Creativity: Characterized by entrepreneurial spirit and innovation, this stage focuses on creating products and markets, often leading to a crisis of leadership as the need for structured management becomes evident.
- Direction: This stage sees the implementation of a formal leadership structure to address the crisis of autonomy, with a focus on establishing clear roles, direct supervision, and often culminating in a crisis of autonomy as employees seek more independence.
- Delegation: With further growth, the organization decentralizes, granting more autonomy to managers, leading to a crisis of control where the central leadership struggles to maintain the coherence of the expanding organization.
- Coordination & Monitoring: At this stage, formal systems and procedures are introduced for better coordination, which eventually leads to a crisis of red tape, as these systems begin to stifle innovation and agility.
- Collaboration: This stage emphasizes greater flexibility and teamwork to solve the crisis of red tape, focusing on cross-functional teams and a more informal management style, which may lead to a crisis of internal growth as the organization seeks new growth pathways.
Each growth stage requires different strategies and structures to be effective. The Greiner Growth Model is a maturity model that offers insights into the effectiveness of different management styles, organizational structures, and coordination strategies at various phases of an organization's development.
Sound familiar? It is very similar in concept to the 5 Stages of business Growth framework. Organizations will often use both of these frameworks together.
The Greiner Growth Model suggests the future and growth of an organization is less determined by outside forces than by the organization's history and management structure. This is an effective model to analyze the current growth of a business and plan ahead for the challenges experienced by growing organizations.
Hoshin Kanri
Hoshin Kanri, Japanese for "direction management," is a Lean Management framework used for strategy deployment and implementation. It is designed to ensure that an organization focuses towards achieving its most critical annual objectives, ensuring that all employees are pulling in the same direction.
Implementing Hoshin Kanri involves several key steps:
- Define the strategic objectives that are critical for the organization's success.
- Communicate these objectives to the people in your organization, ensuring that each department and employee understands their role in achieving the overarching goals.
- Schedule regular review sessions to monitor progress, identify any deviations from the plan, and make adjustments if necessary.
Through this disciplined approach, Hoshin Kanri fosters a culture of continuous improvement and strategic focus.
Numerous Fortune 500 companies, like Toyota, HP, and Xerox, leverage Hoshin Kanri for strategic planning and execution.
This 54-slide presentation introduces 12 powerful business frameworks spanning both Strategy Development and Strategy Execution. Topics covered include: Porter's Five Forces, Product Lifecycle, Consumer Adoption Curve, BCG Matrix, SWOT, PEST, Marketing Mix, etc.
Objectives and Key Results (OKR)
Objectives and Key Results (OKR) is a strategic performance management framework developed by Intel in the 1970s. In recent years, it has gained tremendous popularity and adoption, particularly in the tech startup space.
OKRs provide an effective method for monitoring company and team objectives, as well as assessing their progress. By emphasizing important goals and eliminating distractions, OKRs foster focus and efficiency—and can contribute significantly to organizational success.
As the name suggests, the premise of the OKR framework is comprised of 2 components:
- Objective: This is a significant, concrete, clearly defined goal.
- Key Results: These are measurable success criteria used to track the achievement of that goal.
Typically, each objective is supported by 3-5 key results.
Let's look at a specific example:
Objective: Improve customer satisfaction by the end of Q2.
Key Results:
- Increase the customer satisfaction score from 80% to 90%.
This key result provides a clear, measurable target for improvement, indicating a direct impact on customer satisfaction. - Reduce average customer support response time from 24 hours to 2 hours.
By setting a specific target for response time, this key result aims to enhance the customer experience, contributing to the overall objective of improving satisfaction. - Launch a new customer feedback tool and achieve a 25% response rate.
Implementing a new tool for gathering customer feedback and setting a target for engagement can help in understanding customer needs and areas for improvement. - Increase customer retention rate by 5% through personalized follow-ups and offers.
This key result focuses on tangible outcomes (retention rate increase) that contribute to higher customer satisfaction.
Observe in this example that each of these key results is measurable and directly contributes to achieving the main objective of improving customer satisfaction. They also provide clear targets for the team to aim for and track progress against throughout the quarter.
We can deploy OKRs in conjunction with BSC for more effective strategic management. OKRs can also be used for goal setting at the departmental and team levels.
Organic Growth Framework (OGF)
The Organic Growth Framework (OGF) is a new age growth strategy framework developed in the last 10 years. The conventional approach to organic growth is to focus on product differentiation and then marketing it. OGF takes a different view by focusing on altering customer behavior, rather than differentiating products.
The core concept of the OGF is that we can achieve stronger growth by pinpointing and prioritizing 1 to 2 high-impact customer behaviors. Through this approach, we will alter customer behavior at critical points in their buying journey, thereby directing them onto purchase and decision paths most favorable to our product.
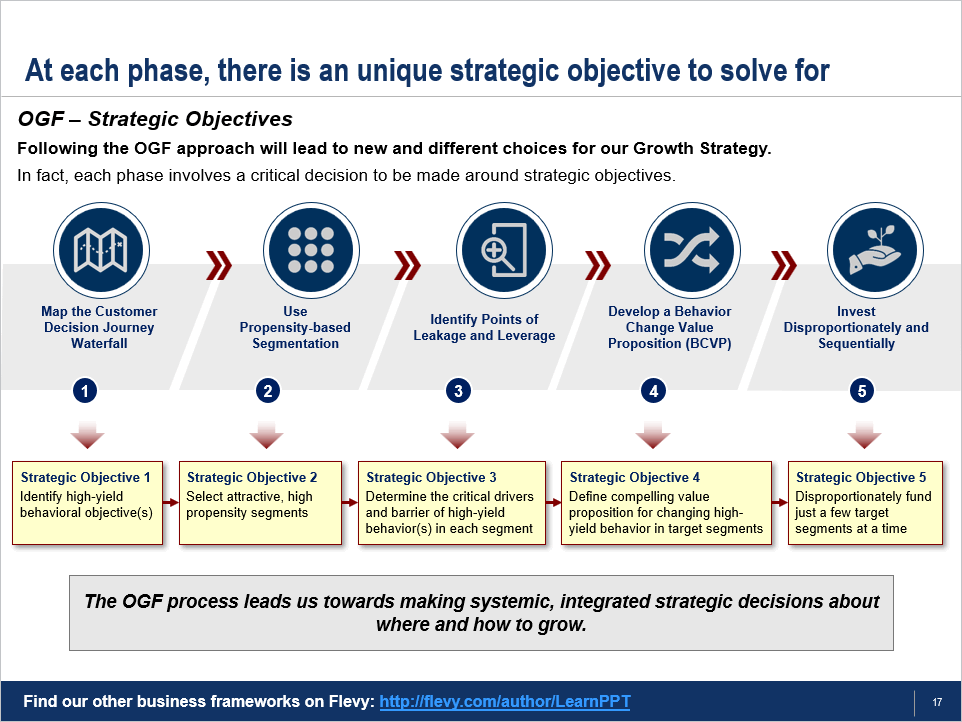
OGF follows a 5-phase process:
- Map the Customer Decision Journey Waterfall
- Use Propensity-based Segmentation
- Identify Points of Leakage and Leverage
- Develop a Behavior Change Value Proposition (BCVP)
- Invest Disproportionately and Sequentially
You can compare OGF with Blue Ocean Strategy and use these 2 business strategy frameworks in parallel.
Porter's Five Forces
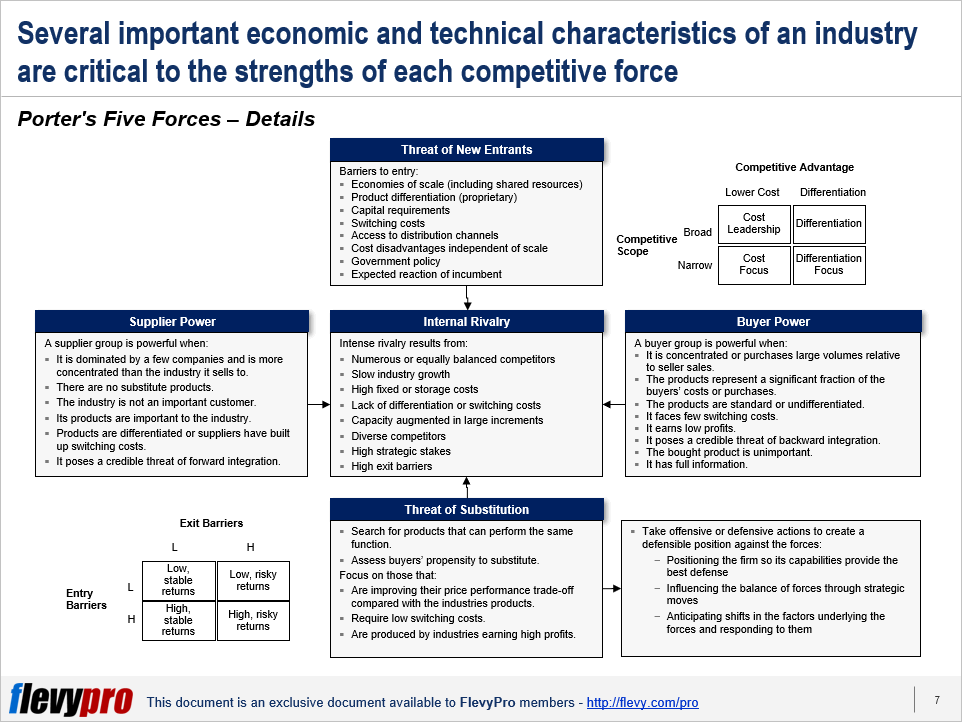
Porter's Five Forces is perhaps the most well-known business strategy framework, pioneered by Michael Porter. Porter's Five Forces is a powerful framework that evaluates the competitiveness of an organization by examining the 5 main driving "forces" in the industry.
These 5 forces that drive the competitive dynamics within the industry are:
- Threat of New Entrants
- Supplier Power
- Buyer Power
- Threat of Substitution
- Internal Rivalry
Through the analysis of these external factors in the existing market, there are 3 generic competitive strategies that organizations can follow to gain a competitive advantage:
- Cost Leadership: This strategy focuses on becoming the lowest cost producer in the industry.
- Differentiation: Differentiation strategy involves providing unique market offerings, setting yourself apart from competitors.
- Focus: The focus strategy concentrates on serving a particular market segment or niche better than competitors.
Most of "modern strategy" is based on the thought leadership of Michael Porter and this foundational framework.
Value-based Pricing Strategy
Developed by A.T. Kearney, Value-based Pricing Strategy is 1 of the 3 main types of Pricing Strategies. The other 2 are Cost-based Pricing and Competitive Pricing.
Value-based Pricing takes into account the value that a new product or service provides to the customer. This approach provides insights into new ways of delivering a product or service. Through Value-based Pricing, businesses build a deeper understanding of their customers' business drivers, align their goals to their customers', and share in each others' fortunes in a way that isn't possible with conventional Pricing Strategies.
Implementing Value-based Pricing Strategy follows a 4-phase approach:
- Find the value ceiling
- Create customer segments
- Determine equitable split
- Develop pricing structure
Rogers' Five Factors
Developed by Everett Rogers, Rogers' Five Factors is a product strategy framework for analyzing and understanding the diffusion and adoption of product innovations.
This helps companies anticipate and guide consumer acceptance of innovations by focusing on 5 product-based attributes. By the way, Everett Rogers also developed the Consumer Adoption Lifecycle (discussed earlier), another widely used product strategy framework that concentrates on the product adoption patterns of customers.
This business strategy framework states that the rate of innovation diffusion can be determined by evaluating 5 product-based factors:
- Relative Advantage
- Compatibility
- Complexity
- Trialability
- Observability
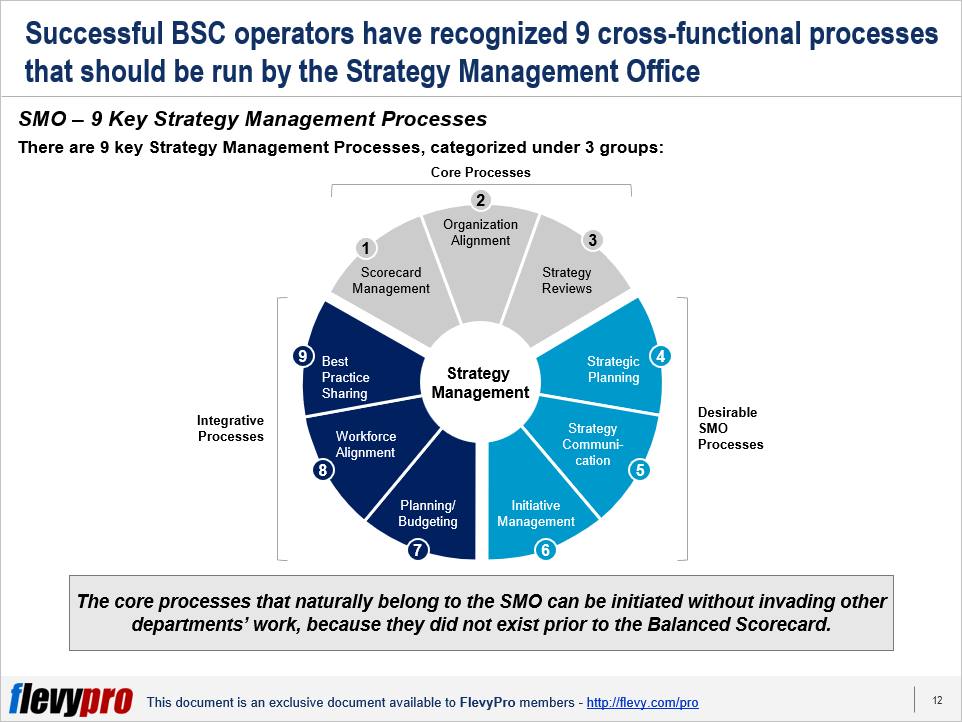
Strategic Management Office (SMO)
The Strategy Management Office (SMO) oversees deployment of the organization's Corporate Strategy. This concept was pioneered by Kaplan and Norton, authors of the Balanced Scorecard (BSC).
The primary responsibility for implementing Strategy falls on line managers and employees. However, without a central command and coordination office, such as the SMO, Strategy may be overlooked in critical processes or those processes may prove ineffective across business units, leading to weak Strategy Execution.
The SMO is responsible for managing 9 strategic cross-functional processes:
- Scorecard Management
- Organization Alignment
- Strategy Review
- Strategic Planning
- Strategy Communication
- Initiative Management
- Planning/Budgeting
- Workforce Alignment
- Best Practice Sharing
The SMO should be deployed along with the BSC, as part of a unified strategic performance management system.
SWOT Analysis
SWOT Analysis is another classic strategic framework used for assessing an organization's internal capabilities. It is an acronym for:
- Strengths: Strengths are internal attributes and resources that support a successful outcome.
- Weaknesses: Weaknesses are internal factors that detract from an organization's ability to achieve its objectives.
- Opportunities: Opportunities are factors external to an organization that it could exploit to its advantage.
- Threats: Threats are external challenges that could cause trouble for the organization.
A SWOT analysis has become an integral part of any strategic planning process. Conducting a SWOT analysis benefits organizations by providing clear insights that aid in strategic decision-making, allowing them to leverage their strengths, tackle their weaknesses, capitalize on opportunities, and counter potential threats.
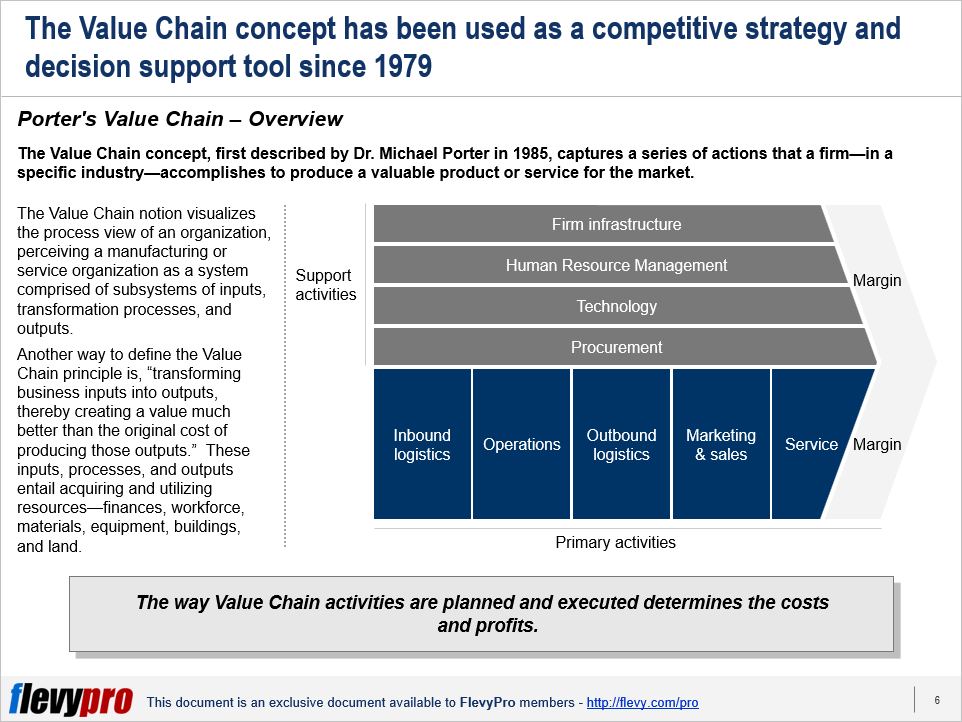
Value Chain Analysis
The Value Chain concept is also authored by Michael Porter and, thus, is often referred to as Porter's Value Chain. It outlines the sequence of activities an organization (within a specific industry) undertakes to deliver a valuable product or service to the market, from raw materials supplier to the end consumer.
The Value Chain is depicted through the Value Chain framework diagram, which identifies and visualizes the 4 primary activities and 5 support activities that contribute to an organization's Value Creation.
Value Chain Analysis (VCA) is the process of analyzing an organization's (or industry's) Value Chain and follows a 3-phase process:
- Activity Analysis
- Value Analysis
- Evaluation and Planning
Porter's VCA provides a systematic approach to examining the activities of an organization, identifying areas where value can be added or costs reduced, thus offering insights into gaining a competitive advantage.
Value Disciplines Model
We will end on another classic business strategy framework, the Value Disciplines Model, developed by Treacy and Wiersema. According to Treacy and Wiersema, organizations must confront difficult strategic decisions to achieve market leadership. Market leaders commit to excelling in providing exceptionally high levels of a specific value to their customers, allowing them to stay concentrated and excel in a particular value proposition.
A "value discipline" refers to a distinct value that organizations offer to a targeted market. There are 3 such value disciplines:
- Operational Excellence
- Product Leadership
- Customer Intimacy
The Value Discipline Model aligns with Porter's generic competitive strategies (discussed earlier). This framework is also unique in that it considers both internal and external factors. You may have noticed most frameworks focus on either internal (e.g. SWOT Analysis) or external (e.g. Porter's Five Forces) factors, but not both.
The Value Disciplines Model allows organizations to distinguish themselves from competitors by delivering exceptional value in a specific area, leading to enhanced customer loyalty, market differentiation, and long-term success.
We've just summarized 20 time-tested business strategy frameworks leveraged by top consulting firms, like McKinsey, Bain, and BCG, to drive successful outcomes for clients. From the Digital Transformation Strategy to the Greiner Growth Model to the Consolidation Curve, each framework offers a structured approach for organizations to understand, analyze, and optimize their current challenges.
This guide not only outlines each framework's foundational concepts, but also demonstrates their practical applications in formulating effective strategies and achieving Operational Excellence. By understanding and applying these frameworks, organizations can navigate the challenges of complex business situations and come out successful.
The true power of these business frameworks lies in their ability to bridge the gap between theoretical strategy and practical execution. While the frameworks provide structured methodologies and systematic approaches, their real value is unlocked when they are adapted and tailored to the unique context and dynamic challenges of an organization.
Executives must recognize that frameworks are not one-size-fits-all solutions, but starting points for strategic thinking. They necessitate a deep understanding of their organizations' specific business environments, competitive landscapes, and organizational capabilities. By integrating these frameworks with a nuanced appreciation of their own unique circumstances, organizations can transform strategic insights into actionable plans that drive sustainable growth and an enduring competitive advantage.
Moreover, the proliferation of digital transformation and disruptive technologies underscores the need for agility in strategic planning. As markets evolve at an unprecedented pace, the agility to pivot and adapt frameworks in real-time becomes a critical differentiator.
Executives must cultivate a culture of continuous learning and innovation, encouraging teams to experiment with and iterate on these frameworks. This agile mindset not only enhances the relevance and impact of strategic initiatives, but also empowers organizations to anticipate and respond proactively to emerging trends and challenges. By fostering a blend of structured strategic planning with adaptive execution, organizations can navigate the complexities of modern business landscapes with resilience and foresight, ensuring long-term success and operational excellence.
LIST OF FRAMEWORKS
1. Balanced Scorecard 2. Blue Ocean Strategy (BOS) 3. BCG Growth-Share Matrix 4. Consolidation Curve 5. Consumer Adoption Curve 6. Product Lifecycle 7. Digital Transformation Strategy 8. Five Stages of Business Growth 9. GE-McKinsey Matrix 10. Greiner Growth Model 11. Hoshin Kanri 12. Objectives & Key Results (OKR) 13. Organic Growth Framework (OGF) 14. Porter's Five Forces 15. Value-Based Pricing Strategy 16. Rogers' Five Factors 17. Strategic Management Office (SMO) 18. SWOT Analysis 19. Value Chain Analysis 20. Value Disciplines Model
Flevy is the world's largest knowledge base of business strategy frameworks.

Leverage the Experience of Experts.
Find documents of the same caliber as those used by top-tier consulting firms, like McKinsey, BCG, Bain, Deloitte, Accenture.

Download Immediately and Use.
Our PowerPoint presentations, Excel workbooks, and Word documents are completely customizable, including rebrandable.

Save Time, Effort, and Money.
Save yourself and your employees countless hours. Use that time to work on more value-added and fulfilling activities.
