Editor's Note: Take a look at our featured best practice, Objectives and Key Results (OKR) (23-slide PowerPoint presentation). Successful organizations are using Objectives and Key Results (OKR) now. OKRs are efficient way to track company and team goals and measure their progress. It helps every organization's success by cutting out unimportant goals and focusing on what truly is important within the organization.
OKR [read more]
* * * *
Editor’s Note: This article is contributed by Alex Townend, the CEO of Constancia. Constancia is an EPM consultancy that makes multi-entity finance data AI-ready. We diagnose the data model before we quote. The price is then fixed.
* * * *
Enterprise performance management (EPM) programmes in multi-entity groups tend to overrun for the same reason. The scope and budget are agreed before anyone has examined the data model the new platform will sit on.
The data model is how a group’s entities, accounts, currencies and intercompany relationships are structured. Consolidation, planning and reporting all read from it. If it is inconsistent, a new platform reproduces the inconsistency faster.
This article sets out a 5-part review that a finance leader, or the adviser supporting them, can run before a price is agreed. Each part has a question to answer, the evidence to collect and what a warning sign looks like.
1. The Entity Structure Shows Whether the Group Can Be Consolidated Cleanly
Question: does every legal entity map to the group structure in one agreed way?
Evidence:
a list of entities with their ERP, currency and ownership percentage
the reporting hierarchies used for statutory and management views
any entity that is consolidated outside the main tool
Warning sign: management and statutory views are built from different hierarchies, and nobody can say when they last reconciled.
2. The Chart of Accounts Shows How Much Translation the Close Depends On
Question: how far do local charts of accounts differ from the group chart, and how is the gap bridged?
Evidence:
the mapping tables from each local chart to the group chart
who maintains them, and how changes are approved
accounts mapped to “other” or a suspense line
Warning sign: mappings live in spreadsheets maintained by 1 or 2 people, with no change log.
3. Intercompany Matching Shows Whether Eliminations Can Be Trusted
Question: are intercompany balances matched by the system, or by people at month end?
Evidence:
the intercompany matching process and its timetable
the value of unmatched differences at the last 3 closes
any manual elimination journals
Warning sign: unmatched differences are written off at group level every month rather than resolved in the entities.
4. Manual Adjustments Show Where the Real Close Happens
Question: which numbers in the final reports were changed after the system produced them?
Evidence:
top-side journals and their reasons for the last 3 closes
reports that are finished in a spreadsheet before they go to the board
adjustments that recur every month
Warning sign: the same adjustment appears every month. A recurring adjustment is a rule the system should hold and does not.
5. History and Definitions Show What the New Platform Can Be Trusted With
Question: how far back can the data be trusted, and do the documented definitions match what runs?
Evidence:
the number of years of history available at the level of detail planning needs
restatements after acquisitions or restructures
definitions of headline measures, such as EBITDA or headcount, compared with how they are calculated in practice
Warning sign: planning needs 3 years of comparable history, and only 1 year exists on a consistent basis.
The Output Is a Written List of Risks Tied to the Work They Would Affect
The review ends with a short document. For each finding it states the risk, the part of the programme it would affect and what it would cost to fix.
That document changes how a programme is priced. Scope is set against what is actually in the model. Where the data is worse than expected, the cost is known before anyone commits, so it does not arrive later as a change request.
This is the sequence we follow in EPM consulting. We diagnose the data model before we quote. The price is then fixed.
The Review Matters Most When a Group Has a Date It Cannot Move
The groups that gain most from this are those with a complex structure and a fixed deadline. Typical deadlines are:
an IPO or audit readiness date
an integration after an acquisition
a new CFO’s first plan
an ERP replacement
a board asking for AI that the finance data cannot yet support
Each of these asks the data model to carry more than it was built for. Each leaves little room for a programme that overruns.
3 Questions to Put to Anyone Pricing an EPM Programme
Whether the work is done internally or by a firm, these questions separate a plan from an estimate:
Has anyone been into the data model before producing a number?
What happens if the data turns out worse than expected, and who pays for that?
Is the AI foundation being built, or assumed?
If the answer to the first is no, the 5-part review above is the place to start.
Elevate your team's performance and strategy execution to new heights with the Performance Scorecard Framework, crafted by former strategy consultants from elite firms such as BCG and EY. This unique tool combines the strengths of the Balanced Scorecard with an exclusive proprietary [read more]
Do You Want to Implement Business Best Practices?
You can download in-depth presentations on Performance Management and 100s of management topics from the FlevyPro Library. FlevyPro is trusted and utilized by 1000s of management consultants and corporate executives.
For even more best practices available on Flevy, have a look at our top 100 lists:
These best practices are of the same as those leveraged by top-tier management consulting firms, like McKinsey, BCG, Bain, and Accenture. Improve the growth and efficiency of your organization by utilizing these best practice frameworks, templates, and tools. Most were developed by seasoned executives and consultants with over 20+ years of experience.
Readers of This Article Are Interested in These Resources
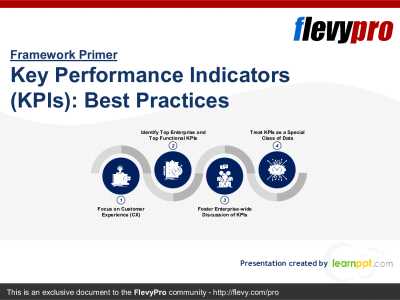
There are clear and measurable differences that exist between organizations that use Key Performance Indicators (KPIs) to monitor and assess performance and those that use KPIs to guide and drive performance improvements. Data-driven and customer-oriented leaders use KPIs to transform their [read more]
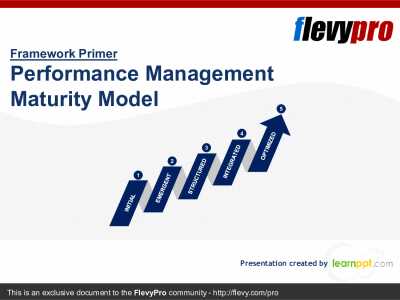
The organizational maturity notion signifies the progress of an organization in terms of developing its people, processes, technology, and capability by implementing quality practices. Organizations aiming to achieve the highest maturity levels in performance need to take care of the intricacies [read more]
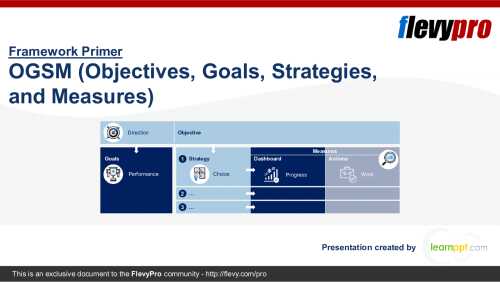
Organizations often face significant challenges in aligning their day-to-day operations with their long-term strategic goals. This issue of strategic misalignment is particularly detrimental to sectors like manufacturing, healthcare, and technology, where rapid decision-making and agility are [read more]
Performance Management (also known as Business Performance Management, and Strategic Performance Management, and Enterprise Performance Management, and Corporate Performance Management) is a Strategic Management approach for monitoring how a business is performing. It describes the methodologies, [read more]
 Enterprise performance management (EPM) programmes in multi-entity groups tend to overrun for the same reason. The scope and budget are agreed before anyone has examined the data model the new platform will sit on.