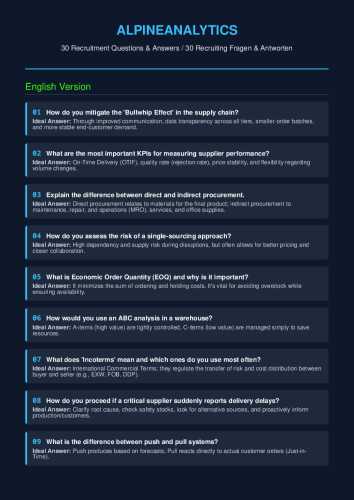
Editor’s Note: Take a look at our featured best practice, Executive COO Operational Performance Dashboard (Excel template). This dashboard consolidates Order Volume, On-Time Delivery, Cycle Time, and 9 other operations KPIs into a single executive cockpit with dynamic dropdowns and target tracking.
* * * *
 Most Supply Chain organizations do not lack data. They lack a structure that connects the data they already collect. A COO looks at a handful of headline numbers once a month. A planner drowns in SKU-level detail every day. A warehouse manager watches a budget spreadsheet that nobody else in the building ever opens. Each layer is measuring something real, but nothing forces the layers to agree with each other, and by the time a cost overrun in the warehouse shows up as a missed delivery target in the boardroom, the root cause is 3 reporting cycles old.
A Supply Chain Control Tower fixes this by design rather than by heroics. It is not a single dashboard; it is 4 layers of Key Performance Indicators (KPI), each answering a different question, each feeding the layer above it. Built correctly, a disruption is visible at the warehouse-cost layer before it ever reaches the CEO’s desk.
Layer 1: Executive Oversight
The top layer exists to answer one question in under 10 seconds: is the operation on track? An executive dashboard collapses the entire operation into a small number of headline metrics, each with a clear target and a visual signal for whether it is trending above or below plan, covering Order Volume, On-Time Delivery, Labor Productivity, Capacity Utilization, Cycle Time, Cost per Order, Defect Rate, Backlog, Inventory Turnover, and SLA Compliance. The point is not precision. The point is that a COO scanning 10 tiles once a week can tell, at a glance, which of the 3 layers below needs attention, without opening a single supporting spreadsheet.
Layer 2: Planning and Risk
Below the executive layer sits the layer that decides what happens next: what to forecast, what to reorder, and what could go wrong before it does. This layer combines revenue and profit forecasting with an operational reorder watchlist, flagging SKUs that have fallen below their reorder point along with the days of inventory cover remaining, and it scores risks by probability and impact so that a packaging delay or a raw-material cost spike is ranked and assigned a mitigation owner before it becomes a stockout. A parallel view of open purchase-order cash and supplier exposure keeps working-capital risk in the same frame as service-level risk, because the 2 are rarely independent.
An Integrated Supply Chain Planning Dashboard is built specifically for this layer, combining forecast, reorder-point, and supplier-risk scoring in a single interactive view.
Layer 3: Logistics Execution
The third layer measures what is actually moving, right now, in transit. Total shipments, on-time rate, delayed shipments, and service exceptions form the core of this layer, alongside total and average shipping cost and average delay in days. A single tile flags shipments in the critical-risk category so that a carrier or lane problem is caught while it is still one late shipment, not a pattern. This is the layer that turns a planning decision made a week earlier into a delivery outcome today, and it is usually the fastest-moving of the 4.
A Logistics KPI Dashboard & Shipment Tracker tracks exactly this set of metrics, with dropdown filters by carrier, region, and shipment status.
Layer 4: Warehouse Cost Control
The base layer is where the money is actually spent, month by month, category by category: storage rent, warehouse labor, equipment, utilities, packaging, maintenance, IT/WMS, and inventory holding cost. Comparing monthly budget against actual spend, with a running variance and a year-end forecast built on current run-rate, turns cost control from a quarterly surprise into a monthly checkpoint. When a warehouse cost line drifts, this is the layer where it shows up first, weeks before it could plausibly move an executive KPI.
A Warehouse Budget Planning and Cost Control Dashboard is purpose-built for this layer, with a monthly budget-versus-actual control table and an automatic year-end forecast.
Case Study
A mid-sized European 3PL ran its Supply Chain on a single monthly executive report and a set of disconnected warehouse spreadsheets. A carrier disruption in Q1 delayed inbound packaging materials by 2 weeks. Because the warehouse cost layer and the logistics layer were not linked to the same reporting cadence, the resulting inventory shortfall did not surface as an executive-level service-level miss until the following month’s report, by which point the backlog had already cost the company its best-performing retail account. After restructuring its reporting around the 4-layer model, the same company caught an almost identical packaging-supplier delay 3 weeks earlier the following year, at the planning-layer reorder watchlist, and resolved it with a spot order before it ever touched a delivery KPI. The infrastructure did not prevent the disruption. It compressed the time between the disruption and the decision to act on it from weeks to days.
FAQs
Do all 4 layers need to update on the same schedule?
No. The executive layer typically runs weekly or monthly, planning runs weekly, logistics execution runs daily, and warehouse cost control runs monthly with a daily-updated run-rate. What matters is that each layer’s data feeds the one above it, not that every layer refreshes at the same frequency.
What is the single most common failure in building a Control Tower?
Starting with the executive dashboard and never building the 3 layers beneath it. A polished set of headline KPIs with no underlying planning, logistics, or cost detail looks impressive and explains nothing when a number moves.
How many KPIs should the executive layer actually show?
Enough to cover volume, service, cost, and quality without requiring a second screen. Ten metrics, each with a clear target, is a workable ceiling; beyond that, the layer stops functioning as an at-a-glance view.
Does this model apply to a single warehouse, or only to multi-site operations?
Both. A single-site operation simply runs a thinner version of each layer. The value of the structure, connecting cost, execution, planning, and oversight, does not depend on scale.
Where should a team start if none of the 4 layers currently exist?
At Layer 3 or Layer 4. Logistics execution and warehouse cost data are usually the easiest to instrument because they already exist in transactional systems; the planning and executive layers can then be built on top once that foundation is reliable.
Concluding Thoughts
The 4-layer Control Tower is not a reporting upgrade. It is a change in how quickly an organization can move from “something is wrong” to “here is exactly where, and here is what we are doing about it.” Most Supply Chains already have the raw data for all 4 layers; what they are usually missing is the deliberate structure that lets a warehouse cost variance, a delayed shipment, a reorder-point breach, and an executive KPI tell the same story, in the same week, instead of 4 separate stories a month apart.
Interested in building out your own Supply Chain Control Tower? You can find editable Excel dashboards for each of the 4 layers on the Flevy documents marketplace: an Integrated Supply Chain Planning Dashboard for Layer 2, a Logistics KPI Dashboard & Shipment Tracker for Layer 3, and a Warehouse Budget Planning and Cost Control Dashboard for Layer 4.
Do You Want to Implement Business Best Practices?
You can download in-depth presentations on Supply Chain Management and 100s of management topics from the FlevyPro Library. FlevyPro is trusted and utilized by 1000s of management consultants and corporate executives.
For even more best practices available on Flevy, have a look at our top 100 lists:
These best practices are of the same as those leveraged by top-tier management consulting firms, like McKinsey, BCG, Bain, and Accenture. Improve the growth and efficiency of your organization by utilizing these best practice frameworks, templates, and tools. Most were developed by seasoned executives and consultants with over 20+ years of experience.
Readers of This Article Are Interested in These Resources
10-page PDF document
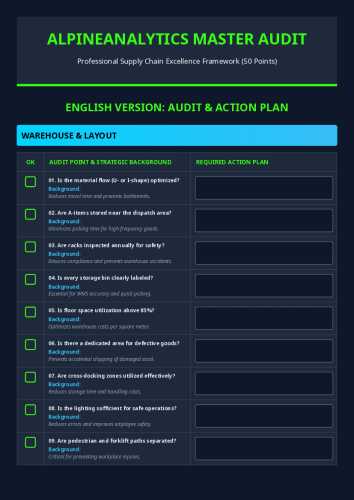
Achieving functional maturity across global logistics and procurement networks requires a highly structured, objective diagnostics system to isolate operational gaps from corporate strategy alignment. In many modern enterprises, supply chain inefficiencies remain deeply hidden across disconnected
[read more]
21-slide PowerPoint presentation
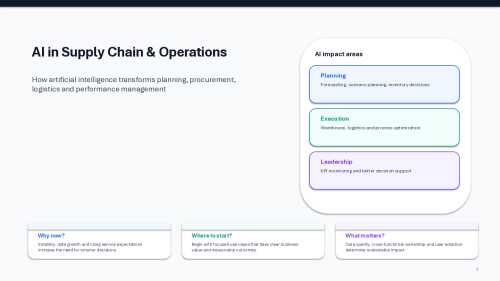
The AI in Supply Chain & Operations PowerPoint Presentation is a professionally designed bilingual presentation template that explains how Artificial Intelligence is transforming supply chain management, logistics, procurement, forecasting, warehouse operations, and executive decision-making.
[read more]
Excel workbook
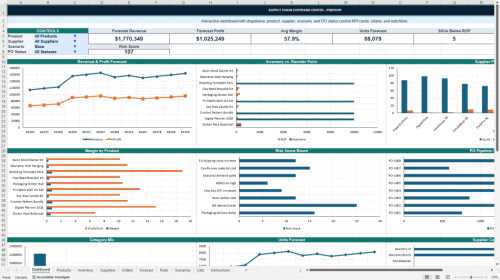
The Integrated Supply Chain Planning Dashboard is a professional Excel-based planning solution designed to help organizations synchronize demand planning, inventory management, procurement, supplier performance, and operational execution through a centralized executive dashboard.
The workbook
[read more]
27-slide PowerPoint presentation
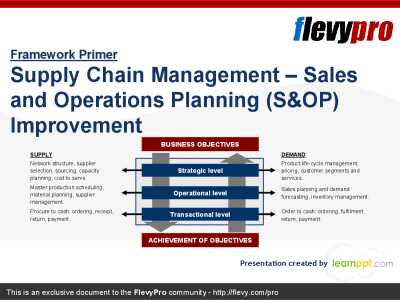
Today's competitive global markets necessitate a strong attention on Supply Chain Management and the underlying Sales & Operations Planning (S&OP) process. Shorter product life cycles, unstable demand, and international supply chains yield planning even more difficult.
This presentations
[read more]