Editor's Note: Take a look at our featured best practice, Complete Guide to Business Strategy Design (51-slide PowerPoint presentation). Summary: This document provides a framework to design your business strategy.
A key question that every business needs to able to answer is "What is our strategy?"
'Strategy' is part of everyday business language and is often used in the wrong context (e.g. 'Operational [read more]
* * * *
A successful business requires both a well developed strategy and the ability to execute on that strategy. Strategy without execution is merely theory. Many companies develop robust strategies, but fail at operationalizing their strategies into implementable steps.
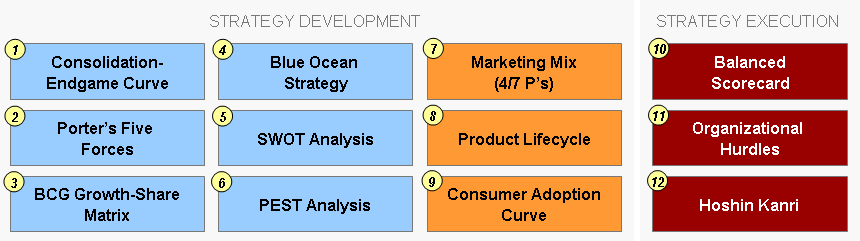
In this article, we will provide overviews for 12 business frameworks related to various aspects of Strategy Development and Strategy Execution. At the bottom, we include references for further information on these business concepts.
Below, we have provided summaries of the 12 strategy frameworks covered in the presentation. Please note the original PowerPoint (complimentary download) is much more comprehensive. It includes additional content, data, and associated framework diagrams.
CONSOLIDATION-ENDGAME CURVE
The Consolidation-Endgame Curve framework (also known as Consolidation Curve or Endgame Curve) is not a well known framework, but is one that offers incredibly insights into market dynamics and competitive strategies.
This framework was developed by the management consulting firm AT Kearney after they performed a study on 25,000 firms, representing 98% of the global market cap. The firm realizes that all industries go through the same 4-stage lifecycle—Opening, Scale, Focus, Balance & Alliance. Across all industries, the same characteristics are exhibited at each stage of the Curve.
By appropriately identifying our stage and understanding the defining traits and behavior of our stage, we can better understand and predict market and competitive behavior and trends. Every major strategic and operational move should be evaluated with regard to the industry’s stage in the Consolidation Curve.
On a more subtle note, the industry stage also governs what type of management and leadership works best for the company. In other words, the management team in the Scale phase may not possess the right skills to run the company at the Balance & Alliance stage.
PORTER’S FIVE FORCES
Developed by Michael Porter, recognized as the father of modern business strategy, Porter’s Five Forces is one of the most well known classic strategy frameworks. Porter’s Five Forces is a framework used for industry analysis and understand the various dynamics amongst industry players and external “forces.”
It is based on the theory that competition in any industry is dependent on 5 basic forces—Potential Entrants, Internal Rivalry, Suppliers, Buyers, and Substitutes (or Complements). The collective strength of these forces determines the ultimate profit potential and allocation in the industry.
Using this framework, we can determine how attract it is to compete in any industry, as well as what the overarching strategy should be to compete successfully in the industry—success is determined by the ability to develop a sustainable competitive advantage. It can also be used to assess which industry trends may pose as opportunities or threats.
BCG GROWTH-SHARE MATRIX
The BCG Growth-Share Matrix (also called Product Portfolio and Boston Matrix) is a classic competitive positioning strategy framework developed by the management consulting firm Boston Consulting Group (BCG). The growth-share matrix displays graphically in a 2-by-2 matrix one of two scenarios:
The position of each business of a company’s portfolio; or
Compares the position of various players in one industry.
The two axes of the matrix are 1) market/industry growth and 2) relative market share (RMS). We then plot our products onto the matrix and quadrant associated with the product drives its strategy.
The quadrants are defined as follows:
Star – high RMS, high market growth;
Cash cow – High RMS, low market growth;
Dog – Low RMS, low market growth; and
Question mark – Low RMS, high market growth.
The key premise to this framework is that products located in each of the quadrants will be in fundamentally different cash flow positions and should be managed differently. This framework is used to assess trends in the evolution of a company’s portfolio of business (when matrix is drawn for both the current year and past years). It can also be used to understand the competitive position of each business, possible cash requirements, and focus attention on key issues.
BLUE OCEAN STRATEGY
Blue Ocean Strategy is growth strategy framework focused on the idea of creating an uncontested market space–i.e. a “blue ocean.” This framework is very innovative, as its principles challenge the conventional business strategy principles of fighting competitors head-on. The Blue Ocean Strategy framework evolved from a framework called Value Innovation developed by Gemini Consulting (now Capgemini Consulting) in the late 90s.
At the heart of Blue Ocean Strategy, we have concept of Value Innovation. Value without innovation tends to focus on value creation on an incremental scale, i.e. something that improves value but is not sufficient to make us really stand out in the marketplace. Innovation without value tends to be technology-driven, market pioneering, or futuristic, often shooting beyond what buyers are ready to accept and pay for.
Value Innovation occurs only if we align innovation with utility, price, and cost positions. The focus here is not time-to-market, bleeding-edge technology or best practices. It is the ambition to break one of the most commonly accepted dogmas of competition-based strategy: the value-cost trade-off.
It is conventionally believed that companies can either create greater value to customers at a higher cost, or create reasonable value at a lower cost. Here, strategy is seen as making a choice between differentiation and cost. In contrast, to create blue oceans, we need to pursue differentiation and low cost simultaneously, by looking within and beyond our industry boundaries and redefining a market altogether.
To discover more Strategy frameworks, download our compilation of Strategy & Transformation templates here. This document covers 35+ Strategy & Transformation frameworks, from McKinsey 7-S to the BCG Experience Curve to the Greiner Growth Model.
SWOT ANALYSIS
The SWOT Analysis (also called SWOT Matrix) is one of the earliest strategy frameworks. It was developed in the 1960s at Harvard Business School by Learned, Christensen, Andrews, and Guth.
The name is an acronym for Strengths, Weaknesses, Opportunities, and Threats. This framework provides basic directions for structuring strategic analysis. The underlying theory is that assessment of competitive position should combine both an external and an internal analysis. The internal factors are Weaknesses and Strengths, whereas the external factors are Opportunities and Threats.
We can conduct SWOT analyses for our own organization in addition to our competitors, so that we gain added insight into our company’s competitive position. The output of this analysis is often displayed in the form of a 2×2 matrix. SWOT Analysis is often conducted in conjunction with PEST Analysis (see below).
PEST ANALYSIS
PEST Analysis is a framework evaluating macro-environmental factors used in the environmental scanning component of strategic management. The PEST analysis framework has become increasingly popular and relevant as the first decade of the 21st century have given rise to green business and environmental concerns from the public. PEST is an acronym for Political, Economic, Social, and Technological, which are the macro-environmental factors to analysis in this analysis.
This analysis is often performed in conjunction with other popular frameworks, as a means of enhancing the understanding and output of these other frameworks. Specifically, it is often used to help explain the analysis in the following frameworks: Porter’s Five Forces; SWOT Analysis; Value Chain Analysis; and Industry financials.
PEST Analysis is often performed in a 3-phase process: data collection, industry trend analysis, and trend quantification.
MARKETING MIX
The 4 P’s of marketing, often just called Marketing Mix, is perhaps the commonly used corporate marketing framework. The marketing mix refers to the 4 levers to adjust when determining the essence of product’s marketing strategy. The 4 P’s refer to Price, Product, Promotion, and Placement.
This framework has been extended to 7 P’s, to also include Physical Evidence, People, and Process. The definitions for the additional 3 P’s should not be confused with the People-Process-Technology framework, which is more operationally-focused (vs. consumer-focused).
PRODUCT LIFECYCLE & CONSUMER ADOPTION CURVE
Product Lifecycle analysis is a tool to predict how sales will develop based on the age of the product category. Marketers and strategists can use this analysis to predict sales growth, associated customer and competitor behaviors, and, in turn, devise the appropriate product marketing strategy. The Product Lifecycle itself it divided into 4 stages of development: Introduction, Growth, Maturity (and Saturation), and Decline (and Termination). The length of each period varies tremendously. Some products have very short cycles, whereas others can take decades or even centuries to go through the cycle.
The lifecycle can be mapped against the Consumer Adoption Curve, where the peak of the curve generally occurs in the maturity stage of the Product Lifecycle. In fact, the Product Lifecycle is typically mapped against the Consumer Adoption Curve to draw out key marketing and competitive insights. By understanding what stage of the Consumer Adoption Curve we’re at, we can gain invaluable insights into the who our target customer are, as well as their defining attributes.
The Consumer Adoption Curve is defined by 5 sequential stages: Innovators, Early Adopters, Early Majority, Late Majority, and Laggards. Typically, there is a “chasm” between the Early Adopters and Early Majority. Product Lifecycle Analysis also provides a framework to understand the competitive environment. It makes an underlying assumption that sales and profitability follow a predictable pattern for all industries and all products within those industries.
BALANCED SCORECARD
The Balanced Scorecard (BSC) is a strategic Performance Management tool. It is a semi-standard structured report, supported by proven design methods and automation tools, that can be used by managers to keep track of the execution of activities by the staff within their control and to monitor the consequences arising from these actions. It was developed by Robert Kaplan and David Norton.
The BSC approach is called “balanced,” because it supplements traditional financial measures with 3 key non-financial areas:
A company’s relationship with its customers;
Its key internal business processes; and
Its learning and growth.
This approach enables companies to track financial results, while simultaneously monitoring progress in building the capabilities and acquiring the intangible assets they need for future growth.
BSC also provides a framework for company’s to translate their strategy into measurable and actionable KPIs and objectives. Specifically, it ties 4 key management processes (Translating the Vision, Communicating and Linking, Business Planning, and Feedback and Learning) into both short-term and long-term strategic objectives.
ORGANIZATIONAL HURDLES
In Blue Ocean Strategy, the authors identify 4 main Organizational Hurdles that the organization must overcome for successful business execution. These hurdles arise when a company develops a new strategy to departs from the status quo. These hurdles are the Cognitive Hurdle, Resource Hurdle, Motivational Hurdle, and Political Hurdle.
Although all companies face different degrees of these hurdles, many may only face a subset of the 4 hurdles. To overcome these hurdles effectively, organizations must abandon perceived wisdom on effecting organizational change.
HOSHIN KANRI
Hoshin Kanri (also known as Policy Deployment, Hoshin Planning, or just Hoshin) is a Strategic Planning Methodology. It is based on a concept popularized in Japan in the late 1950s by Yoji Akao.
“Each person is the expert in his or her own job, and Japanese TQC (Total Quality Control) is designed to use the collective thinking power of all employees to make their organization the best in its field,” Yoji Akao. This is the fundamental principle of Hoshin Kanri. In other words, this framework ensures that the strategic goals of our company drive progress and action at every level within the organization. This eliminates the waste that comes from inconsistent direction and poor communication.
This framework is intended to help an organization:
Focus on a shared goal;
Communicate that goal to all leaders;
Involve all leaders in planning to achieve the goal; and
Hold participants accountable for achieving their part of the plan.
Hoshin Kanri falls under the umbrella of Lean Management (or called Lean Thinking, Lean Methodologies). Lean frameworks strive for Continuous Improvement of the organization.
Above, we highlighted 12 established frameworks around Strategy Development and Execution. In the world of strategy frameworks, this is just the tip of the iceberg. There are literally 100s of strategy frameworks developed by strategists, academics, and consulting firms. Many of these methodologies are included our Strategy Development Frameworks offering here.
Since so many tools are at your disposable, it can be difficult to determine what the right approach is for our organization. There are many important considerations when deciding on the best framework or set of frameworks to utilize, such as leadership style, business maturity (e.g. small business vs. large enterprise), industry maturity, organizational structure (e.g. decentralized vs. centralized decision making), corporate culture, and so forth.
To help navigate through the available strategy frameworks, let’s take a look at the Strategy Framework Canvas (SFC). The SFC is a unifying choice framework that guides us in selecting the appropriate strategy for the circumstances at hand and execute it effectively. This model is particularly useful for large organizations that are now stretched across a more diverse and faster-changing range of business situations.
Classic
Adaptive
Visionary
Leader
Renewal
Classic Strategy
The Classic approach is the most common approach. In this situation, the market is predictable, basis of competition is stable, and strategy is sustainable.
Classic strategy is achieved through sustainable Competitive Advantage by positioning our organization optimally in an attractive market. Since the basis of Competitive Advantage within these environments is known and non-malleable, advantage can be based on superior scale, differentiation (or, equivalently, scale within a narrower market segment), or superior capabilities.
The most well-known strategy frameworks are the Classics, such as the ones already discussed in the earlier portion of this article:
We use the Adaptive approach when the environment is neither predictable nor malleable. There is continuous disruption in the market.
Unlike the Classic approach of sustainable Competitive Advantage, the foundation to the Adaptive approach to strategy is the notion of serial temporary advantage. Within unpredictable and non-malleable environments, the emphasis is on continuous experimentation and real-time adjustment—as opposed to long-term analysis and planning. Because advantage is temporary, we focus on means and not ends.
Examples of Adaptive frameworks include:
Time-based Competition
Temporary Advantage
Adaptive Advantage
Visionary Strategy
We take the Visionary approach when we can reliably create or re-create an environment by some degree of predictability by seeing an opportunity and pursuing it single-mindedly.
Visionary approaches are most frequently associated with entrepreneurial start-ups. However, large organizations increasingly need to adopt this approach for themselves, as well.
The Leader Approach is used when the environment is unpredictable, but malleable. We can shape or re-shape the whole industry.
A Leader approach both permits and requires an organization to collaborate with others in a diverse ecosystem that distributes risk, supplies complementary capabilities and resources, and builds the market quickly through strength in numbers.
Examples of Leader frameworks include:
Networks
Ecosystems
Platforms
Renewal Strategy
Lastly, the Renewal strategy approach is used when the environment is harsh. This type of strategy aims to restore the vitality and competitiveness of the organization.
In such a harsh environment, the existing circumstances prevent the current way of doing business from being sustainable. The first step is to change course to preserve and free up resources.
[NOTE: Our Hoshin Kanri presentation has been trusted by an array of prestigious organizations, including industry leaders such as Apple, Facebook, Boeing, Shell, Goodyear, Cummins, Johnson Controls, Hanes, Telefónica, Chubb, Discover, Stryker, Thales, Saint-Gobain, AGCO, to name just a [read more]
Do You Want to Implement Business Best Practices?
You can download in-depth presentations on Strategy Development and 100s of management topics from the FlevyPro Library. FlevyPro is trusted and utilized by 1000s of management consultants and corporate executives.
For even more best practices available on Flevy, have a look at our top 100 lists:
These best practices are of the same as those leveraged by top-tier management consulting firms, like McKinsey, BCG, Bain, and Accenture. Improve the growth and efficiency of your organization by utilizing these best practice frameworks, templates, and tools. Most were developed by seasoned executives and consultants with over 20+ years of experience.
Readers of This Article Are Interested in These Resources
A strategic plan is a document that outlines an organization's long-term goals, strategic analyses, and the resultant strategies and initiatives it will deploy to achieve its goals.
A strategic plan is essential, because it provides a clear roadmap for the future, helping organizations to focus [read more]
Strategic Planning is an essential tool for organizations aiming to thrive in today's dynamic business environment. It's not just about setting goals--it's also about crafting a roadmap for sustainable success. For executives, understanding and effectively implementing Strategic Planning is crucial [read more]
Most frameworks, guides, and business gurus that discuss corporate strategy focus purely on the theory of great strategy, but don't teach the art of great execution. Without execution, strategy is merely theory.
In fact, a common complaint of strategy consulting firms is that they leave clients [read more]
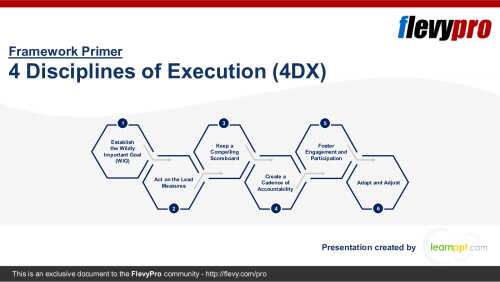
Many organizations are proficient at planning, but fall short when it comes to executing those plans, especially when emergencies take precedence over routine tasks.
The 4 Disciplines of Execution (4DX) is a Strategy Development framework designed to help organizations effectively implement [read more]