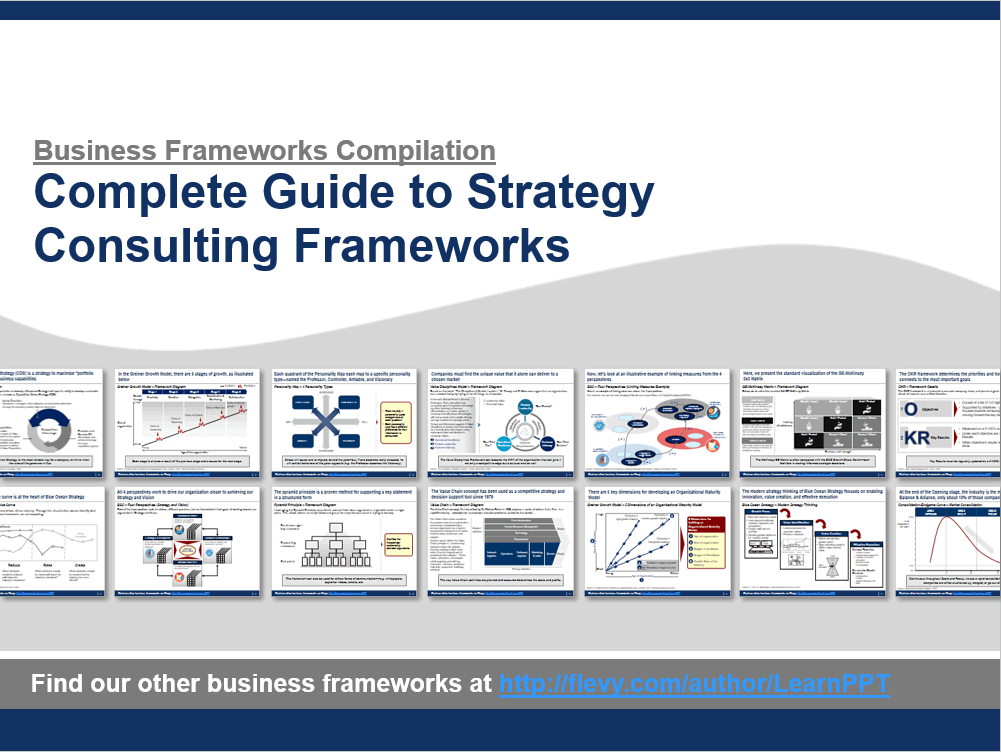

Complete Guide to Strategy Consulting Frameworks – PowerPoint PPTX Template
PowerPoint (PPTX) 144 Slides
BENEFITS OF THIS DOWNLOADABLE POWERPOINT DOCUMENT
- Familiarize yourself with 20 Strategy Consulting frameworks, ranging from ones pioneered by renown strategists (e.g. Michael Porter, Bruce Henderson, Peter Drucker) to global strategy consulting firms (e.g. McKinsey, BCG, Booz).
- Learn how Strategy Consultants structure their approaches to Strategic Analysis, Strategic Thinking, Project Design, Problem Solving, and Communication.
- Understand how different frameworks are applied to different types of Strategy, from Competitive Analysis to Portfolio Management to Cost Reduction.
STRATEGY DEVELOPMENT PPT TEMPLATE DESCRIPTION
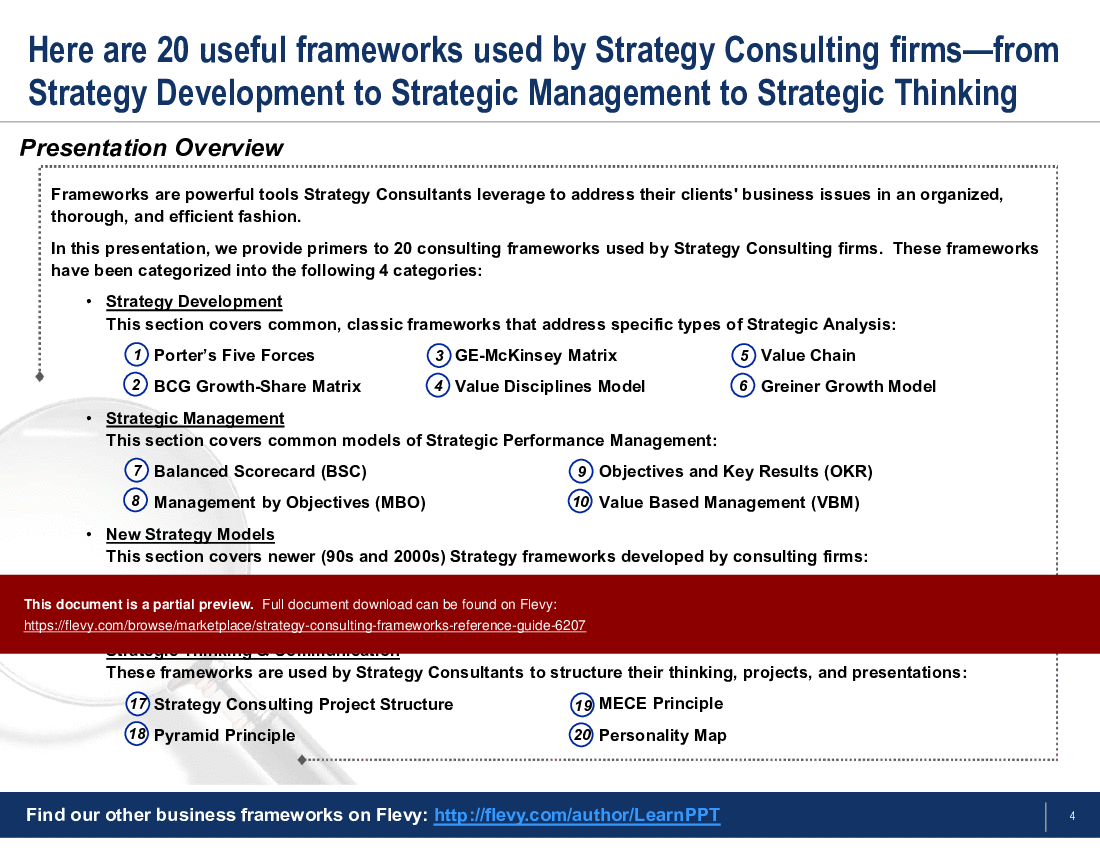
Frameworks are powerful tools Strategy Consultants leverage to address their clients' business issues in an organized, thorough, and efficient fashion.
In this presentation, we provide primers to 20 consulting frameworks used by Strategy Consulting firms. These frameworks have been categorized into the following 4 categories:
1. Strategy Development – This section covers common, classic frameworks that address specific types of Strategic Analysis.
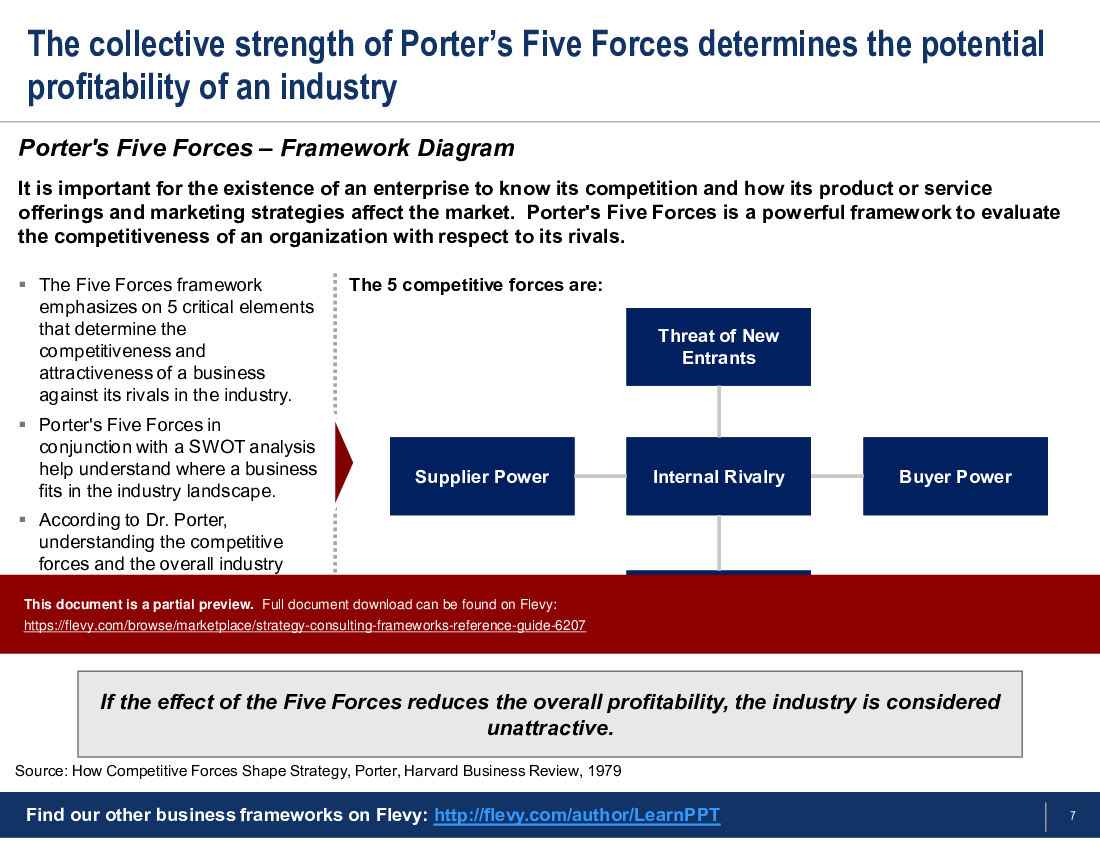
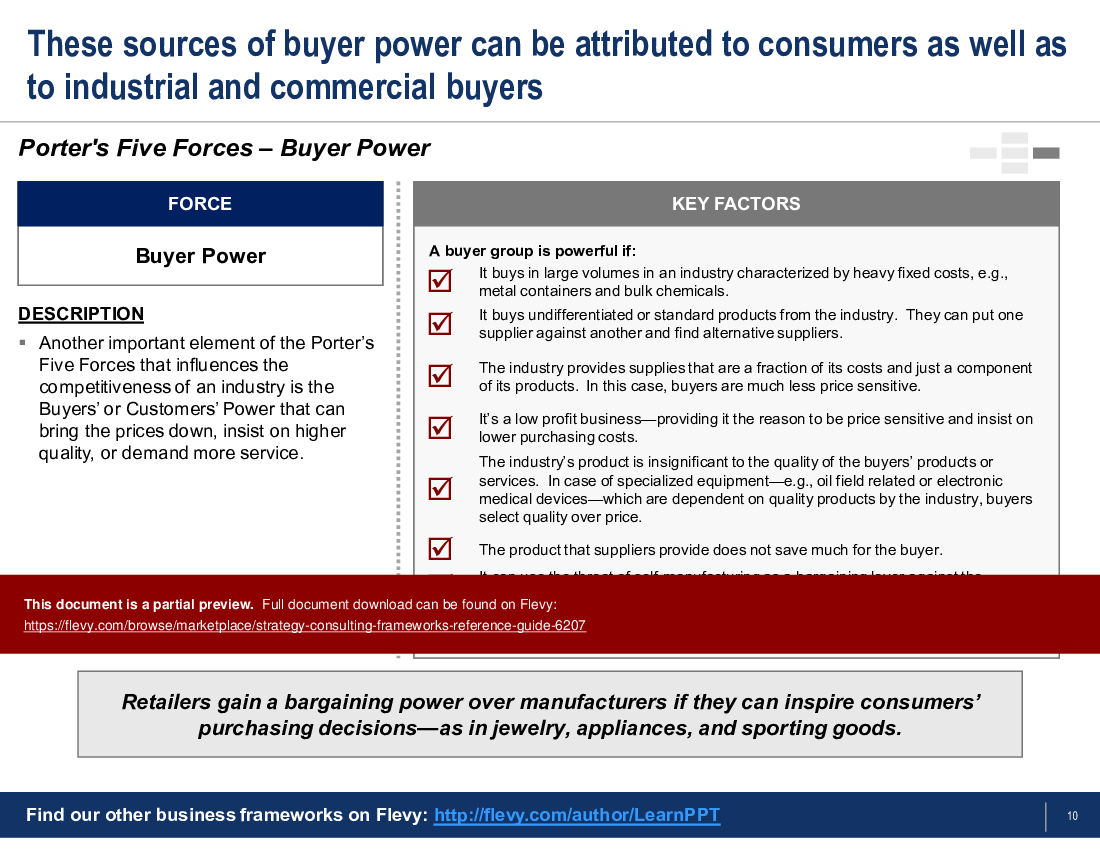
• Porter's Five Forces
• BCG Growth-Share Matrix
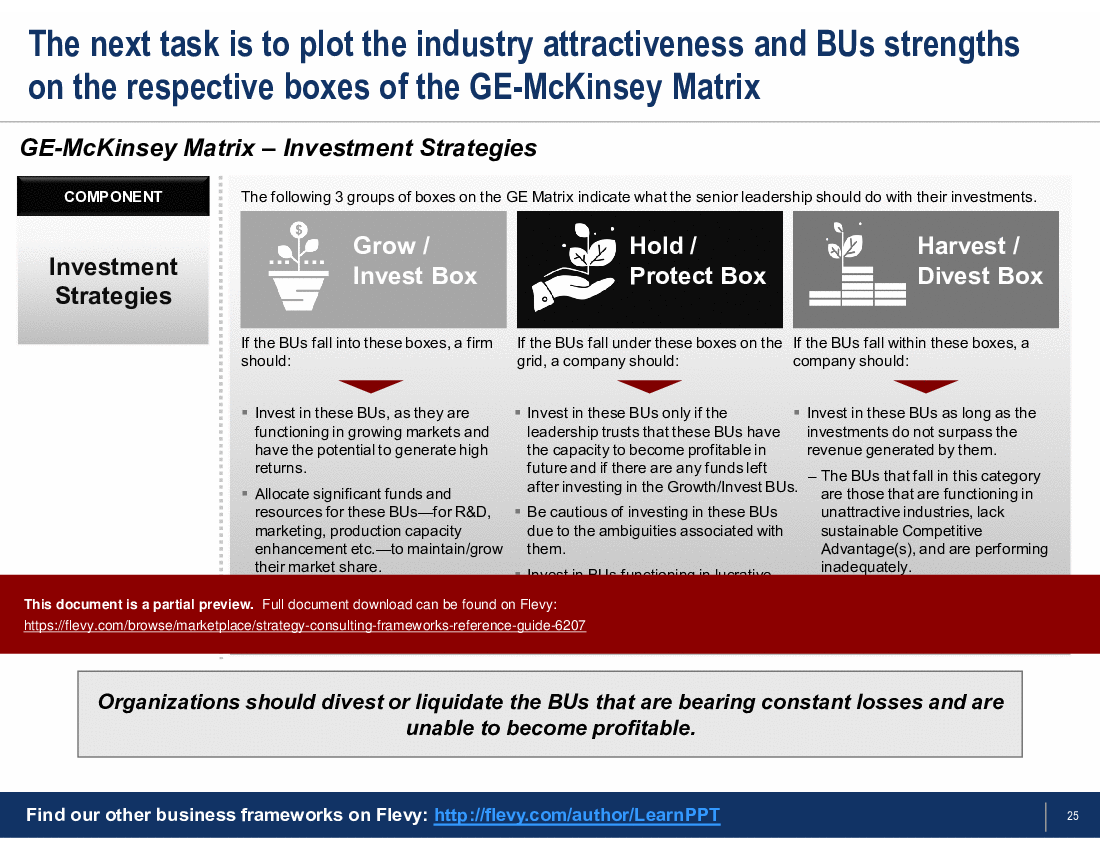
• GE-McKinsey Matrix
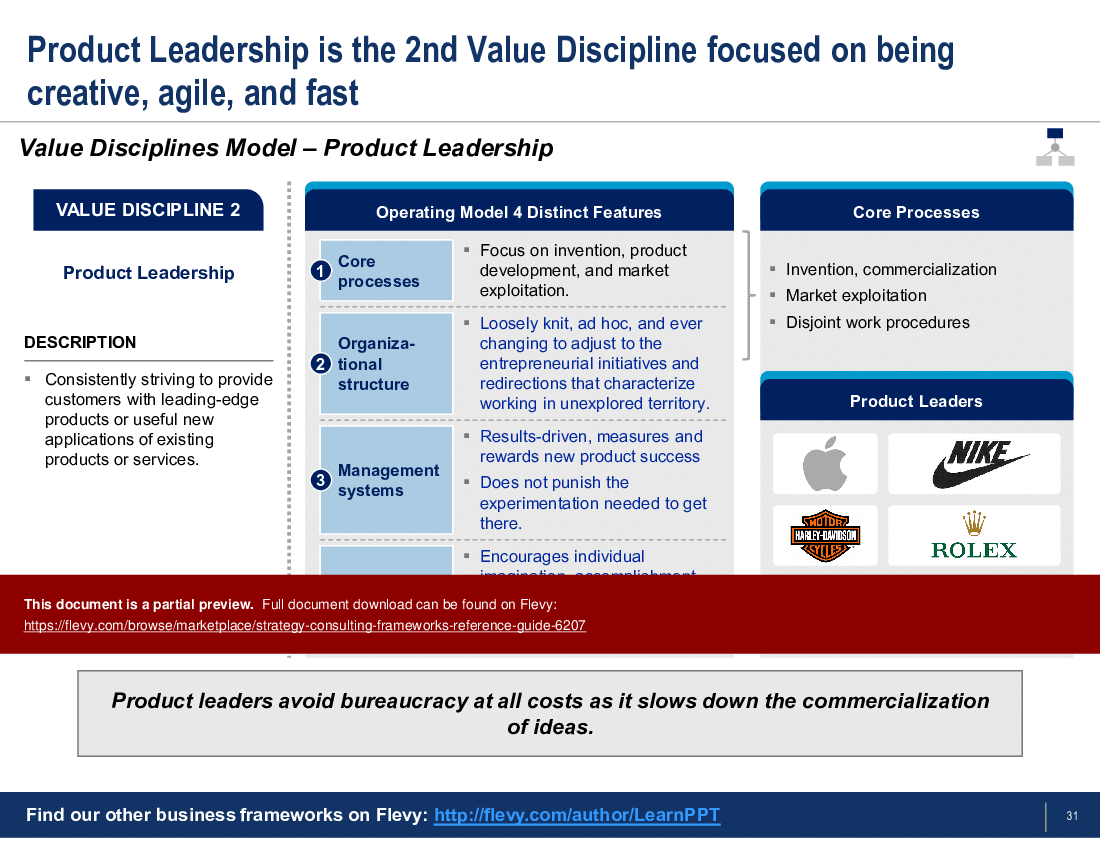
• Value Disciplines Model
• Value Chain
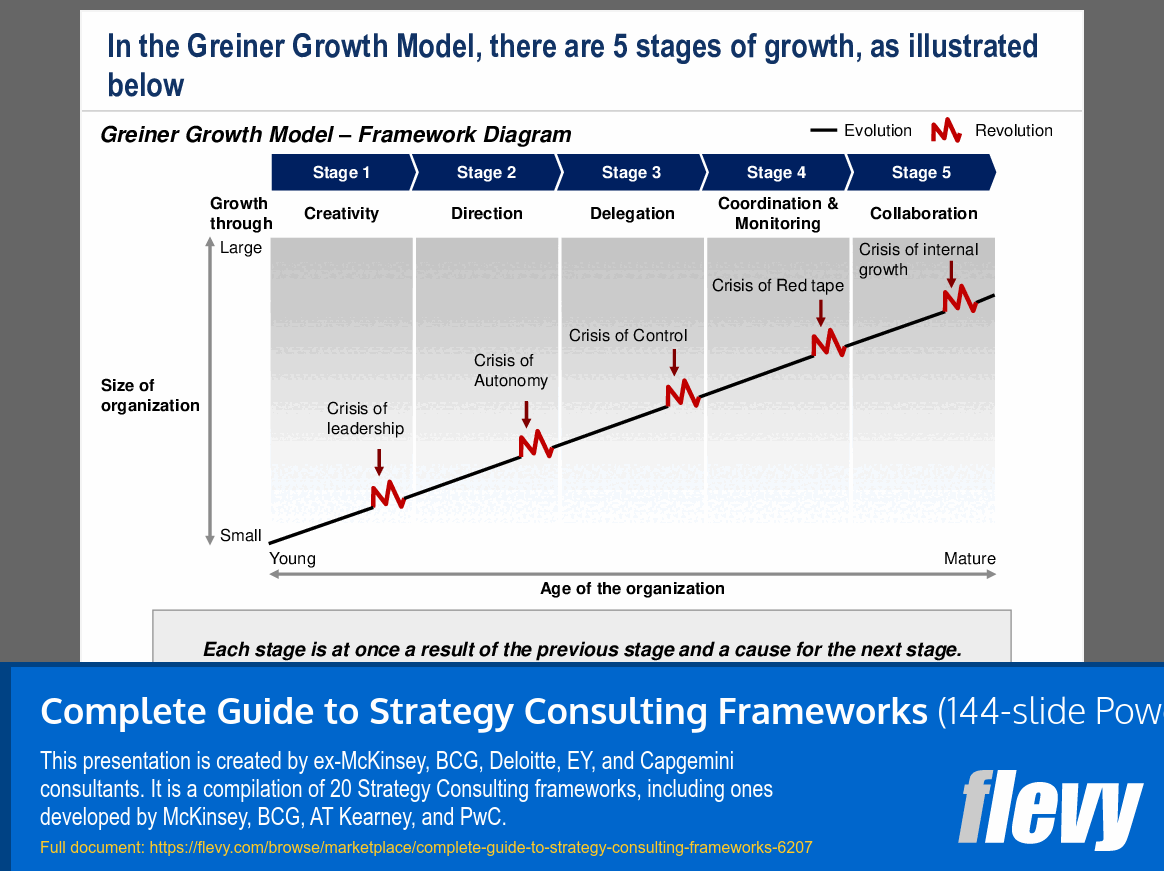
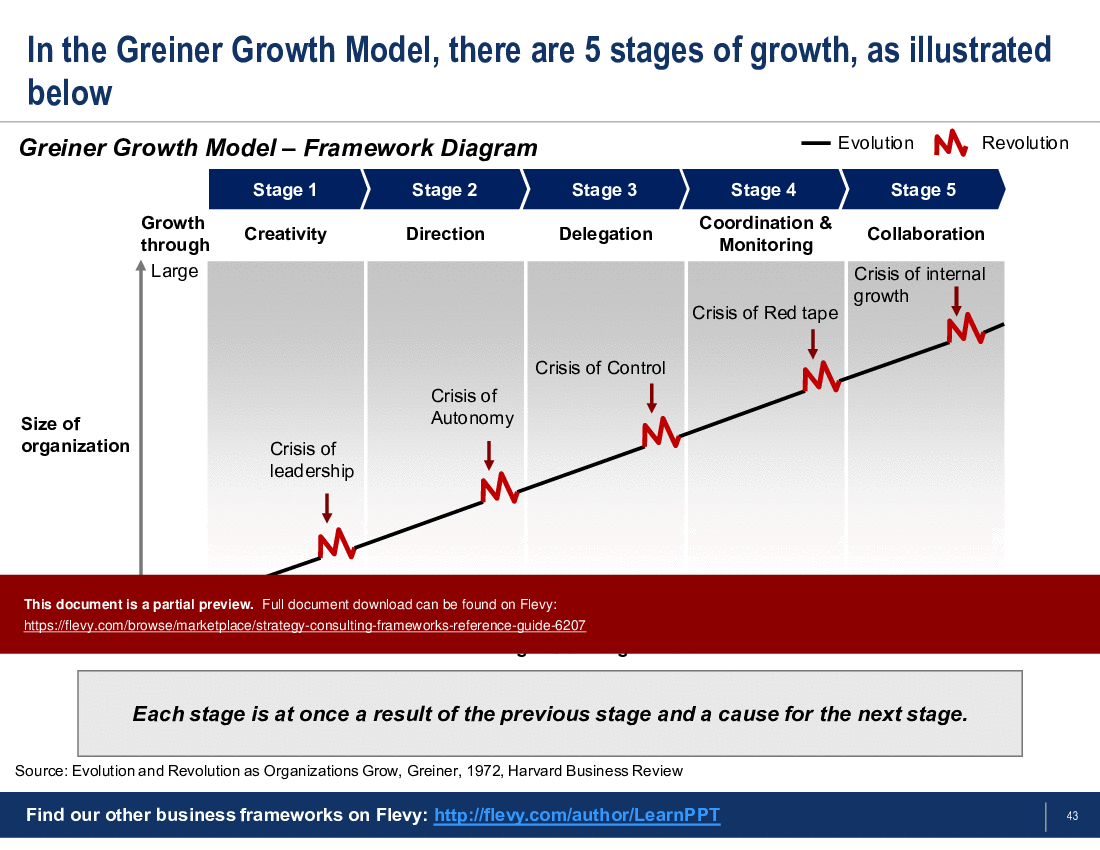
• Greiner Growth Model
2. Strategic Management – This section covers common models of Strategic Performance Management.
• Balanced Scorecard (BSC)
• Management by Objectives (MBO)
• Objectives and Key Results (OKR)
• Value Based Management (VBM)
3. New Strategy Models – This section covers newer Strategy frameworks developed by consulting firms during the 90s and 2000s.
• Digital Transformation Strategy
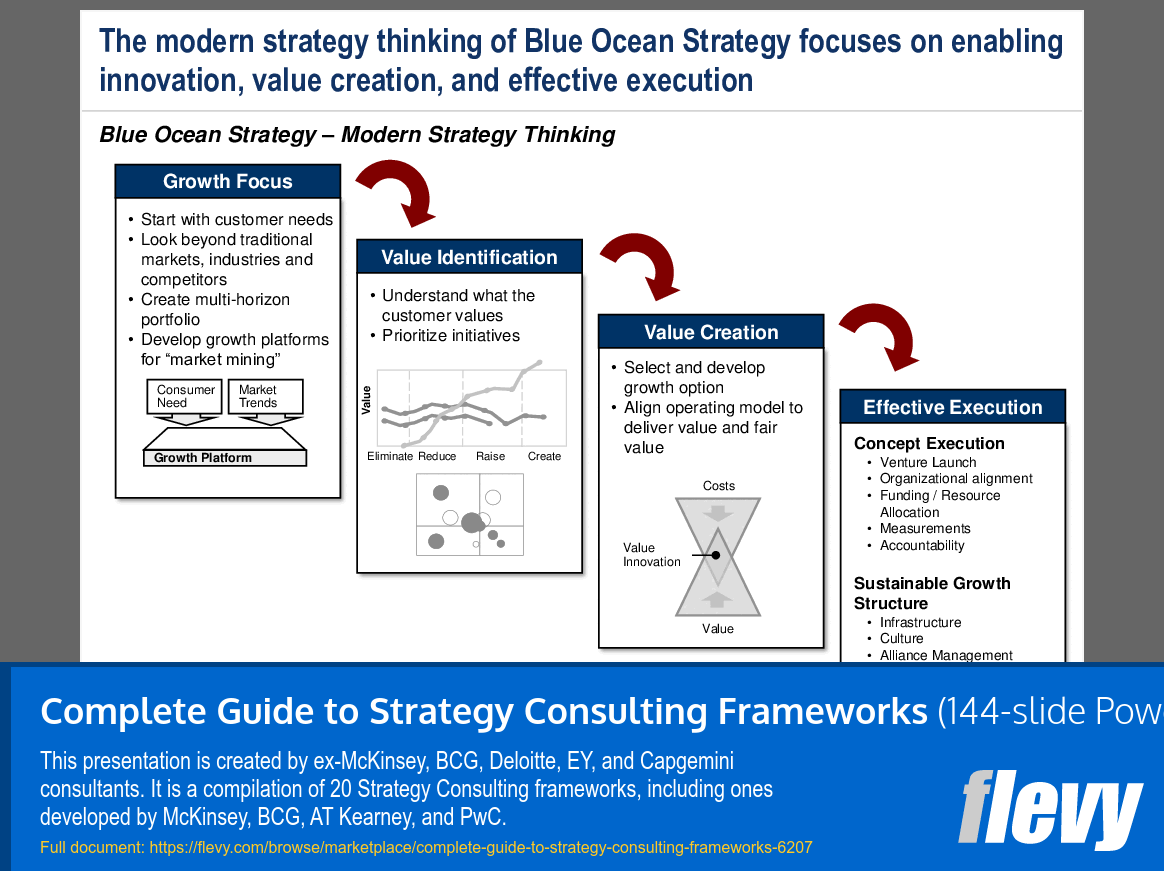
• Blue Ocean Strategy
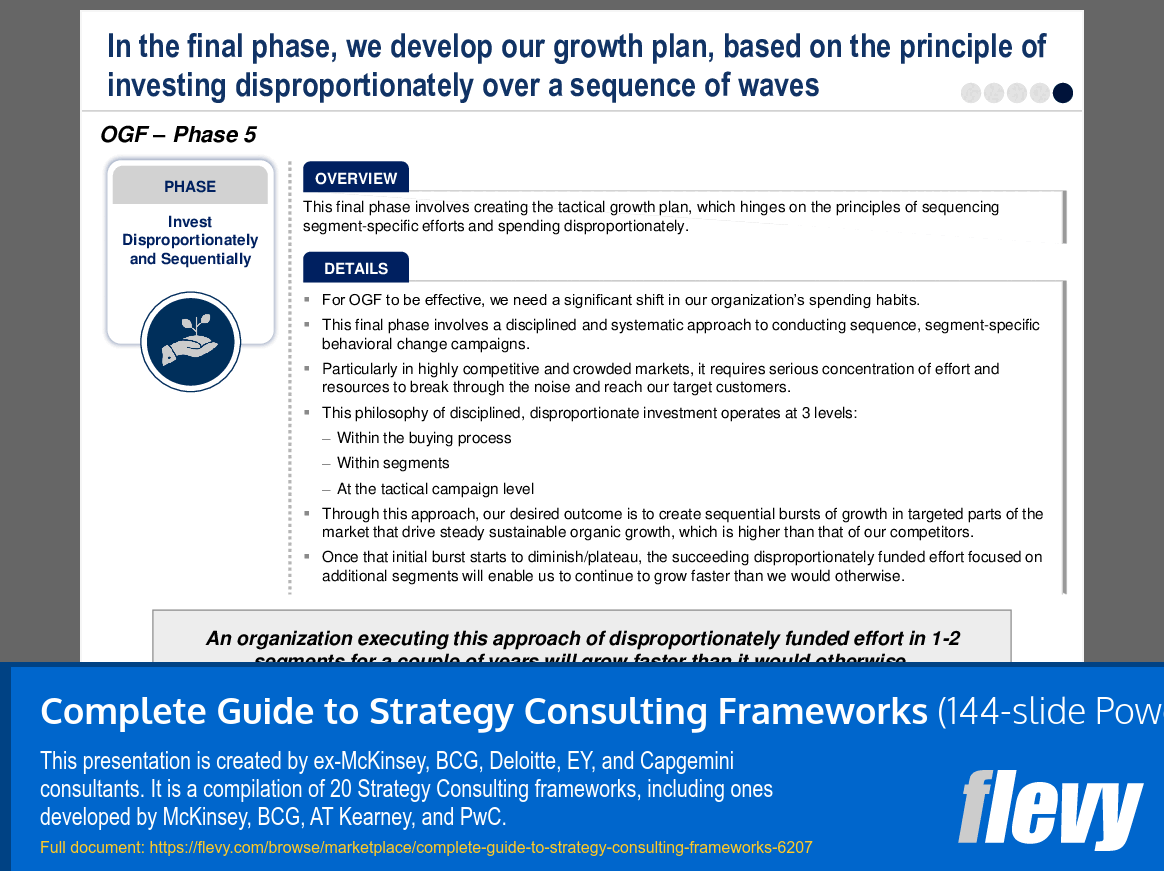
• Organic Growth Framework (OGF)
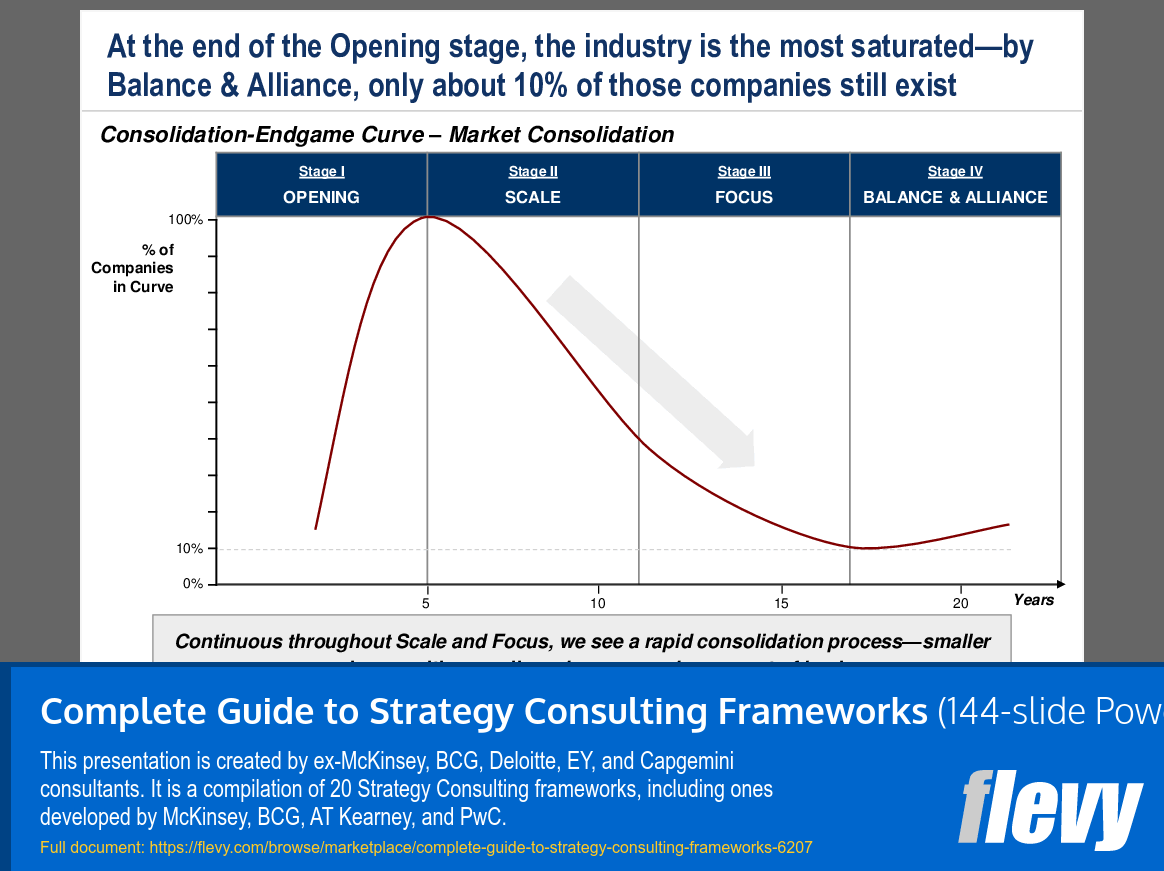
• Consolidation-Endgame Curve
• Capabilities-Driven Strategy (CDS)
• Business Model Canvas (BMC)
4. Strategic Thinking & Communication – These frameworks are used by Strategy Consultants to structure their thinking, projects, and presentations:
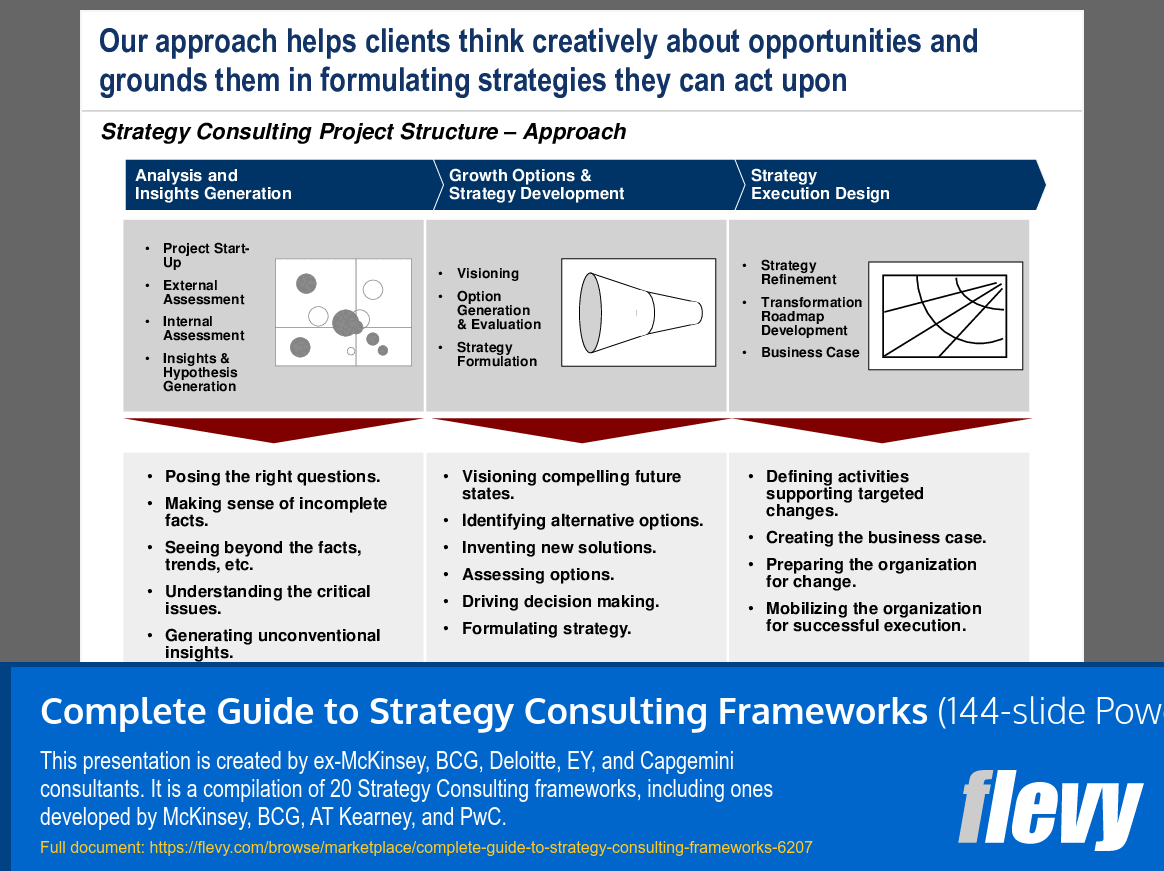
• Strategy Consulting Project Structure
• Pyramid Principle
• MECE Principle
• Personality Map
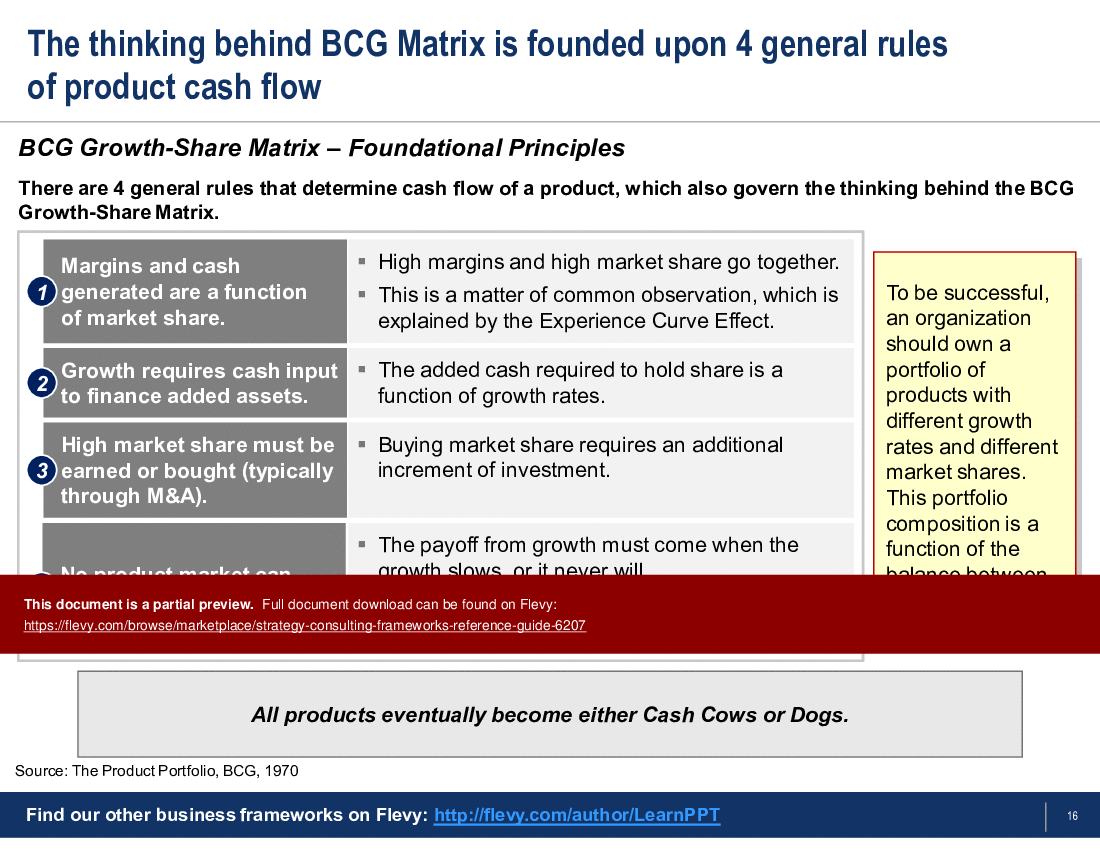
The PPT delves into the intricacies of the BCG Growth-Share Matrix, highlighting its foundational principles and the four general rules governing product cash flow. It emphasizes the importance of market share in generating margins and cash, the necessity of cash input for growth, and the critical role of high market share achieved through investment or M&A. The matrix categorizes products into Cash Cows, Stars, Question Marks, and Dogs, providing a clear framework for resource allocation and strategic decision-making.
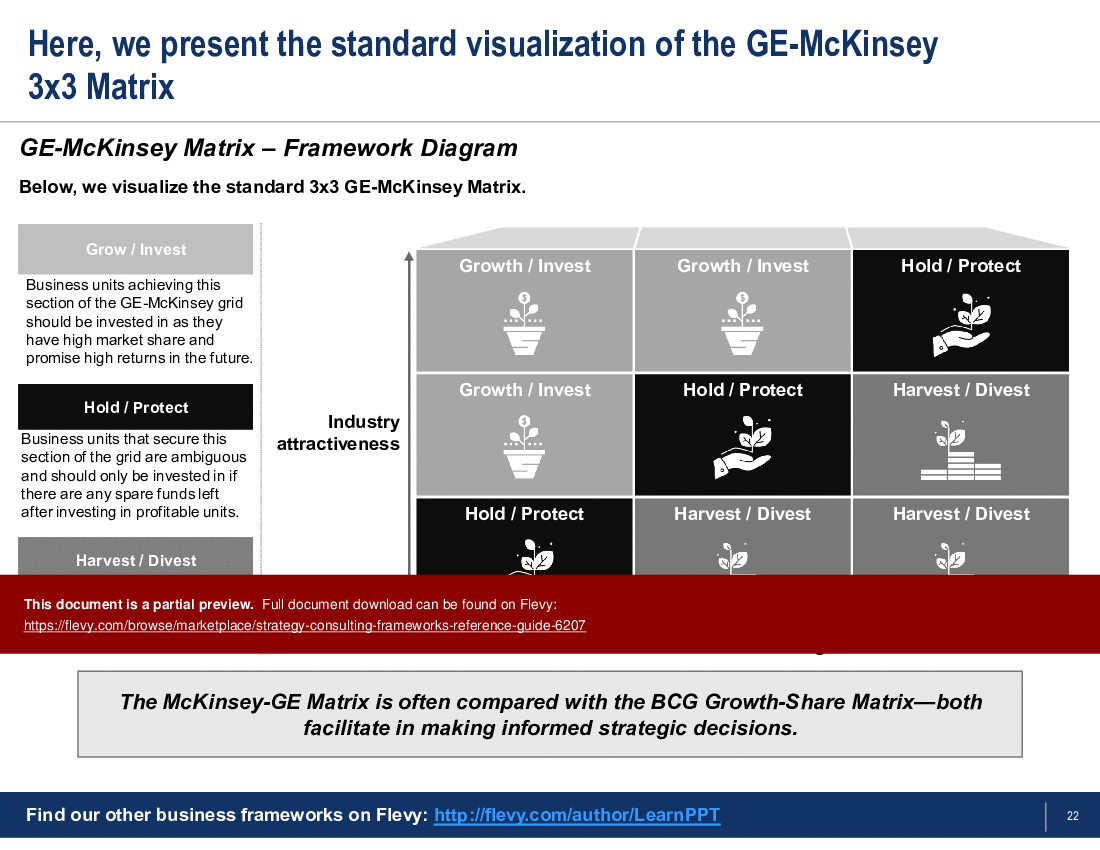
The GE-McKinsey Matrix is another key framework discussed, offering a 3x3 grid to evaluate business units based on industry attractiveness and competitive strength. This matrix guides investment strategies, suggesting actions like grow/invest, hold/protect, and harvest/divest based on the positioning of business units. The document also covers the Value Disciplines Model, which helps organizations identify their unique value proposition through Operational Excellence, Product Leadership, or Customer Intimacy. This model aids in aligning organizational strategies with market demands, ensuring a competitive edge.
Got a question about the product? Email us at support@flevy.com or ask the author directly by using the "Ask the Author a Question" form. If you cannot view the preview above this document description, go here to view the large preview instead.
PRESENTATION DEEP DIVE ANALYSIS
This deep-dive analysis was generated from the full 144-slide PowerPoint presentation.
STRATEGY DEVELOPMENT PPT TEMPLATES
Source: Best Practices in Strategy Development, Strategy Frameworks, Consulting Training, Bain PowerPoint PowerPoint Slides: Complete Guide to Strategy Consulting Frameworks PowerPoint (PPTX) Presentation Slide Deck, LearnPPT Consulting
ABOUT THE AUTHOR
We are a team of management consultants trained by top tier global consulting firms (including McKinsey, BCG, Deloitte, EY, Capgemini) with a collective experience of several decades. We specialize in business frameworks based on real-life consulting engagements.
We have served 100s of clients that range from Fortune 500 companies to tech startups to
... [read more]
Ask the Author a Question
You must be logged in to contact the author.
