
Weighted Average Cost of Capital Calculator - WACC Dashboard – Excel XLSX
Excel (XLSX)
VIDEO DEMO
BENEFITS OF THIS DOWNLOADABLE EXCEL DOCUMENT
- What-if analysis for WACC and NPV.
- In-depth financial simulation tool.
CASH FLOW MANAGEMENT EXCEL DESCRIPTION
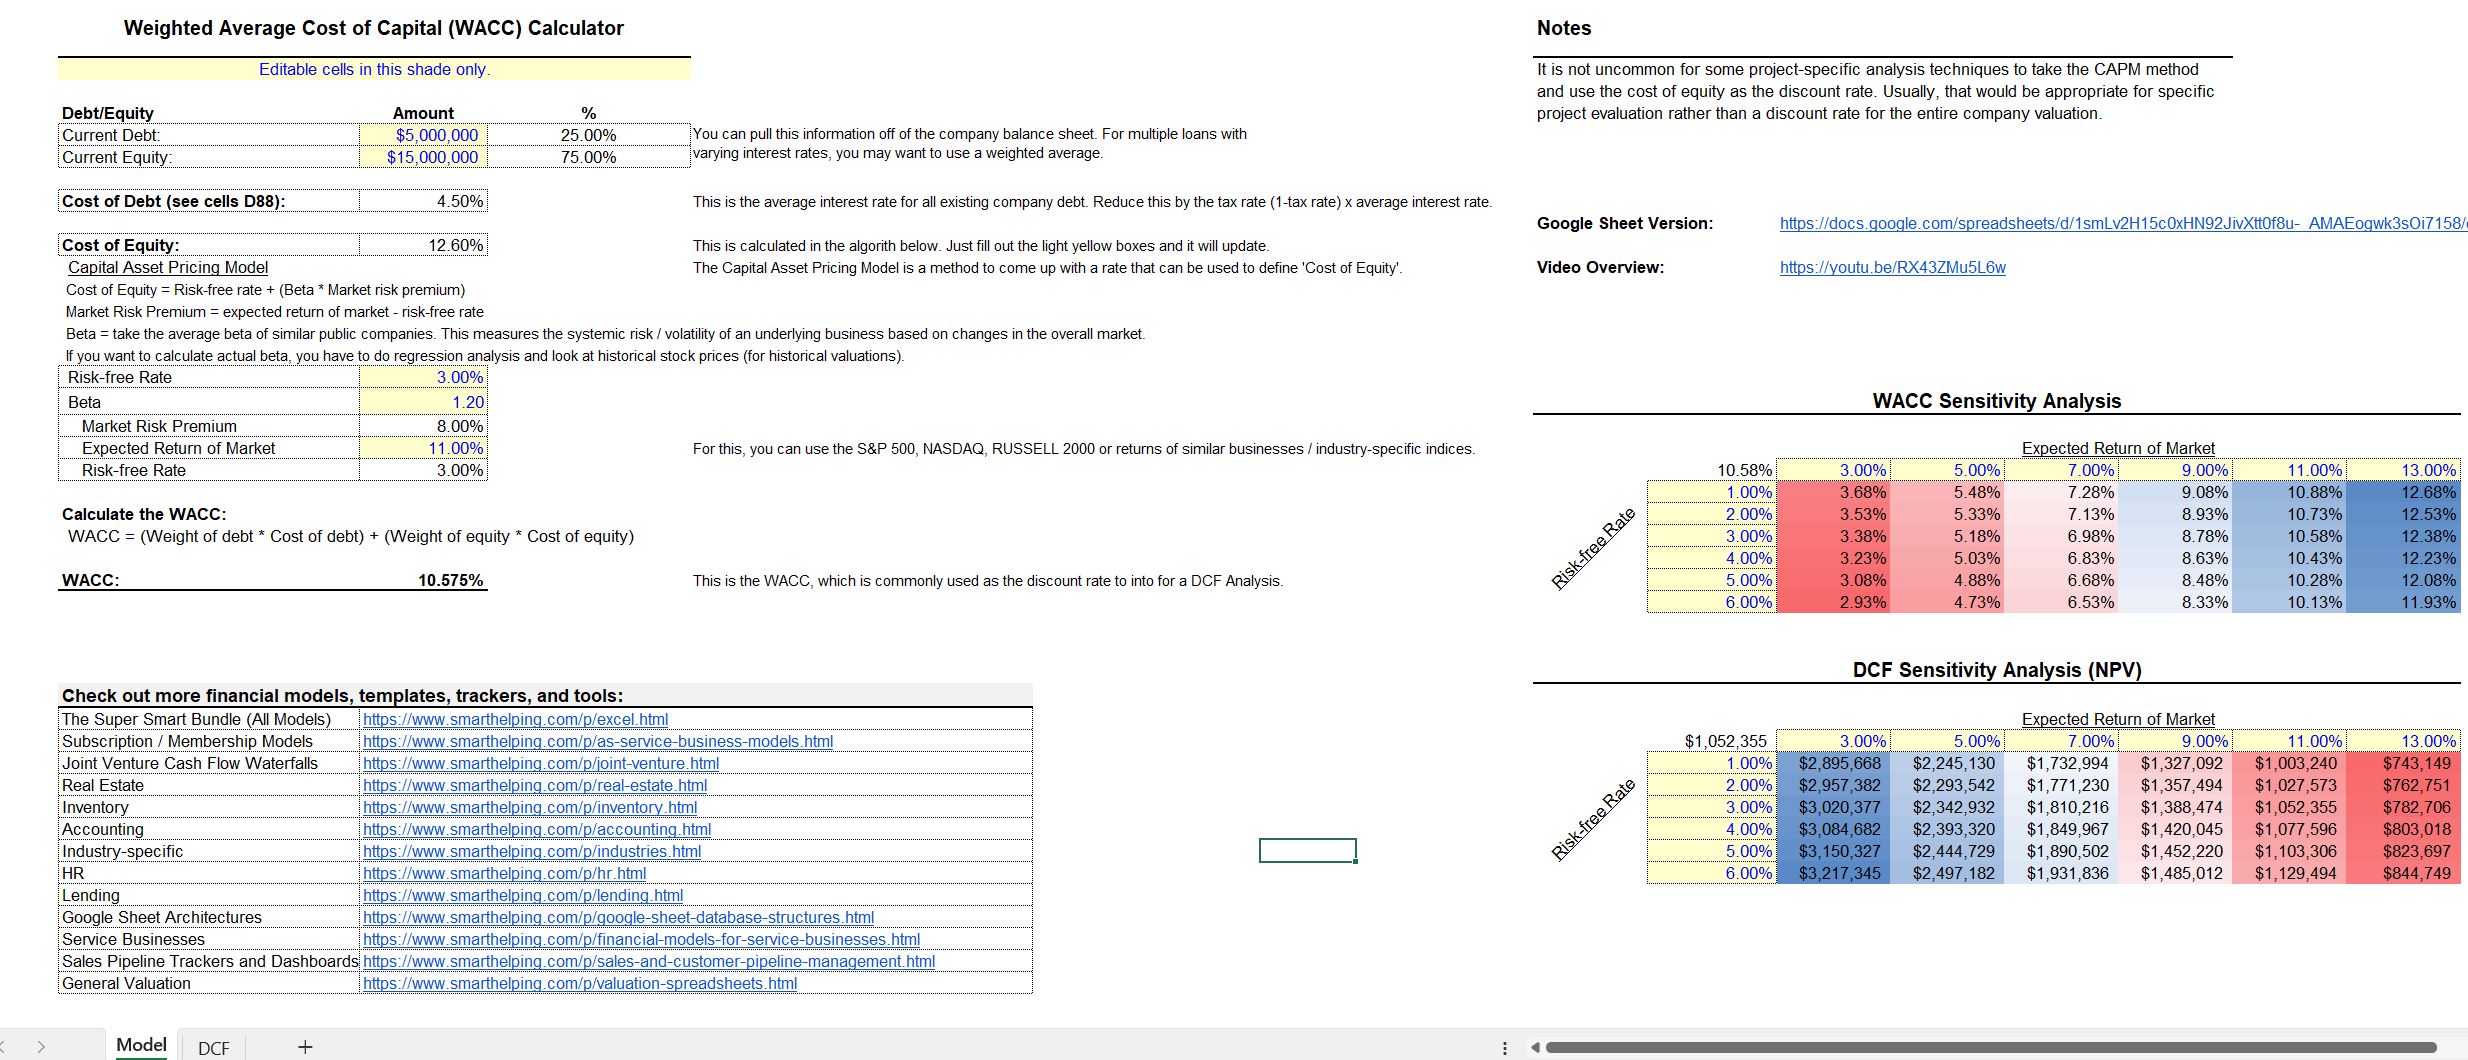
This is a simple finance calculator for one of the more widely used figures in investment analysis. It has implications for valuing any business via DCF Analysis methodology. I'm talking about the Weighted Average Cost of Capital (WACC).
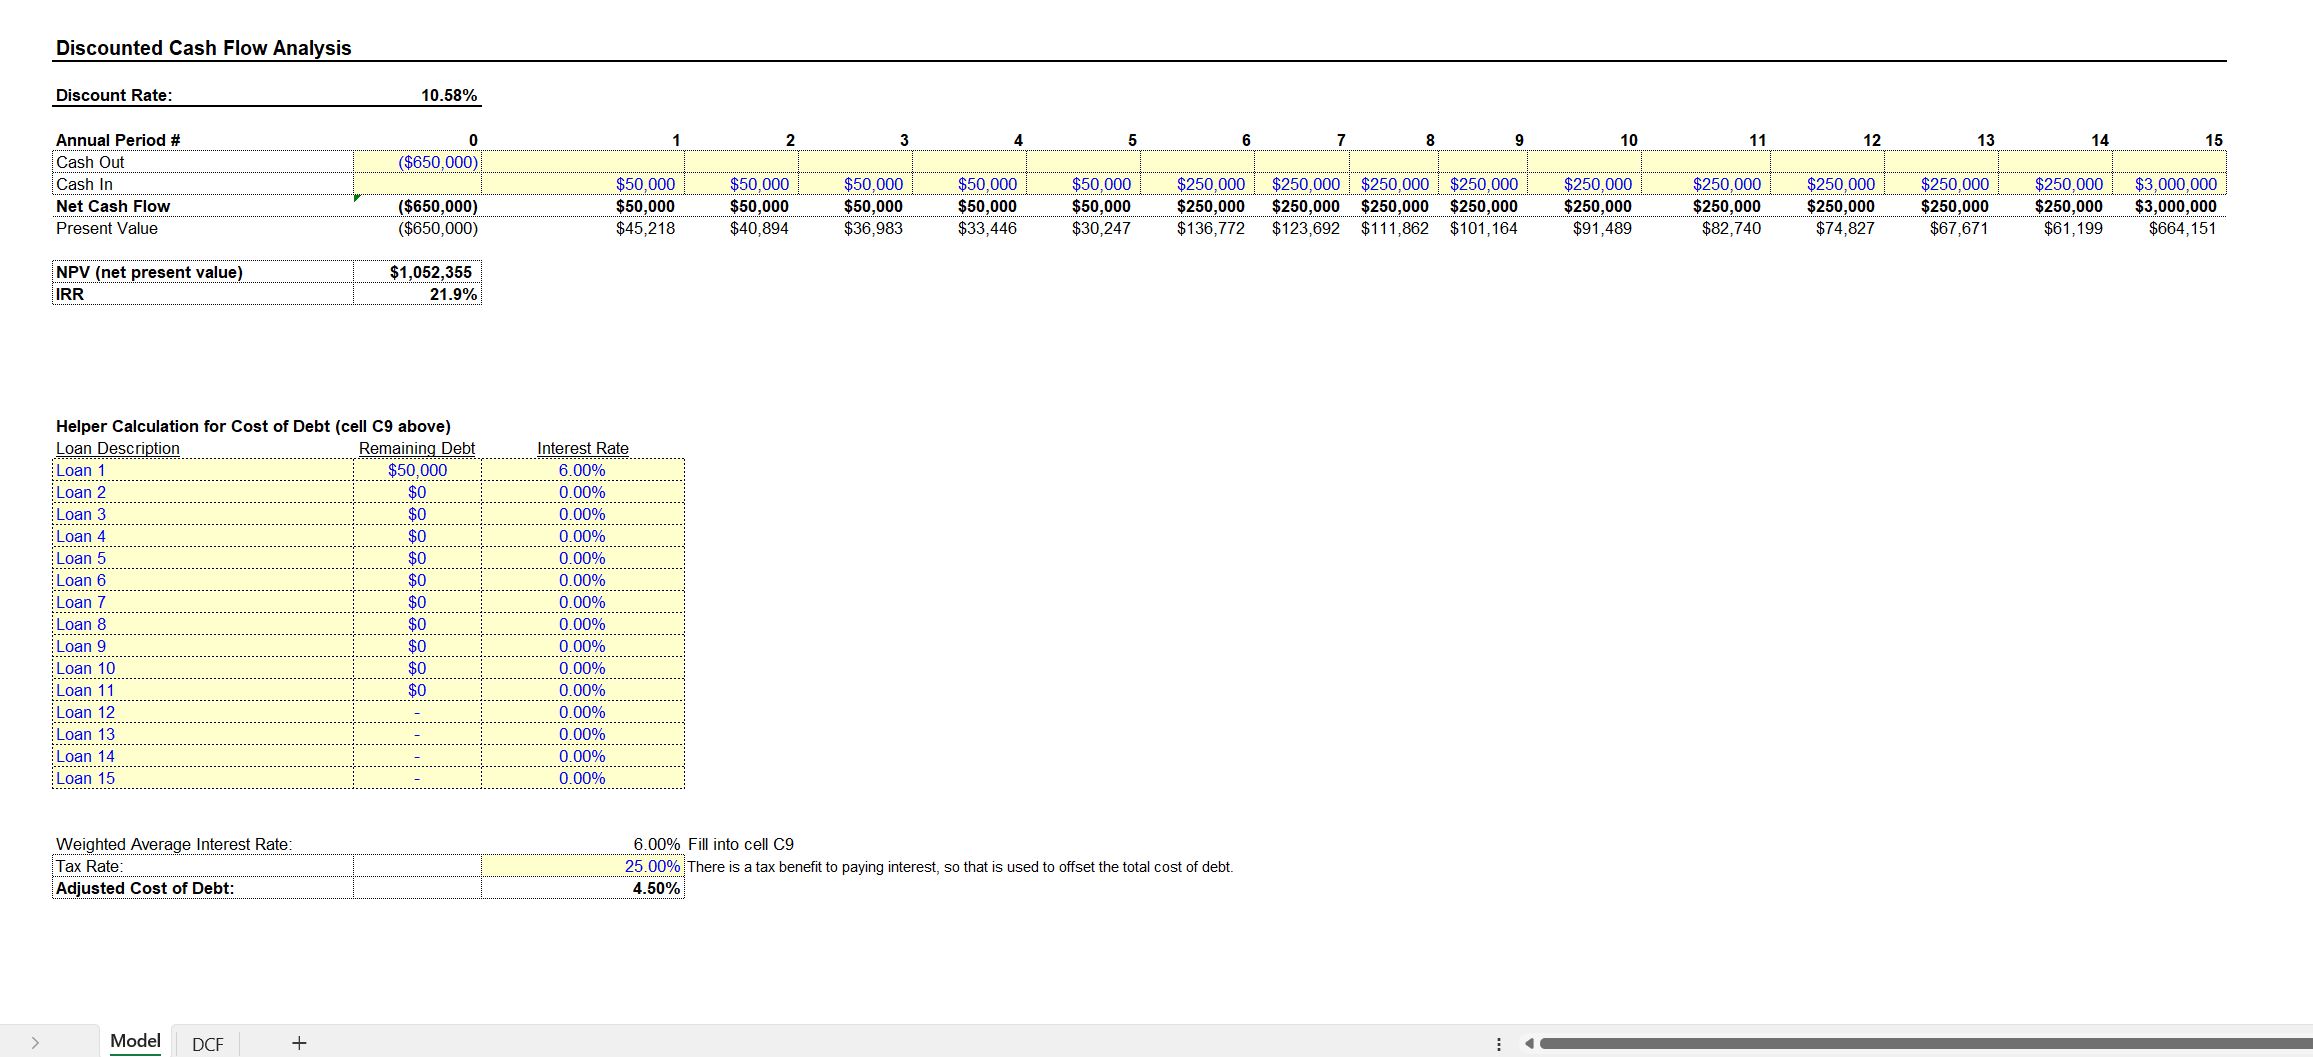
The template walks the user through every component of the WACC calculation for more precise output. I also built in two sensitivity analysis tables to the model as well as a DCF Analysis. Both update as the primary assumptions are adjusted.
Let's try and explain this investment analysis tool plainly:
Think of a company as a big machine that needs money to run smoothly. Just like you need money to buy things, a company needs money to buy things too, like buildings, equipment, and supplies.
Now, where does a company get the money from? It can come from two sources: debt and equity. Debt is when a company borrows money from banks or other lenders, and they have to pay it back with interest. Equity, on the other hand, is money invested in the company by its owners or shareholders.
The Weighted Average Cost of Capital is a way to figure out how expensive it is for a company to get money from these sources. It takes into account both the cost of borrowing money (the interest rate on debt) and the cost of giving ownership to shareholders (the return they expect on their investment).
To calculate the WACC, you need to know the proportion of debt and equity in the company's financing. Think of it like a pizza. If you cut the pizza into slices, the size of each slice represents the proportion of debt or equity. Some companies have more debt (larger debt slice), while others rely more on equity (larger equity slice).
Now, imagine each slice of the pizza has a cost. For debt, it's the interest rate the company has to pay. For equity, it's the return the shareholders expect. The WACC is like taking an average of these costs, but it's not a simple average. It's a weighted average, which means the size of each slice (the proportion of debt or equity) affects the overall result.
So why do we calculate the WACC? Well, it helps companies make important decisions. For example, if a company wants to start a new project or invest in something, they need to know if it's worth it. They compare the potential return of the project with the cost of getting the money to fund it (the WACC). If the potential return is higher than the WACC, it might be a good idea to go ahead with the project. If it's lower, they might reconsider or look for other options.
Note, the file comes with an instructional video and there is a Google Sheet version. If you use the G sheet version, there is no sensitivity tables (not native to that software, requires add-ons) but the primary calculator works as well as the DCF Analysis.
Got a question about the product? Email us at support@flevy.com or ask the author directly by using the "Ask the Author a Question" form. If you cannot view the preview above this document description, go here to view the large preview instead.
Source: Best Practices in Cash Flow Management Excel: Weighted Average Cost of Capital Calculator - WACC Excel (XLSX) Spreadsheet, Jason Varner | SmartHelping
ABOUT THE AUTHOR
I graduated in 2011 with a Bachelor's degree in Accounting and began my career as a financial analyst at a small chain of auto repair shops. After gaining valuable experience, I launched my own practice specializing in real estate underwriting, later expanding into general business modeling.
I honed my spreadsheet modeling expertise by completing over 400 projects on Upwork with a 100% success
... [read more]
Ask the Author a Question
You must be logged in to contact the author.
