Want FREE Templates on Strategy & Transformation? Download our FREE compilation of 50+ slides. This is an exclusive promotion being run on LinkedIn.

DCF Analysis (Monthly Periods)   Excel template (XLSX)
$45.00

DCF Analysis (Monthly Periods) (Excel template (XLSX)) Preview Image DCF Analysis (Monthly Periods) (Excel template (XLSX)) Preview Image DCF Analysis (Monthly Periods) (Excel template (XLSX)) Preview Image DCF Analysis (Monthly Periods) (Excel template (XLSX)) Preview Image
Arrow   Unlock all preview images:   Login Register

DCF Analysis (Monthly Periods) (Excel XLSX)

File Type: Excel template (XLSX)

$45.00
This valuation model was crafted by a Financial Modeler and Accountant with over 10+ years of global experience. He has served 750+ clients, from small family offices to billion-dollar corporations, across a multitude of industries.
Add to Cart


BUY WITH CONFIDENCE

Immediate digital download upon purchase.
Lifetime document updates included with purchase.
Fully editable & customizable XLSX document.
Trusted by over 10,000+ organizations.

DESCRIPTION

This product (DCF Analysis [Monthly Periods]) is an Excel template (XLSX), which you can download immediately upon purchase.

People hate math, and you have to do a little of it to convert your discount rates to monthly periods properly.

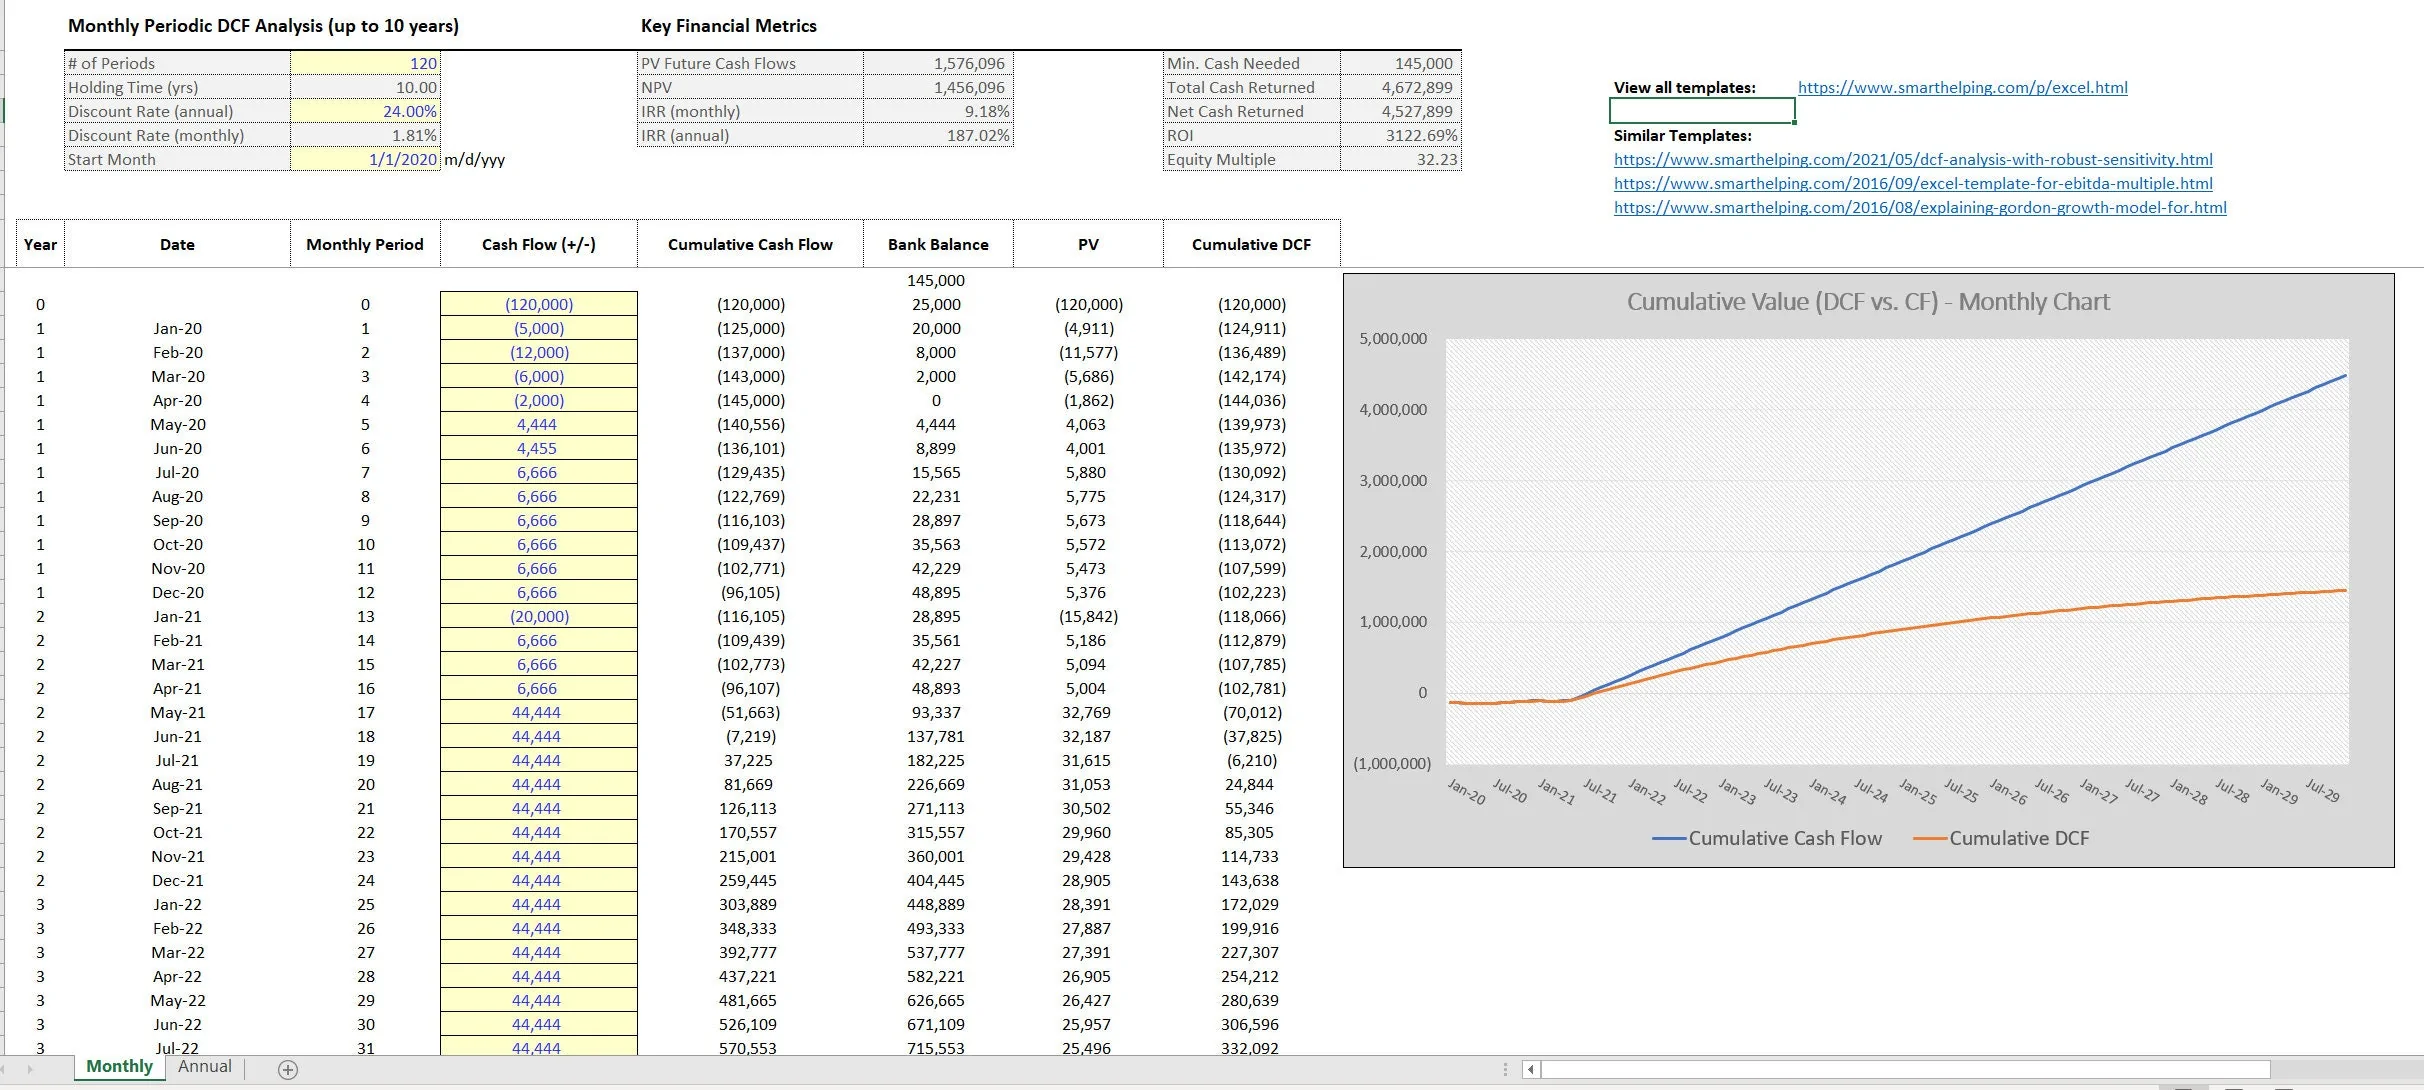
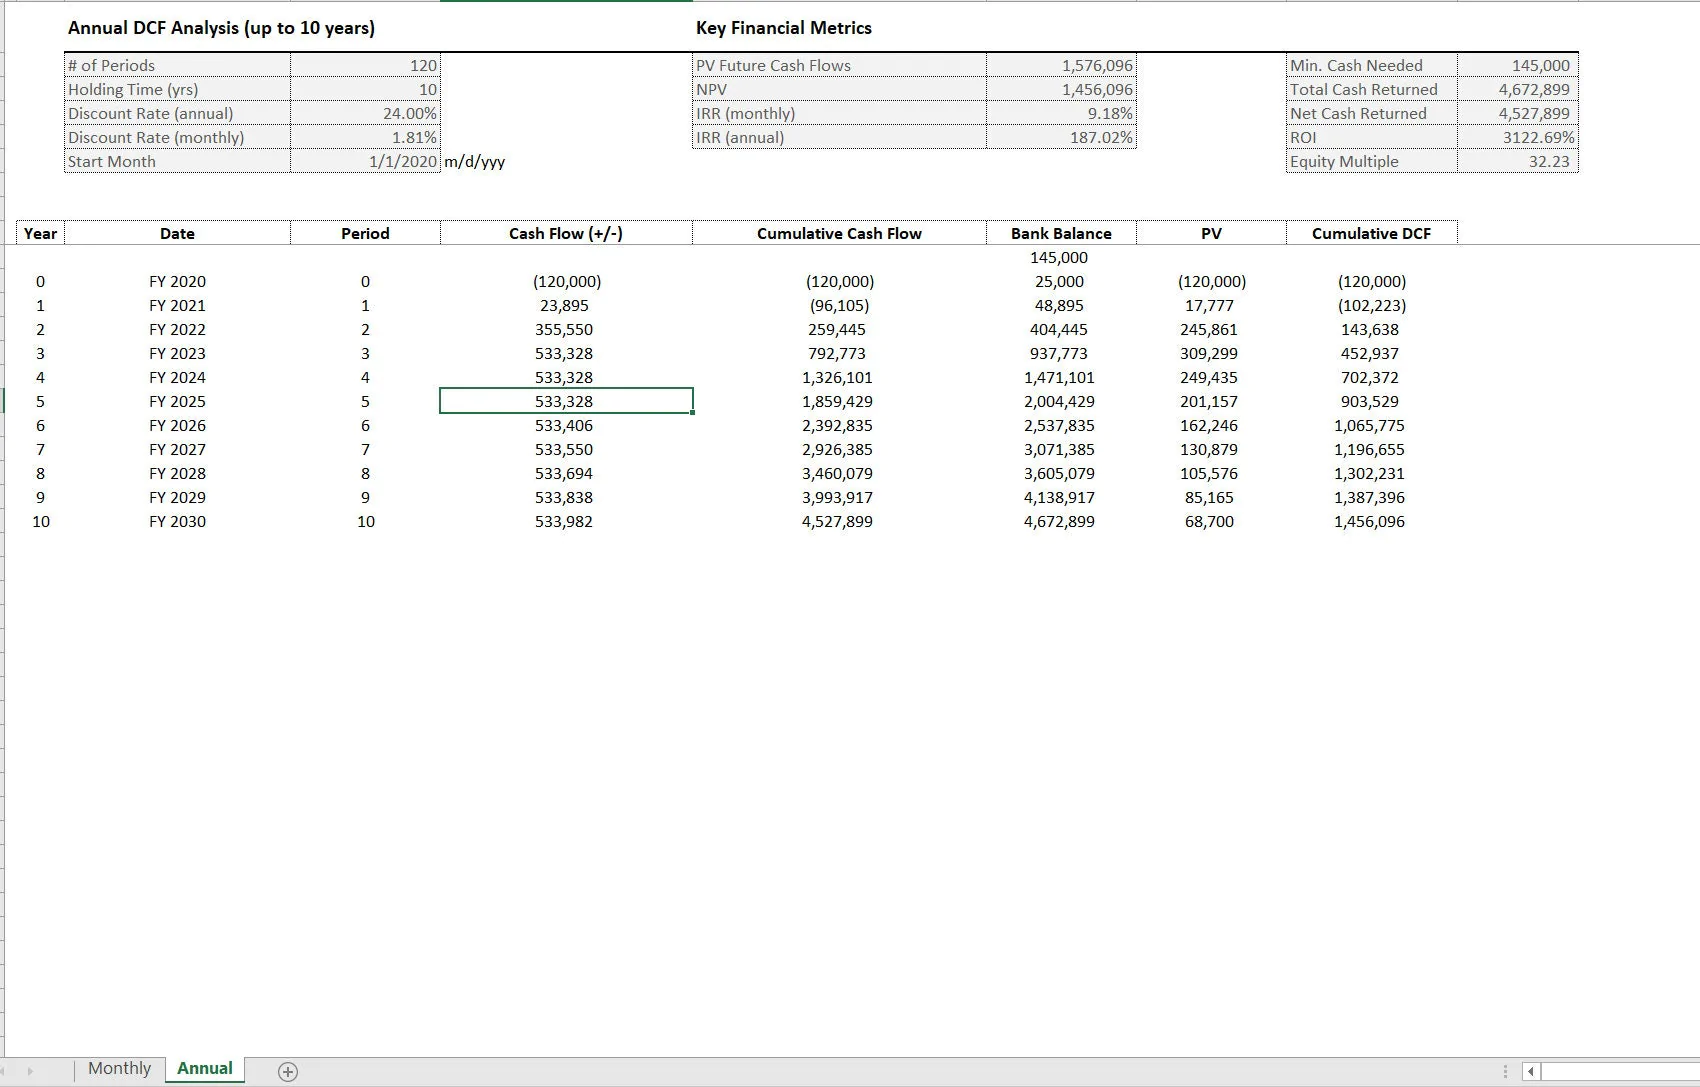
This is a general use monthly DCF (discounted cash flow) Analysis that lets the user enter in cash flow for up to 120 periods, including a period 0. There is also an annual summary (annual periods will display the NPV (net present value) of the monthly periods as that is ultimately more accurate).

If you did your own calculation of NPV on annual periods only, the value would be different by nature. The point of such an analysis is to figure out the present value of future cash flows as well as measure that present value against any initial investments.

Based on the discount rate defined, the NPV could be greater than or less than 0. This is often used for valuation in all sorts of uses. The model solves for monthly and annual IRR (which is the discount rate that results in a NPV of 0).

Other general financial metrics are also calculated based on the data entry and include ROI, minimum cash balance, equity multiple (based on all negative cash flows against positive cash flows), total and net cash returned.

The number of periods taken into account can be adjusted from 0 to 120 in order to allow dynamic analysis if for whatever reason you want to only see a certain number of periods worth of information being calculated.

Finally, there are a few visualizations that make it easier to see the effect of the time value of money. This means a cumulative value chart for the DCF and non-discounted CF.

The template is for general use so any set of cash flows that you want to use with it would be fine as long as it is not more than 120 periods. Just plug in the info, discount rate, and the model will calculate everything from there.

Got a question about the product? Email us at support@flevy.com or ask the author directly by using the "Ask the Author a Question" form. If you cannot view the preview above this document description, go here to view the large preview instead.

Source: Best Practices in Valuation Excel: DCF Analysis (Monthly Periods) Excel (XLSX) Spreadsheet, Jason Varner | SmartHelping


$45.00
This valuation model was crafted by a Financial Modeler and Accountant with over 10+ years of global experience. He has served 750+ clients, from small family offices to billion-dollar corporations, across a multitude of industries.
Add to Cart
  

OVERVIEW

File Type: Excel xlsx (XLSX)
File Size: 42.4 KB

ABOUT THE AUTHOR

Additional documents from author: 156

I graduated in 2011 with a Bachelors degree in Accounting. From there, I worked at a few small businesses doing financial reporting and some bookkeeping. After a few years of that, I started doing freelance financial consulting work on Elance and Upwork.

After over 400 jobs completed with a 100% success rate, I now run my own modeling/consulting practice and continue to build new financial models every few weeks. [read more]

Ask the Author a Question

Must be logged in

Did you know?
The average daily rate of a McKinsey consultant is $6,625 (not including expenses). The average price of a Flevy document is $65.
Bundle and save! You can save up to % with bundles!

View bundle(s)


Trusted by over 10,000+ Client Organizations
Since 2012, we have provided best practices to over 10,000 businesses and organizations of all sizes, from startups and small businesses to the Fortune 100, in over 130 countries.
AT&T GE Cisco Intel IBM Coke Dell Toyota HP Nike Samsung Microsoft Astrazeneca JP Morgan KPMG Walgreens Walmart 3M Kaiser Oracle SAP Google E&Y Volvo Bosch Merck Fedex Shell Amgen Eli Lilly Roche AIG Abbott Amazon PwC T-Mobile Broadcom Bayer Pearson Titleist ConEd Pfizer NTT Data Schwab


Read Customer Testimonials


Save with Bundles

This document is available as part of the following discounted bundle(s):


Customers Also Like These Documents

Related Management Topics


Valuation M&A (Mergers & Acquisitions) Valuation Model Example Loans Venture Capital Change Management Due Diligence Integrated Financial Model

Download our FREE Strategy & Transformation Framework Templates

Download our free compilation of 50+ Strategy & Transformation slides and templates. Frameworks include McKinsey 7-S, Balanced Scorecard, Disruptive Innovation, BCG Curve, and many more.