
Weekly Rolling Cash Flow Projection Excel Model – Excel XLSX
Excel (XLSX) + Excel (XLSX)
VIDEO DEMO
BENEFITS OF THIS DOWNLOADABLE EXCEL DOCUMENT
- Generic weekly Cash Flow Projection tool intended for a new or exising business to assist with cash management. Tool is generic and not industry-specific.
CASH FLOW MANAGEMENT EXCEL DESCRIPTION
A Weekly Rolling Cash Flow Projection is indispensable for businesses. It provides a granular view of cash inflows and outflows, enabling real-time cash management. This tool is essential for ensuring liquidity, avoiding financial crises, and optimizing working capital. It aids in identifying trends and irregularities in cash flow, allowing timely adjustments to spending or financing. Investors and lenders use it to assess a company's financial stability. In summary, a Weekly Rolling Cash Flow Projection fosters sound financial management, safeguards against cash shortages, and supports agile decision-making, crucial for a business's financial health and stability.
PURPOSE OF MODEL
User-friendly Excel model for the preparation of a 26-week rolling cash flow forecast for a generic new or existing business. The model allows the user to input cash flow assumptions for up to 3 revenue streams, 3 variable cost categories for each revenue stream, 5 staff cost categories and 12 other expense categories all of which can be easily extended if required. The model follows best practice financial modelling principles and includes instructions, line item explanations, checks and input validations.
KEY OUTPUTS
The model is generic and not industry-specific. The key outputs include:
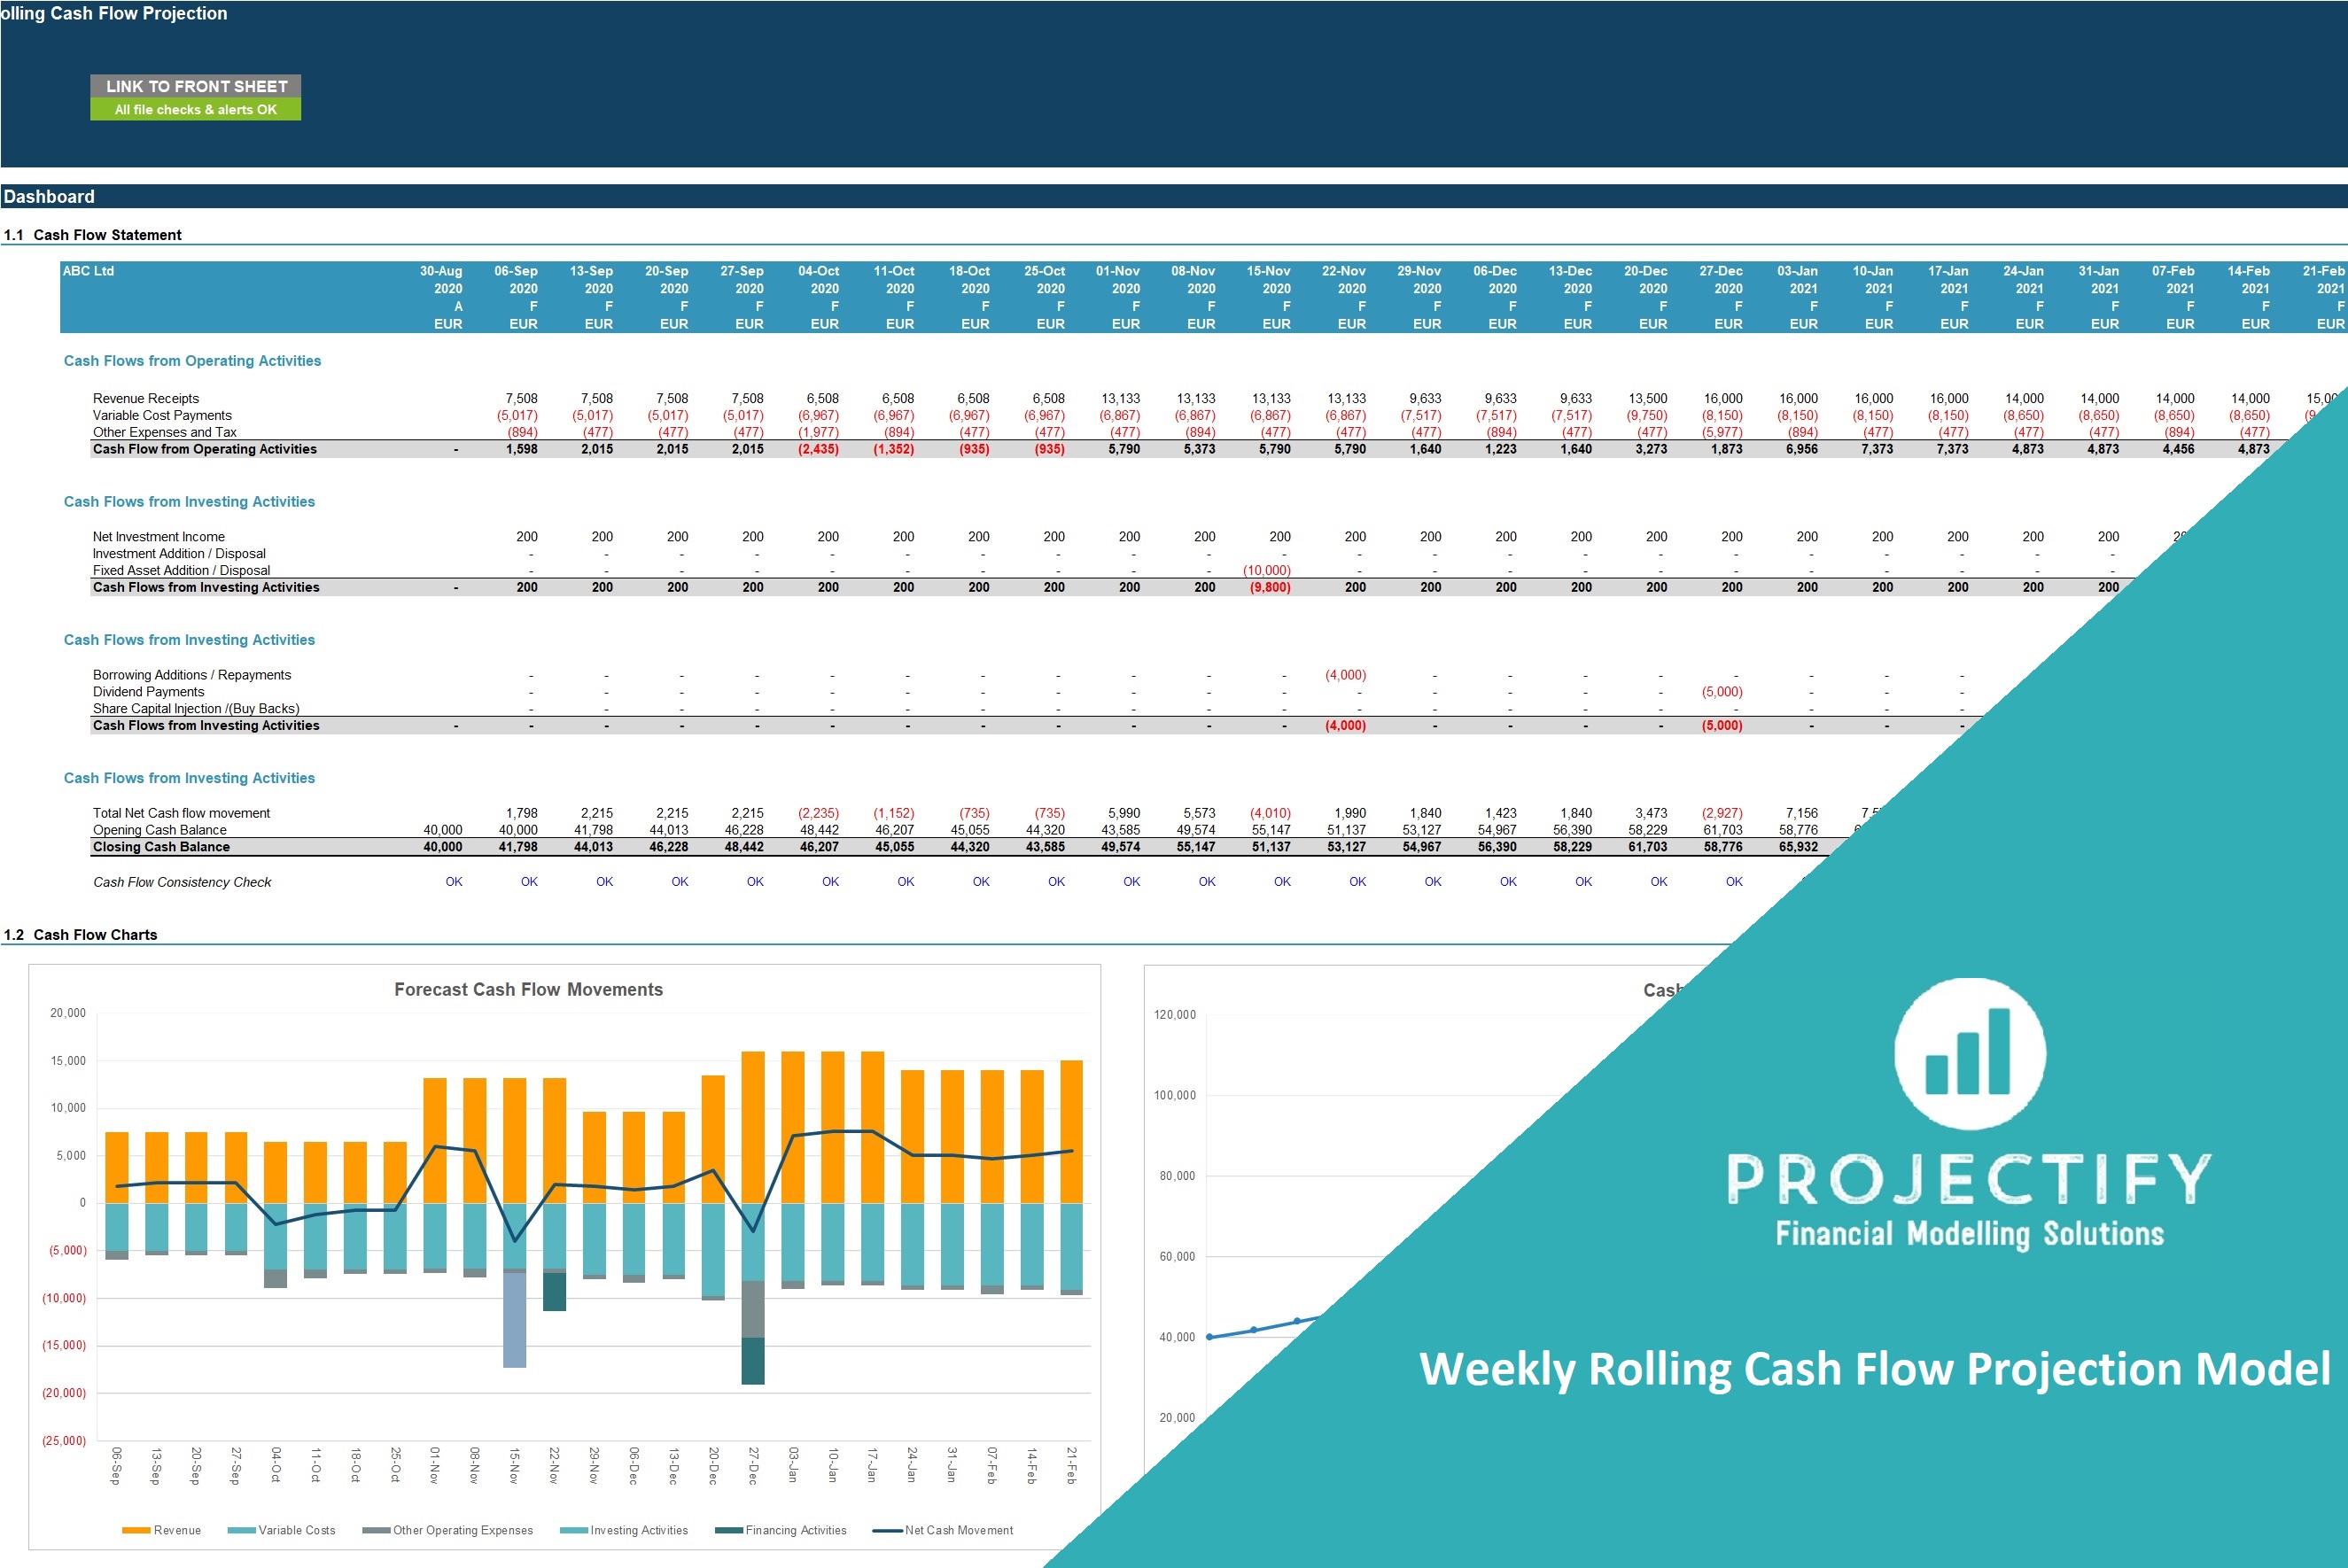
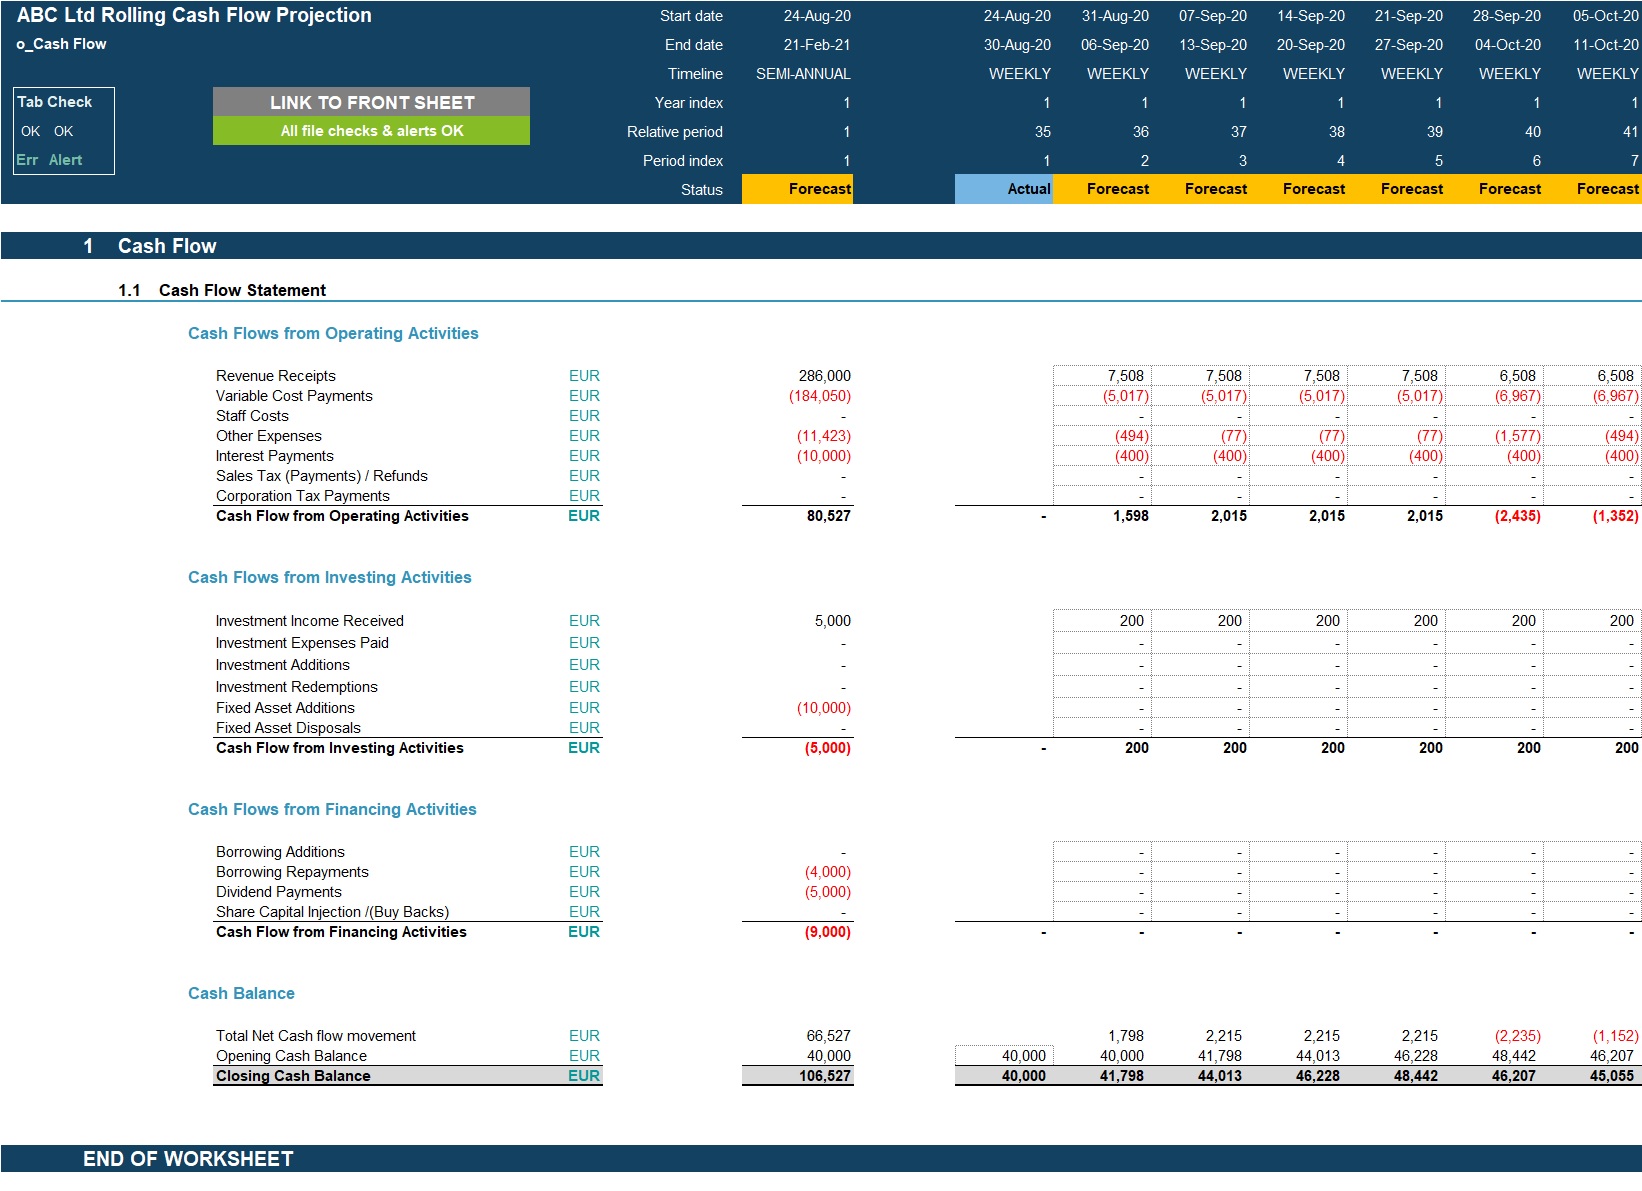
• Projected full Cash Flow Statement with splits by Operating, Financing and Investing activities presented on a weekly basis and summarised on a half-yearly basis.
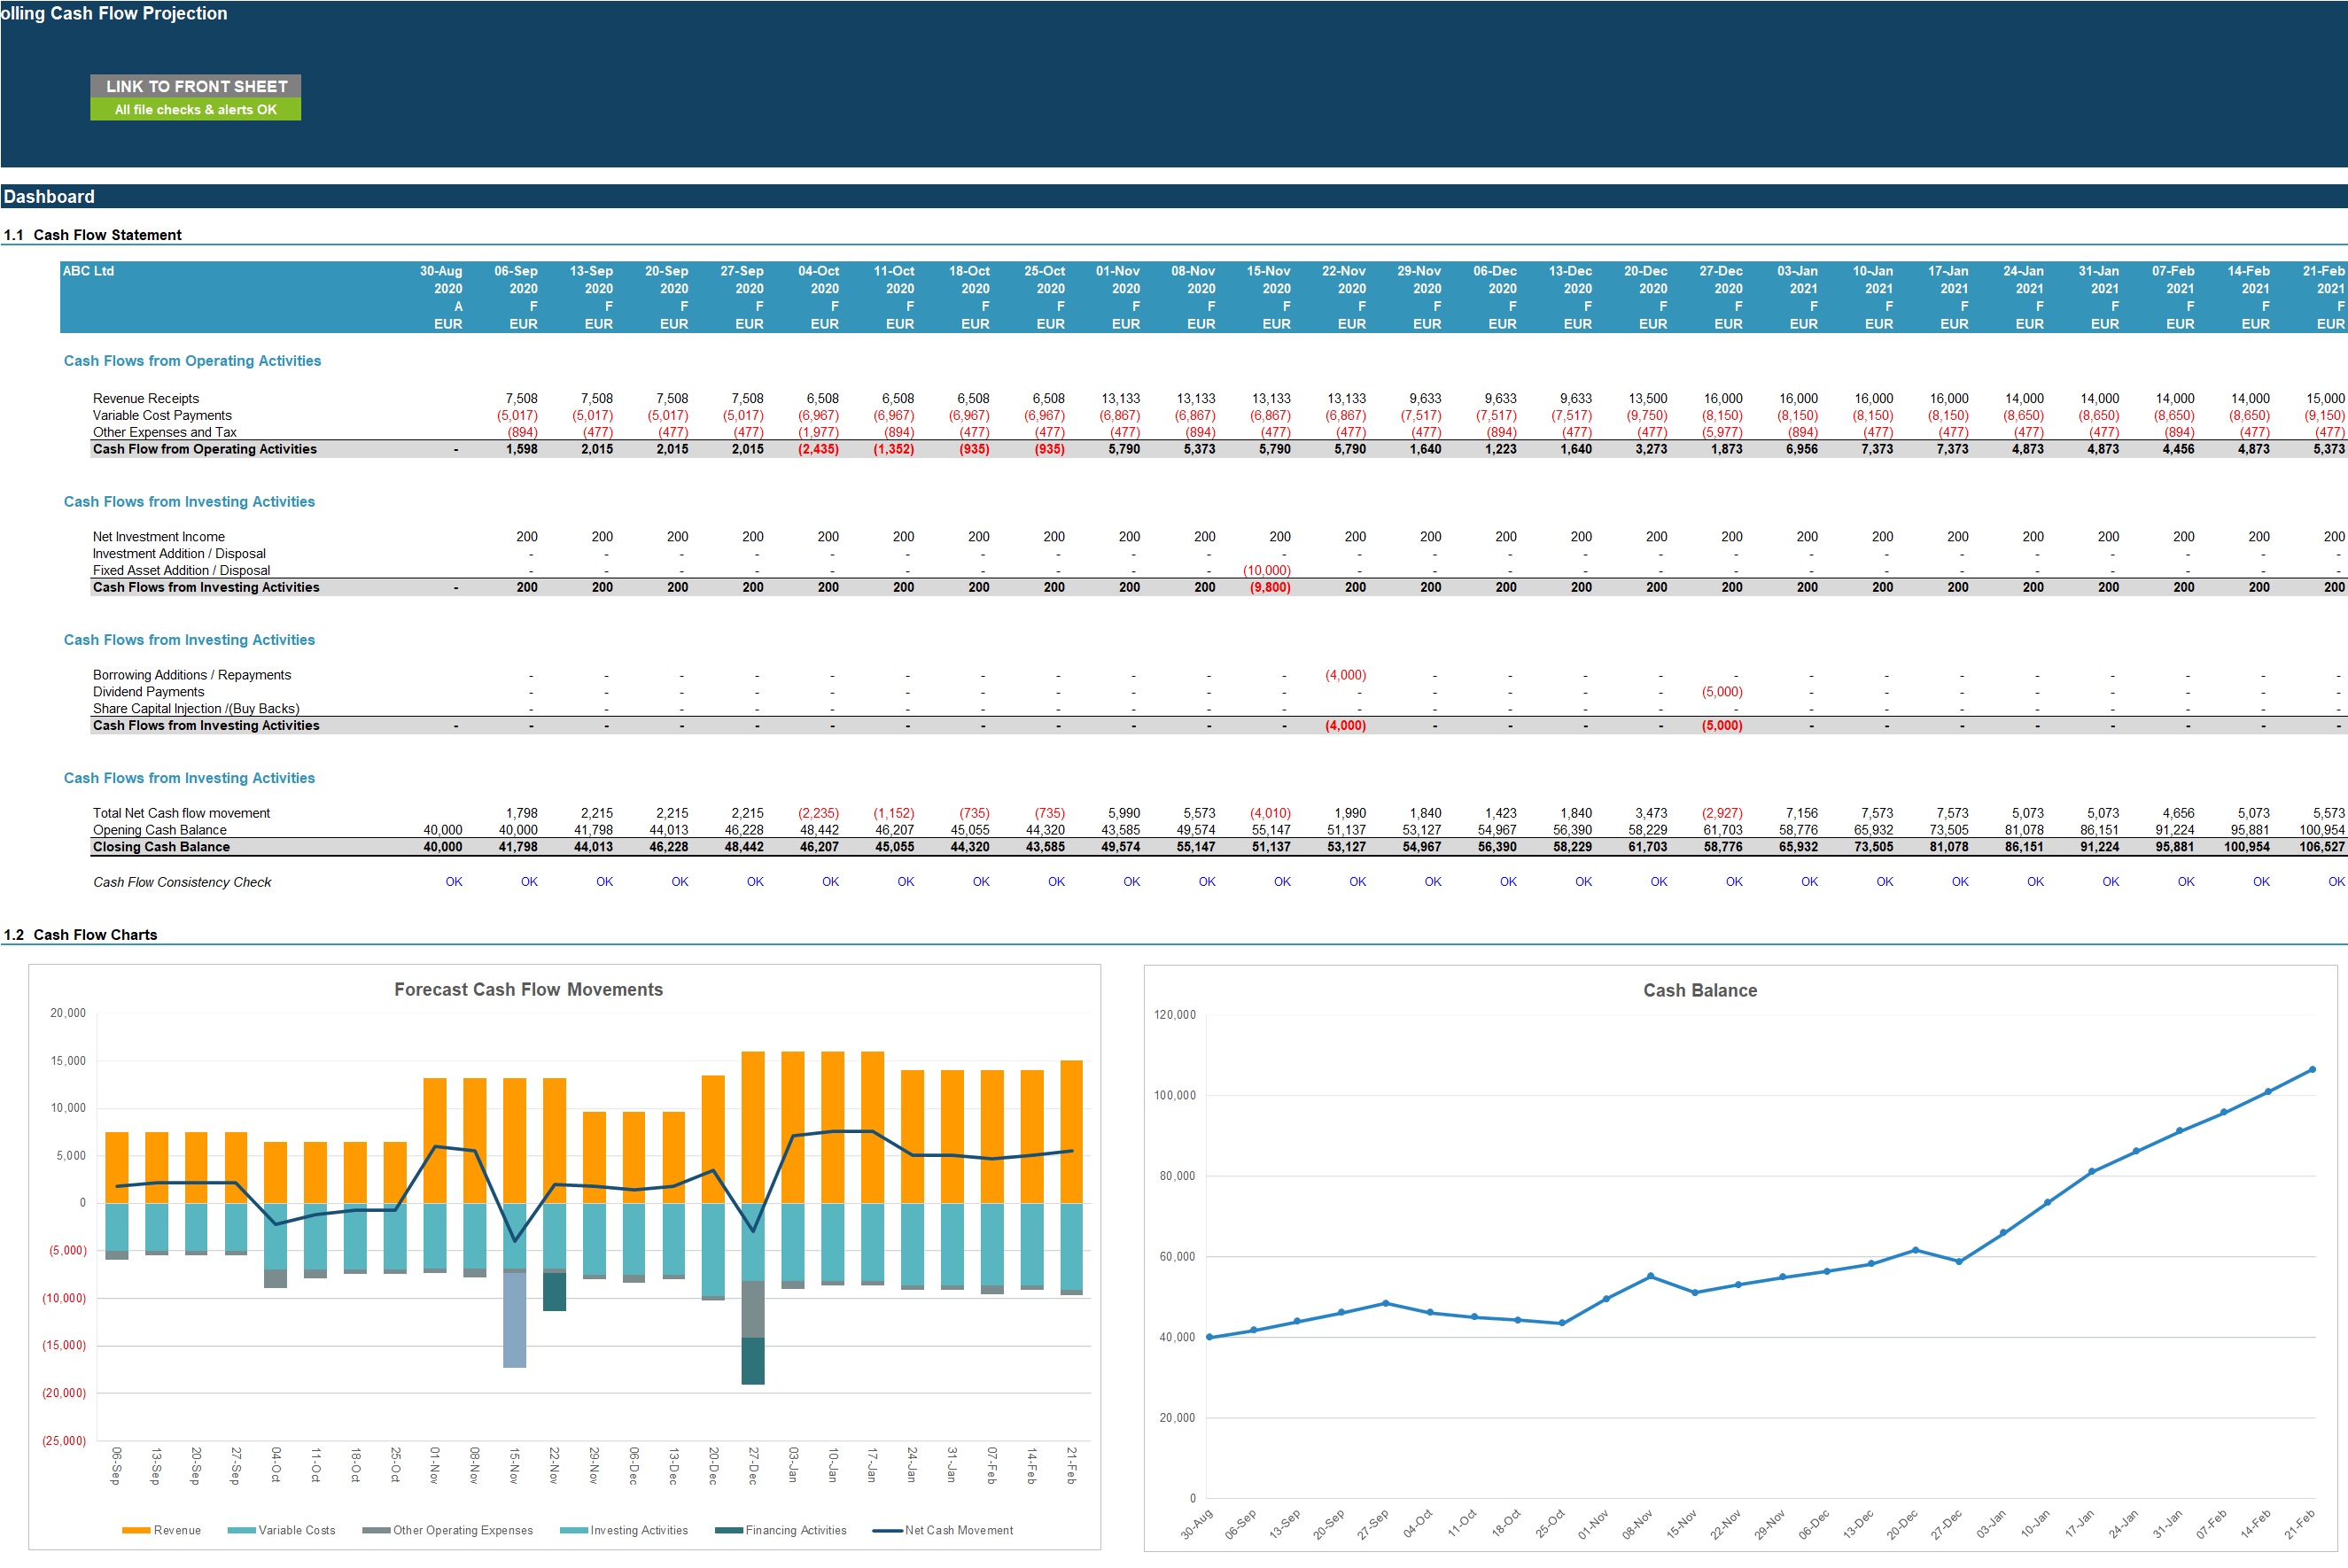
• Dashboard which includes the following:
Summarised projected Cash Flow Statement
Chart showing net cash movement by forecast week split by revenue, variable costs, other expenses, financing activities and investment activities.
Line Graph showing cash balance development over next 26 weeks.
KEY INPUTS
Inputs are split into setup inputs, latest actuals and projection assumptions. Inputs include user-friendly line item explanations and input validations to help users understand purpose of input and populate correctly.
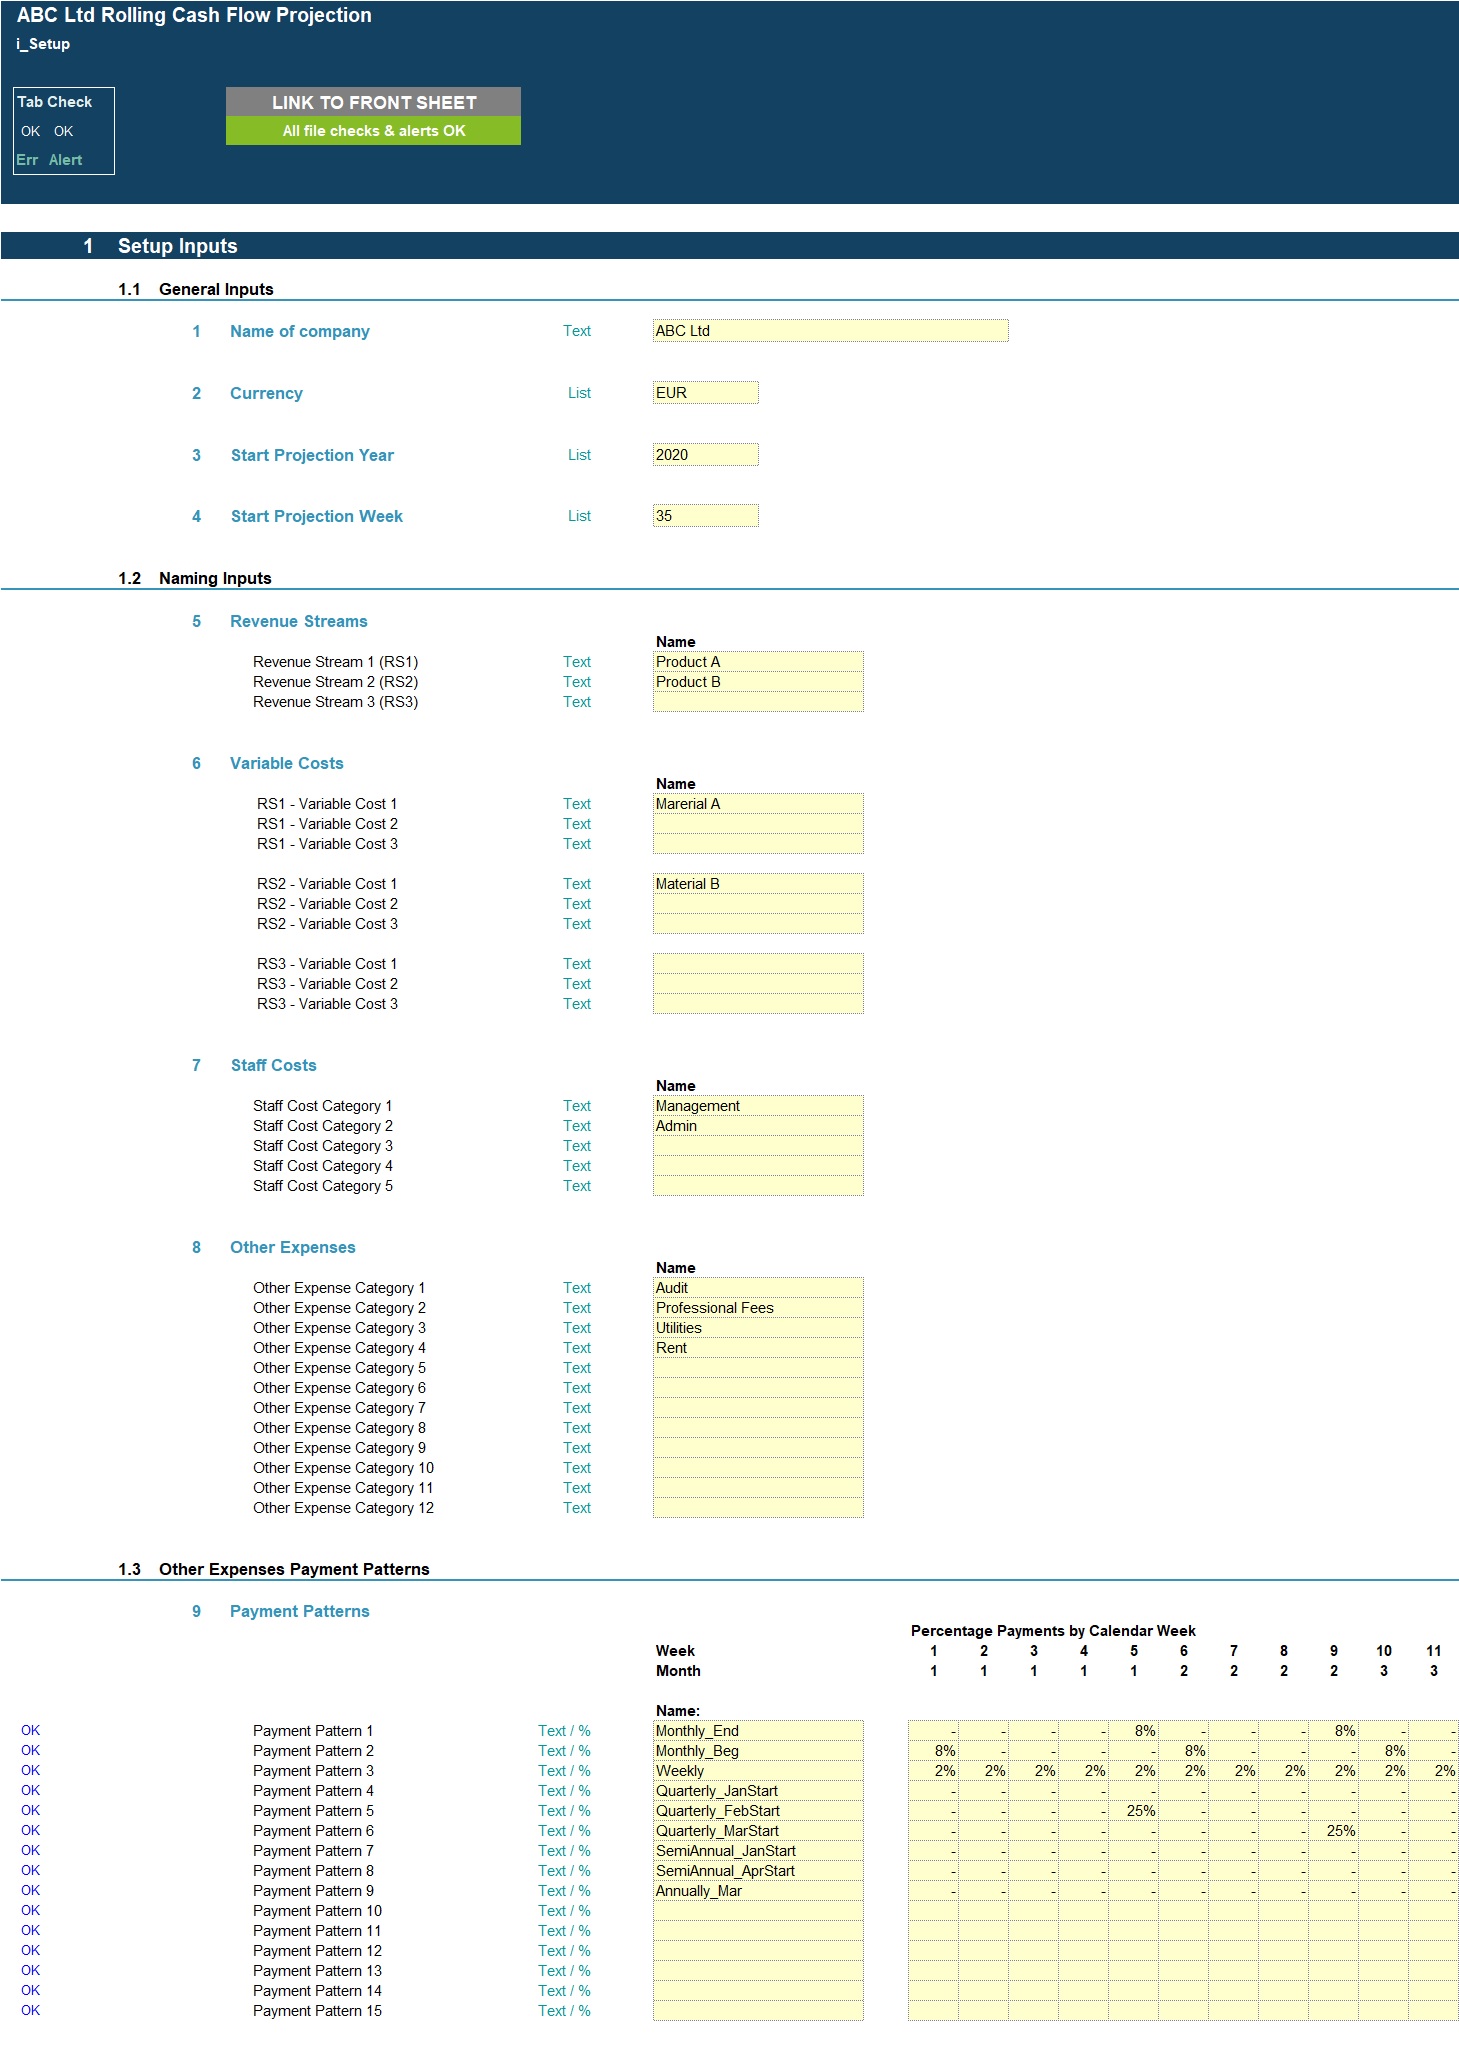
Setup Inputs:
• Name of business
• Currency
• First projection week and year
• Naming for Revenue Streams, Variable Costs, Other Expenses and Payment Patterns
• Payment patterns on weekly basis
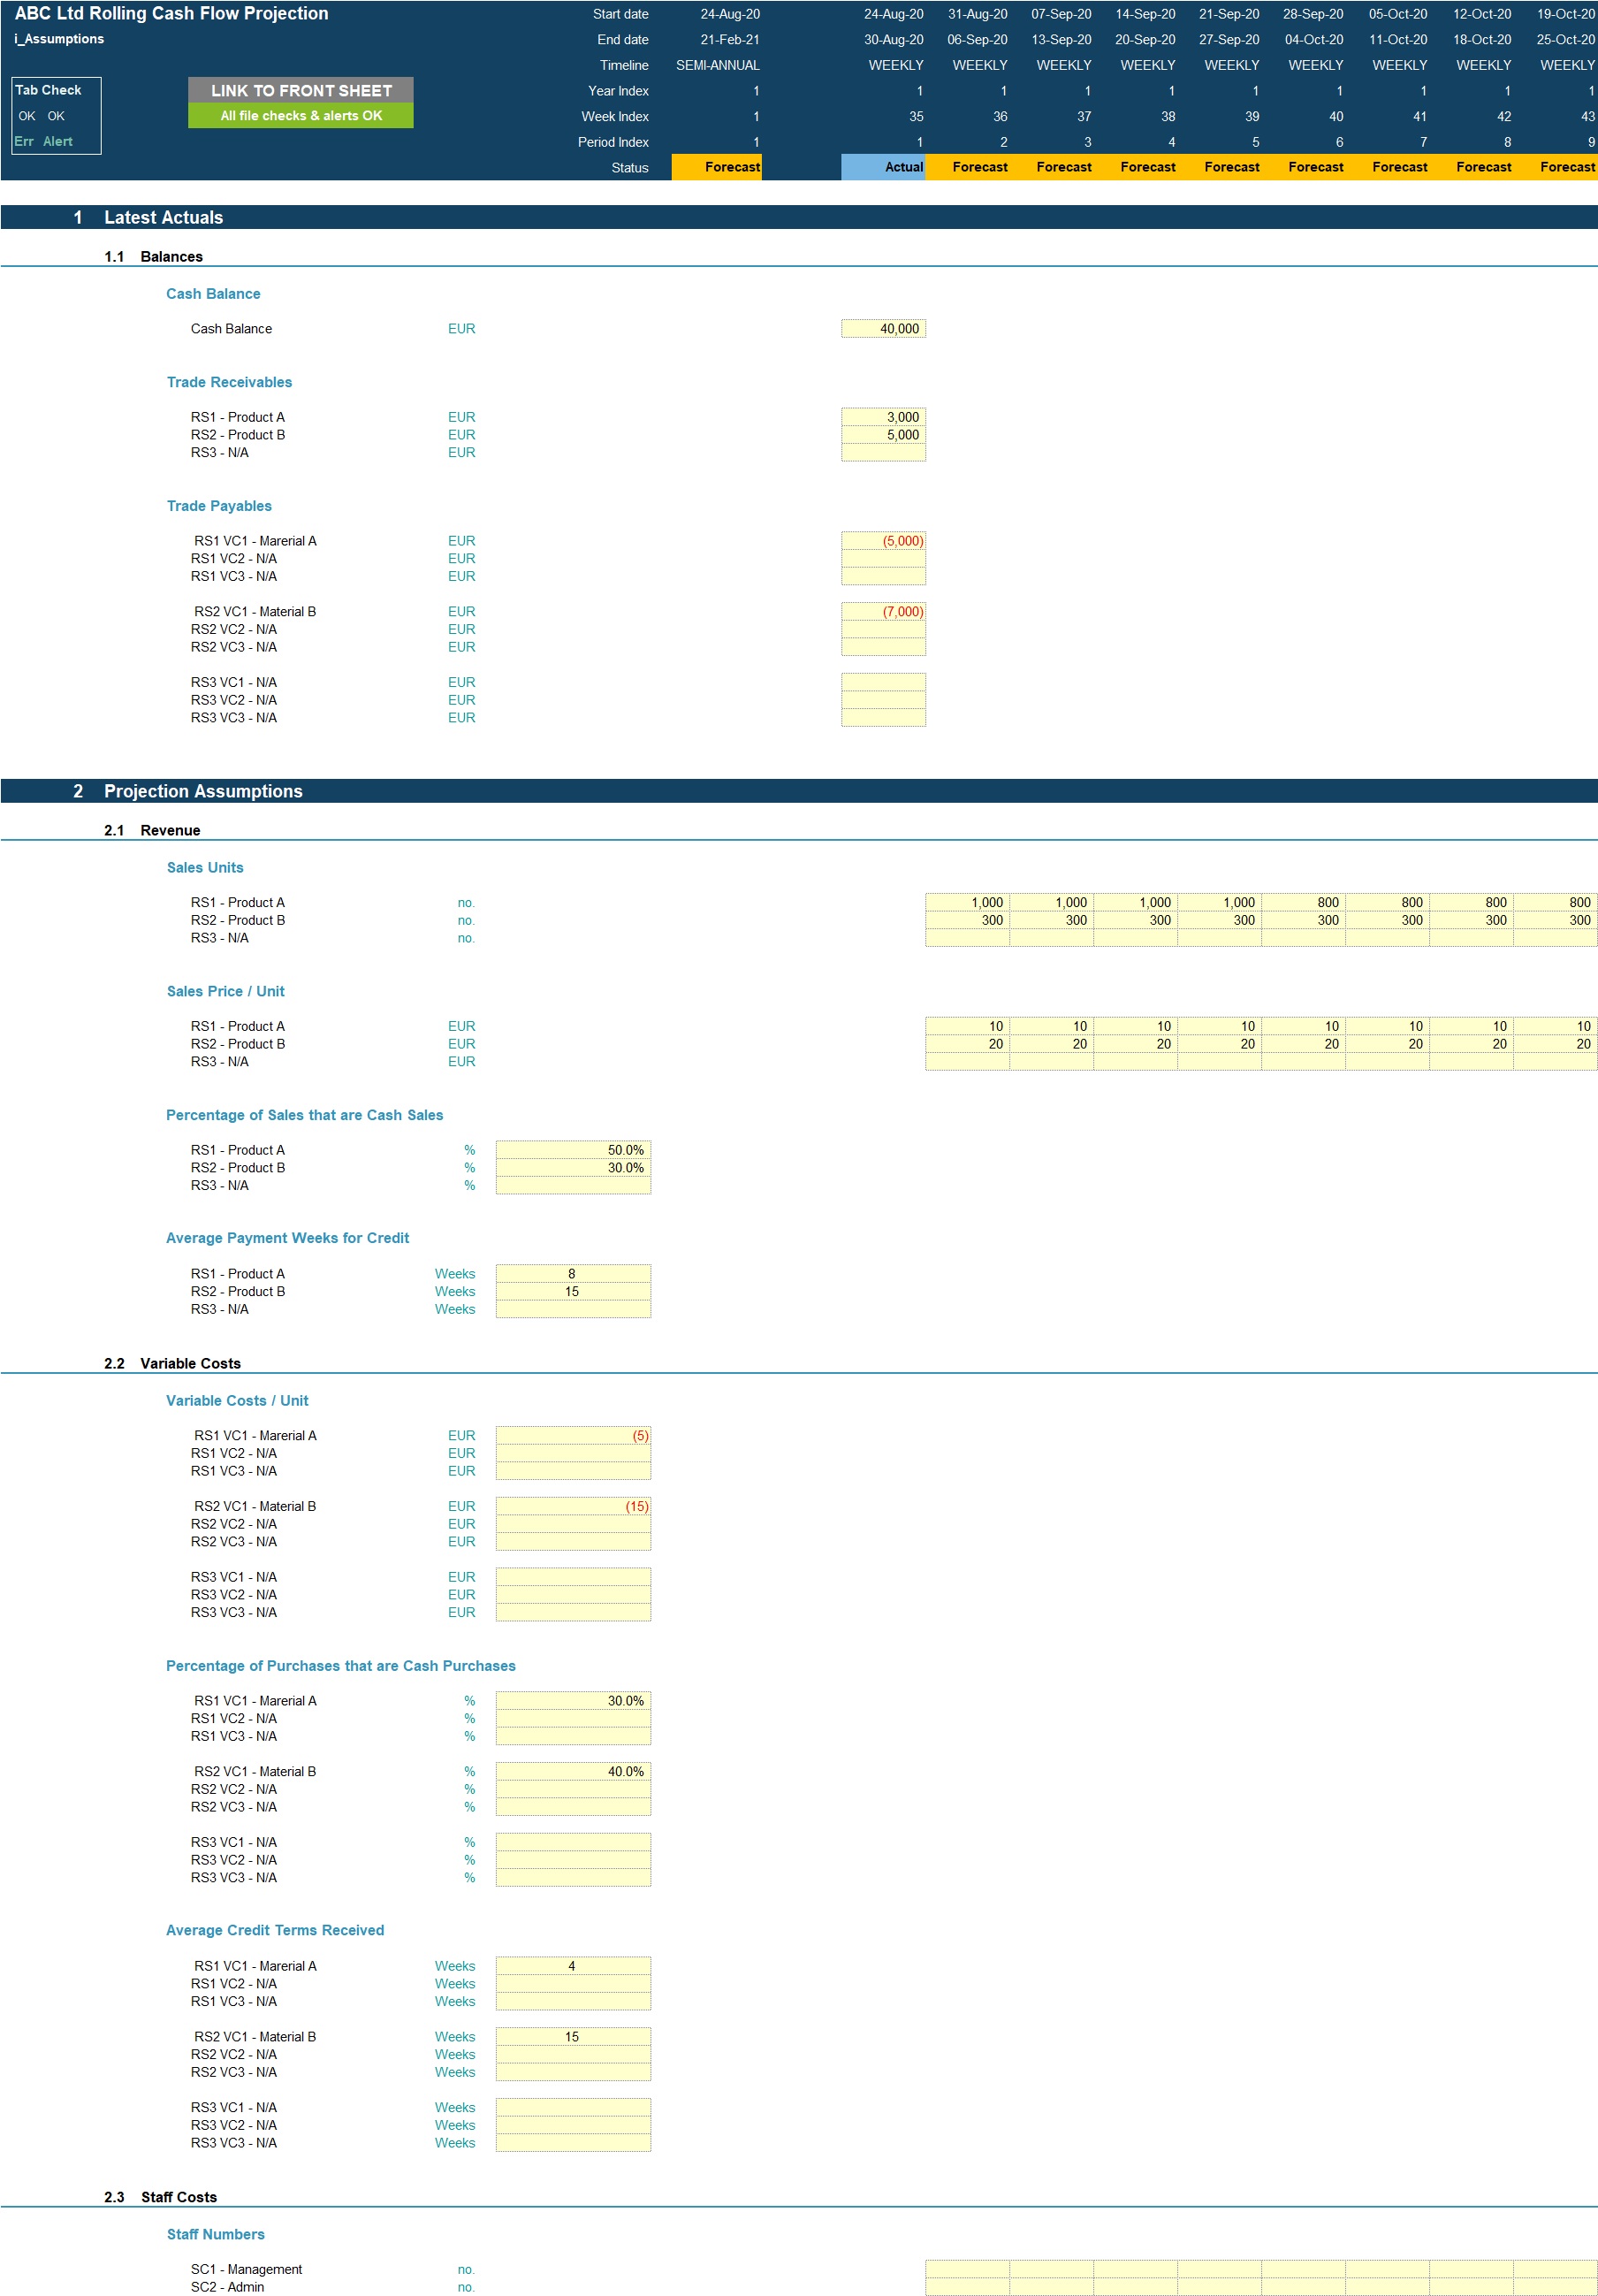
Actuals Inputs:
• Cash Opening Balance
• Trade Receivables Opening Balance
• Trade Payables Opening Balance
Projection Inputs:
• Revenue inputs including sales volume, sales prices, cash vs credit sale percentages and average credit terms offered;
• Variable cost inputs including variable cost per unit, cash vs credit purchase percentages and average credit terms received;
• Staff cost inputs including staff numbers and average staff costs per month
• Other expense inputs including Annual Cost and payment pattern selection.
• Other Cash Flow inputs including, Tax cash flows, Investment cash flows, borrowing cash flows, dividends and share capital cash flows.
MODEL STRUCTURE
The model contains, 7 tabs split into input ('i_'), calculation ('c_'), output ('o_') and system tabs. The tabs to be populated by the user are the input tabs ('i_Setup' and 'i_Assumptions'). The calculation tab uses the user-defined inputs to calculate and produce the projection outputs which are presented in 'o_Cash Flow' and ‘o_Charts'
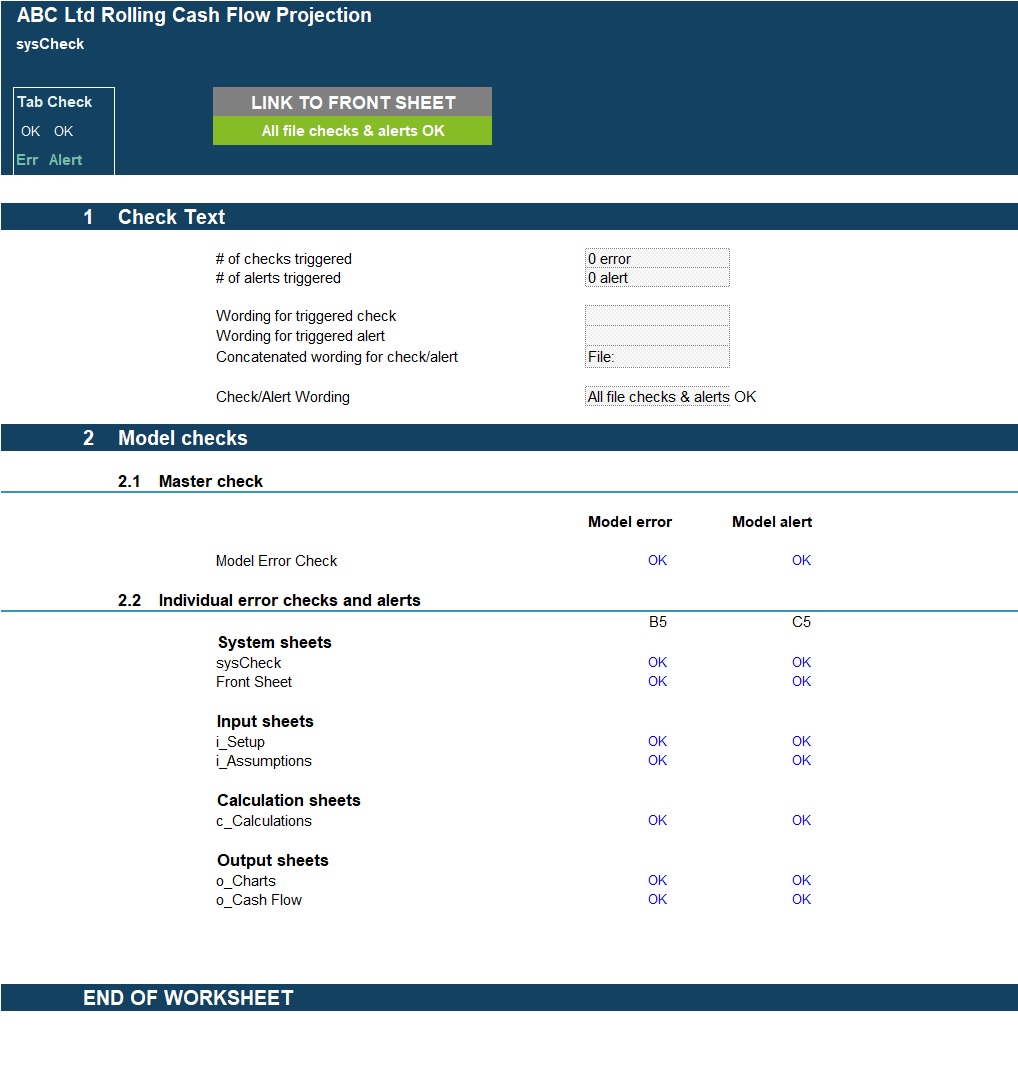
System tabs include:
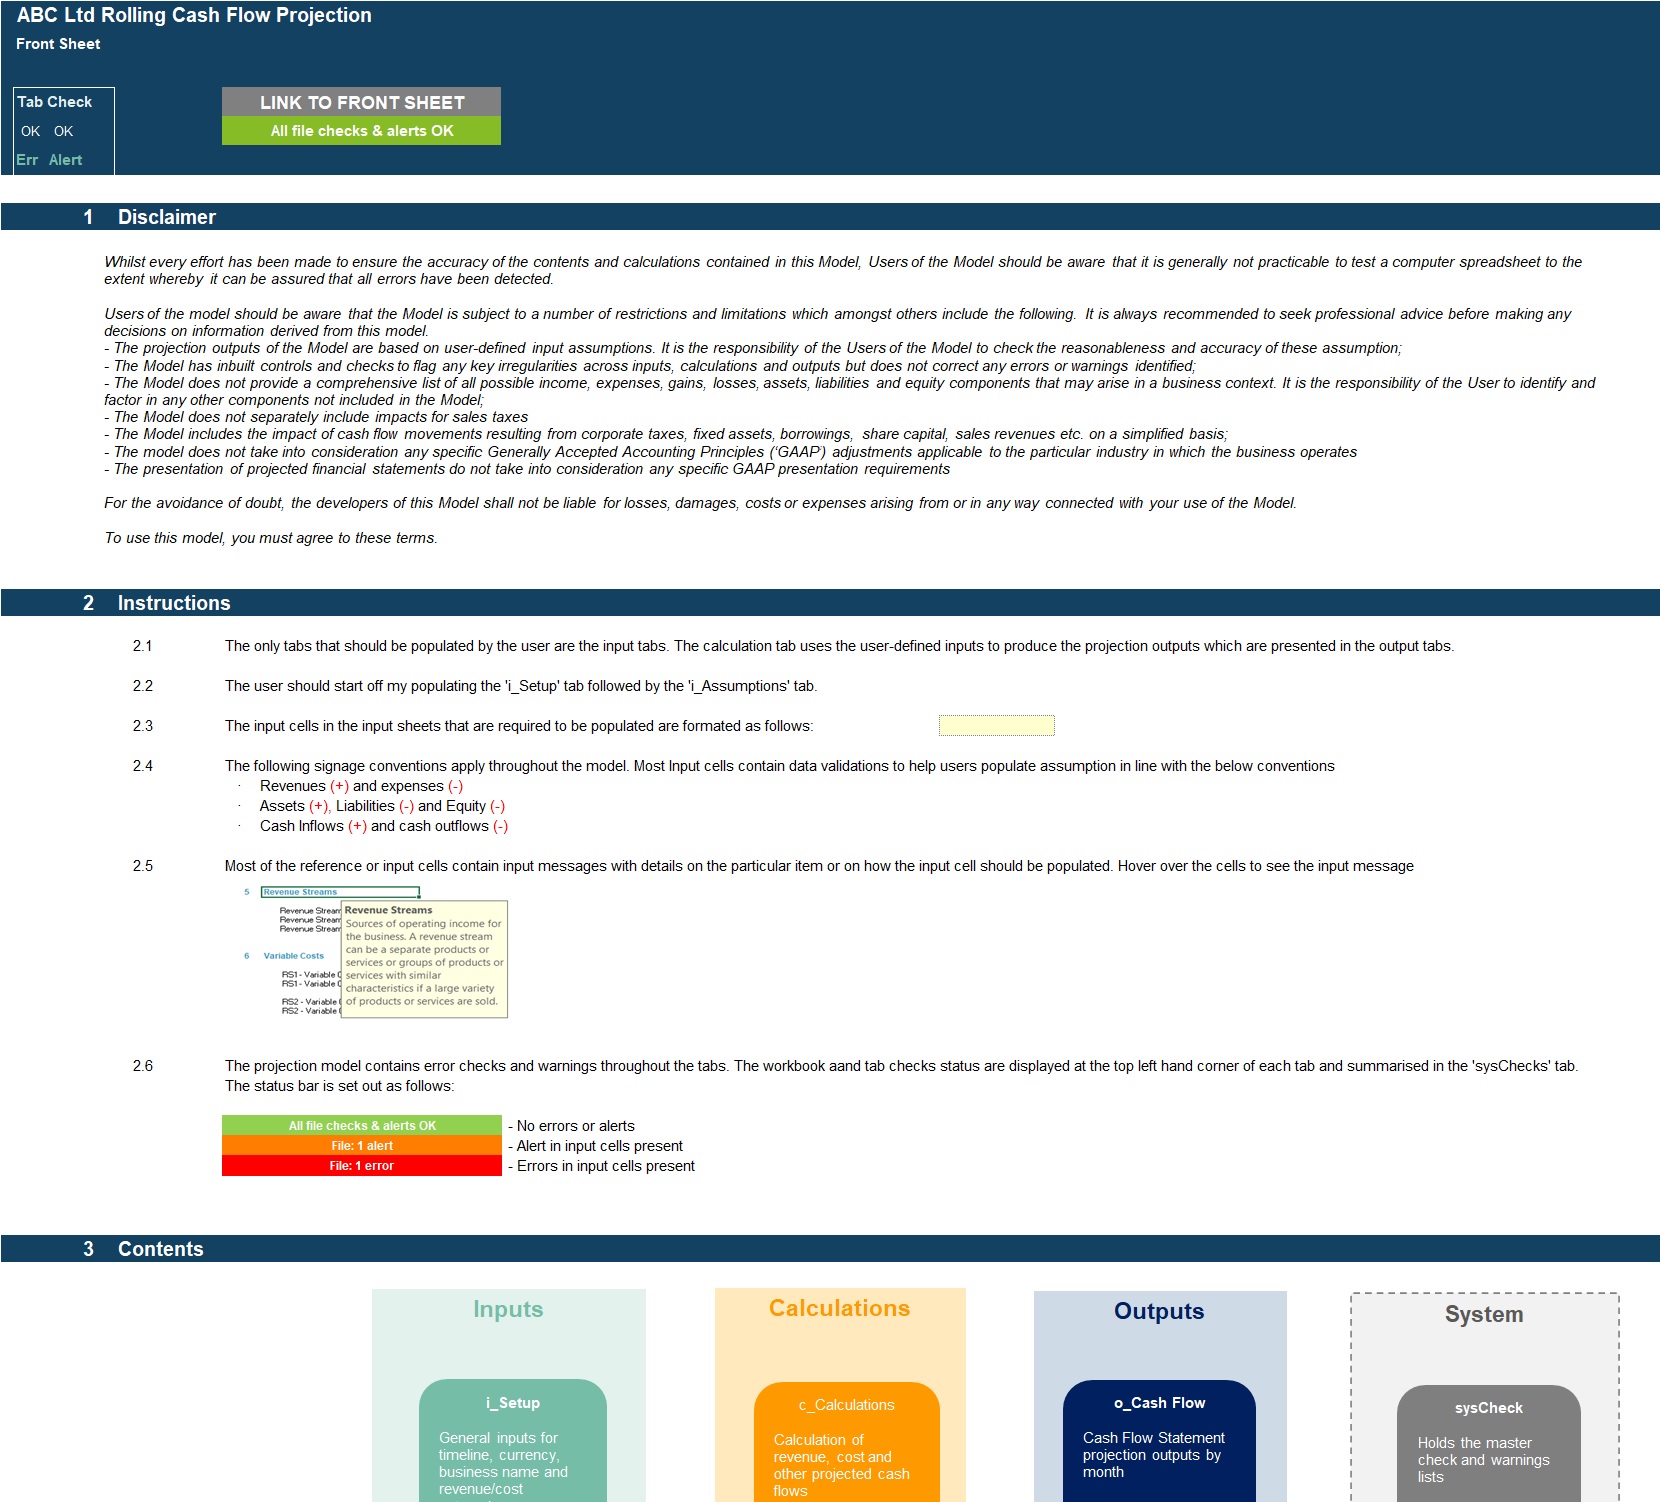
• A 'Front Sheet' containing a disclaimer, instructions and contents;
• A Checks dashboard containing a summary of checks by tab.
KEY FEATURES
Other key features of this model include the following:
• The model follows best practice financial modelling guidelines and includes instructions, line item explanations, checks and input validations;
• The model allows for a 6-month (26 week) rolling projection on a weekly basis and summarised on a half-year basis;
• The model is not password protected and can be modified as required following download;
• The model is reviewed using specialised model audit software to help ensure formula consistency and significantly reduce risk of errors;
• The model allows the user to model 3 separate revenue streams on a Price x Volume basis;
• Costs are split into: variable and other costs for better driver-based forecasting;
• Model included up to 15 user-defined weekly payment patterns which are used to calculate the settlement of ‘Other expenses' allowing significant flexibility;
• Business Name, currency, starting projection period are fully customisable;
• Revenue, Cost and Payment Pattern descriptions are fully customisable;
• The model includes instructions, line item explanations, checks and input validations to help ensure input fields are populated accurately;
• The model includes a checks dashboard which summarises all the checks included in the various tabs making it easier to identify any errors.
This model empowers executives to make informed cash management decisions with its intuitive dashboard and detailed projections. With customizable inputs and robust validation checks, it streamlines the forecasting process, ensuring accuracy and reliability in your financial planning.
Got a question about the product? Email us at support@flevy.com or ask the author directly by using the "Ask the Author a Question" form. If you cannot view the preview above this document description, go here to view the large preview instead.
TOPIC FAQ
What is a weekly rolling cash flow forecast and why would a business use one?
A weekly rolling cash flow forecast projects cash inflows and outflows on a weekly basis to provide granular liquidity visibility and detect short-term cash shortages. It supports timely adjustments to spending or financing and is typically run over a defined horizon such as a 26-week rolling projection.What core inputs are needed to build a weekly rolling cash flow model?
Core inputs include setup details (business name, currency, projection start week), latest actuals (opening cash balance, trade receivables, trade payables) and projection assumptions like sales volume, prices, cash vs credit percentages, credit terms, staff numbers and other expense payment patterns.How detailed should revenue and cost drivers be in a weekly cash forecast?
Granularity depends on needs; a practical driver-based setup supports multiple streams and cost types—for example up to 3 revenue streams, 3 variable cost categories per stream, 5 staff cost categories and 12 other expense categories to enable weekly driver calculations.What features should I look for when choosing a weekly cash flow template?
Look for driver-based inputs, clear line-item explanations, input validations, formula checks or an audit review, weekly and summary outputs, and an editable XLSX file format. These elements help accuracy and transparency, such as model audit review and input validations.How long does it take a small finance team to populate a weekly cash flow template?
Time depends on data availability; templates that include setup inputs (business name, currency, first projection week), user guidance, and input validations reduce manual work and help teams populate projections once opening balances and receivables/payables data are available.How can investors or lenders use a weekly rolling cash forecast to assess a company?
Lenders and investors use weekly forecasts to evaluate short-term liquidity and runway by reviewing projected cash balance trends and the Cash Flow Statement split by operating, financing, and investing activities to assess stability over the forecast horizon.After a sudden sales decline, how can a rolling cash forecast support liquidity decisions?
A weekly rolling forecast reveals timing of cash shortfalls and the impact of revenue drops on cash balances, enabling decisions on cost cuts, payment deferrals, or short-term borrowing. Visual tools like the 26-week cash balance line graph help quantify timing and magnitude.Can a cash flow model handle different payment schedules and seasonality?
Yes—robust templates allow multiple user-defined payment patterns to reflect timing differences in collections and payments; for example, the model supports up to 15 user-defined weekly payment patterns to calculate settlement timing for other expenses.Source: Best Practices in Cash Flow Management Excel: Weekly Rolling Cash Flow Projection Excel Model Excel (XLSX) Spreadsheet, Projectify
ABOUT THE AUTHOR
We are financial modelling professionals, accountants and CFA charterholders with experience working within Deloitte supporting clients with their financial planning and decision support needs. Our aim is to provide robust and easy-to-use financial models that follow good practice financial modelling guidelines and assist individuals and businesses with key financial planning and analysis ... [read more]
Ask the Author a Question
You must be logged in to contact the author.
