Want FREE Templates on Digital Transformation? Download our FREE compilation of 50+ slides. This is an exclusive promotion being run on LinkedIn.

Investment Analysis: IRR Comparison Tool   Excel template (XLSX)
$45.00

Investment Analysis: IRR Comparison Tool (Excel template (XLSX)) Preview Image Investment Analysis: IRR Comparison Tool (Excel template (XLSX)) Preview Image Investment Analysis: IRR Comparison Tool (Excel template (XLSX)) Preview Image Investment Analysis: IRR Comparison Tool (Excel template (XLSX)) Preview Image Investment Analysis: IRR Comparison Tool (Excel template (XLSX)) Preview Image
Arrow   Unlock all preview images:   Login Register

Investment Analysis: IRR Comparison Tool (Excel XLSX)

File Type: Excel template (XLSX)

$45.00
This valuation model was crafted by a Financial Modeler and Accountant with over 10+ years of global experience. He has served 750+ clients, from small family offices to billion-dollar corporations, across a multitude of industries.
Add to Cart


BUY WITH CONFIDENCE

Immediate digital download upon purchase.
Lifetime document updates included with purchase.
Fully editable & customizable XLSX document.
Trusted by over 10,000+ organizations.

DESCRIPTION

This product (Investment Analysis: IRR Comparison Tool) is an Excel template (XLSX), which you can download immediately upon purchase.

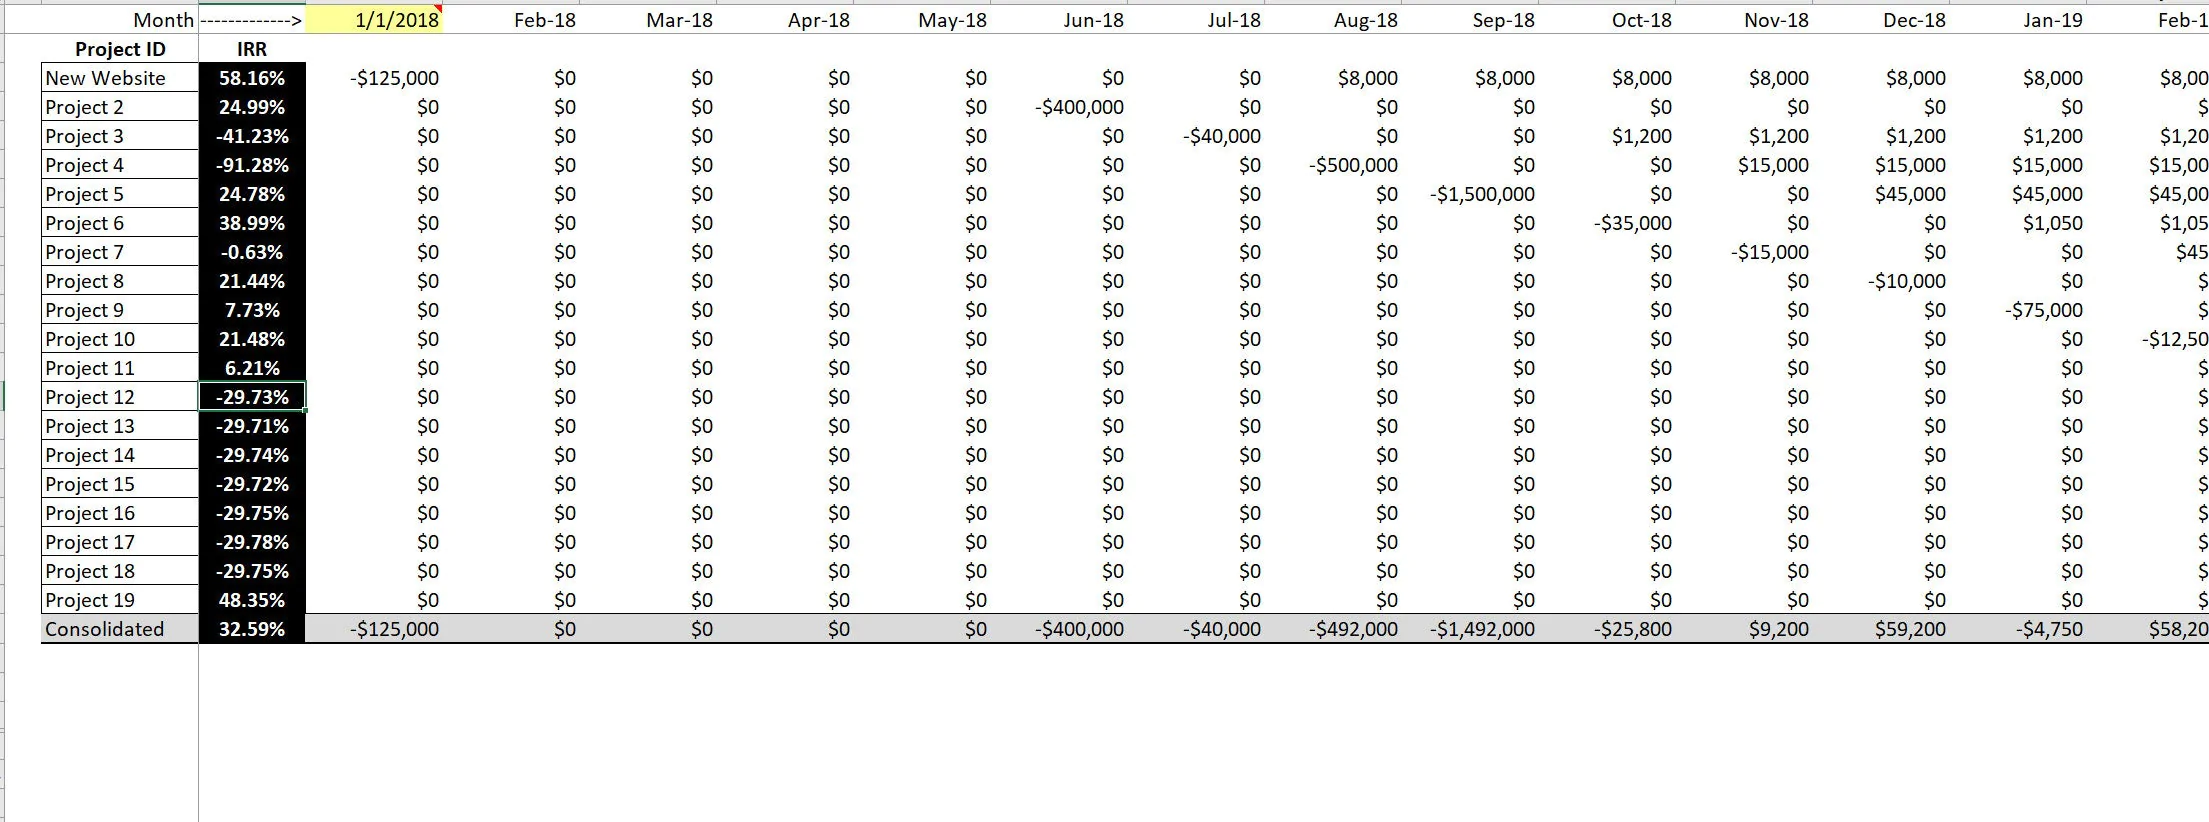
Tracking IRR by way of using the 'XIRR' function in Excel can be tricky when you are looking at multiple cash flow streams with different start dates. You can't just drag the formula down, it needs to dynamically reference the date and cash flow when those cash flows start (the column they begin in) and as you change start dates, the XIRR formulas needs to also change. This template has the indirect function logic to handle such an analysis.

This model is designed to compare various projects that you plan on doing within a given company or separate projects. The point is to compare up to 19 different cash flow streams based on their monthly cash inflows and outflows for up to a 20 year period.

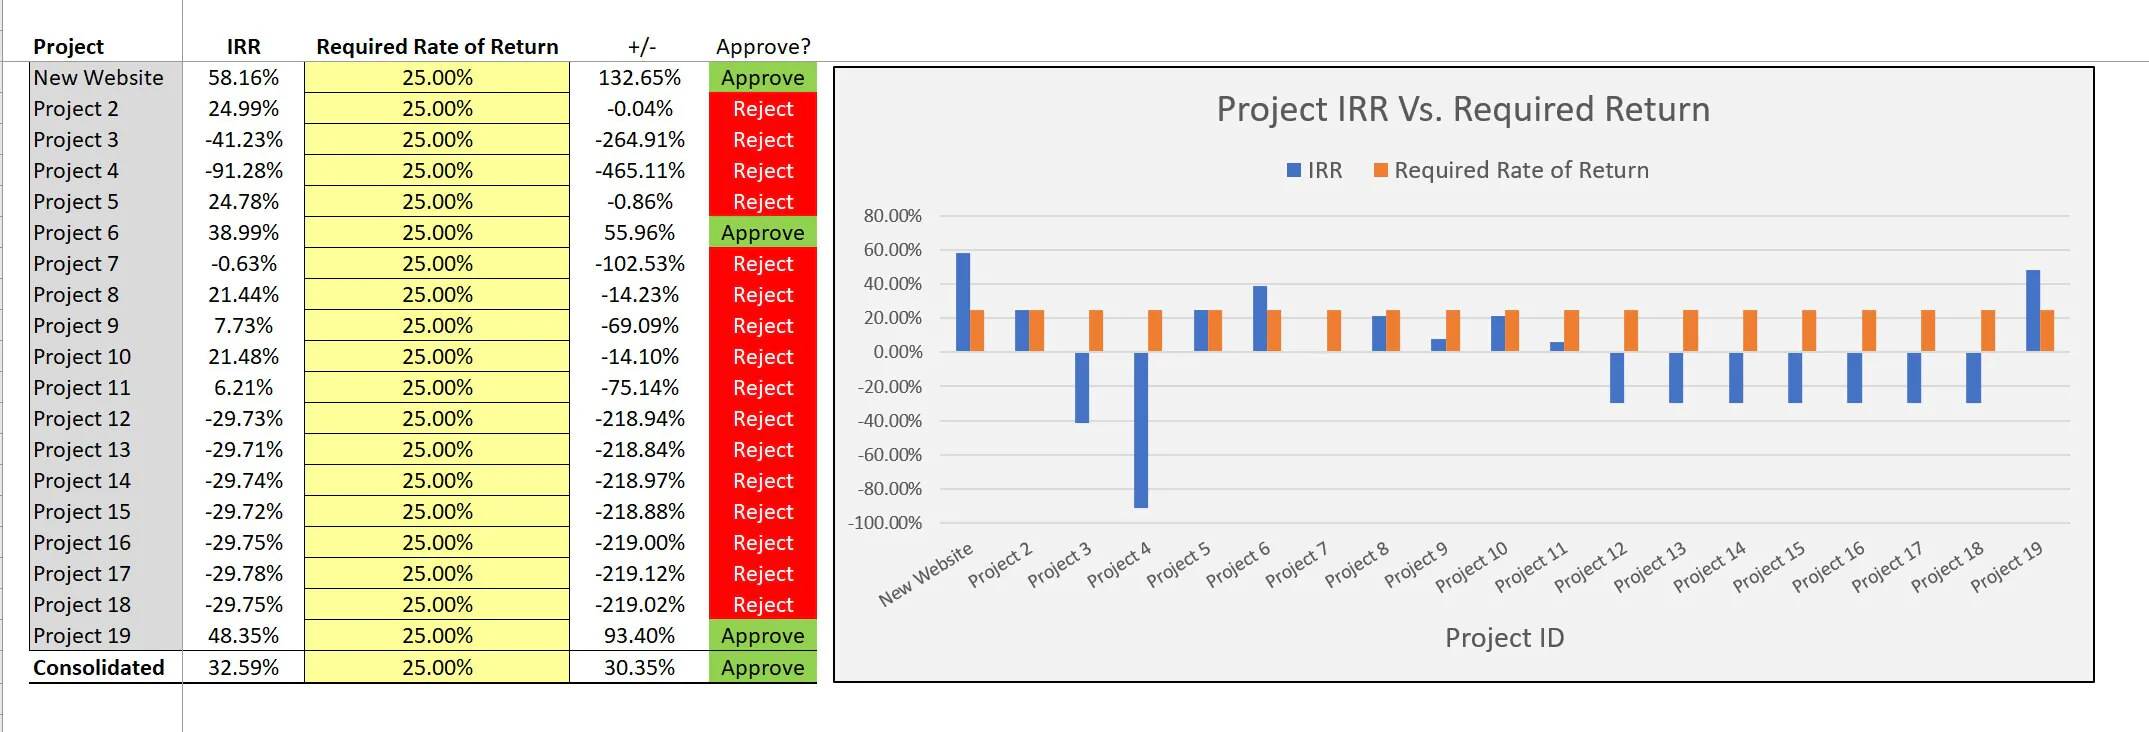
There is a dashboard that displays the IRR of each project (XIRR was used and in order to not get errors, the indirect formula was utilized so each cash flow stream could be properly calculated no matter when the cash started / stopped on the same timeline.

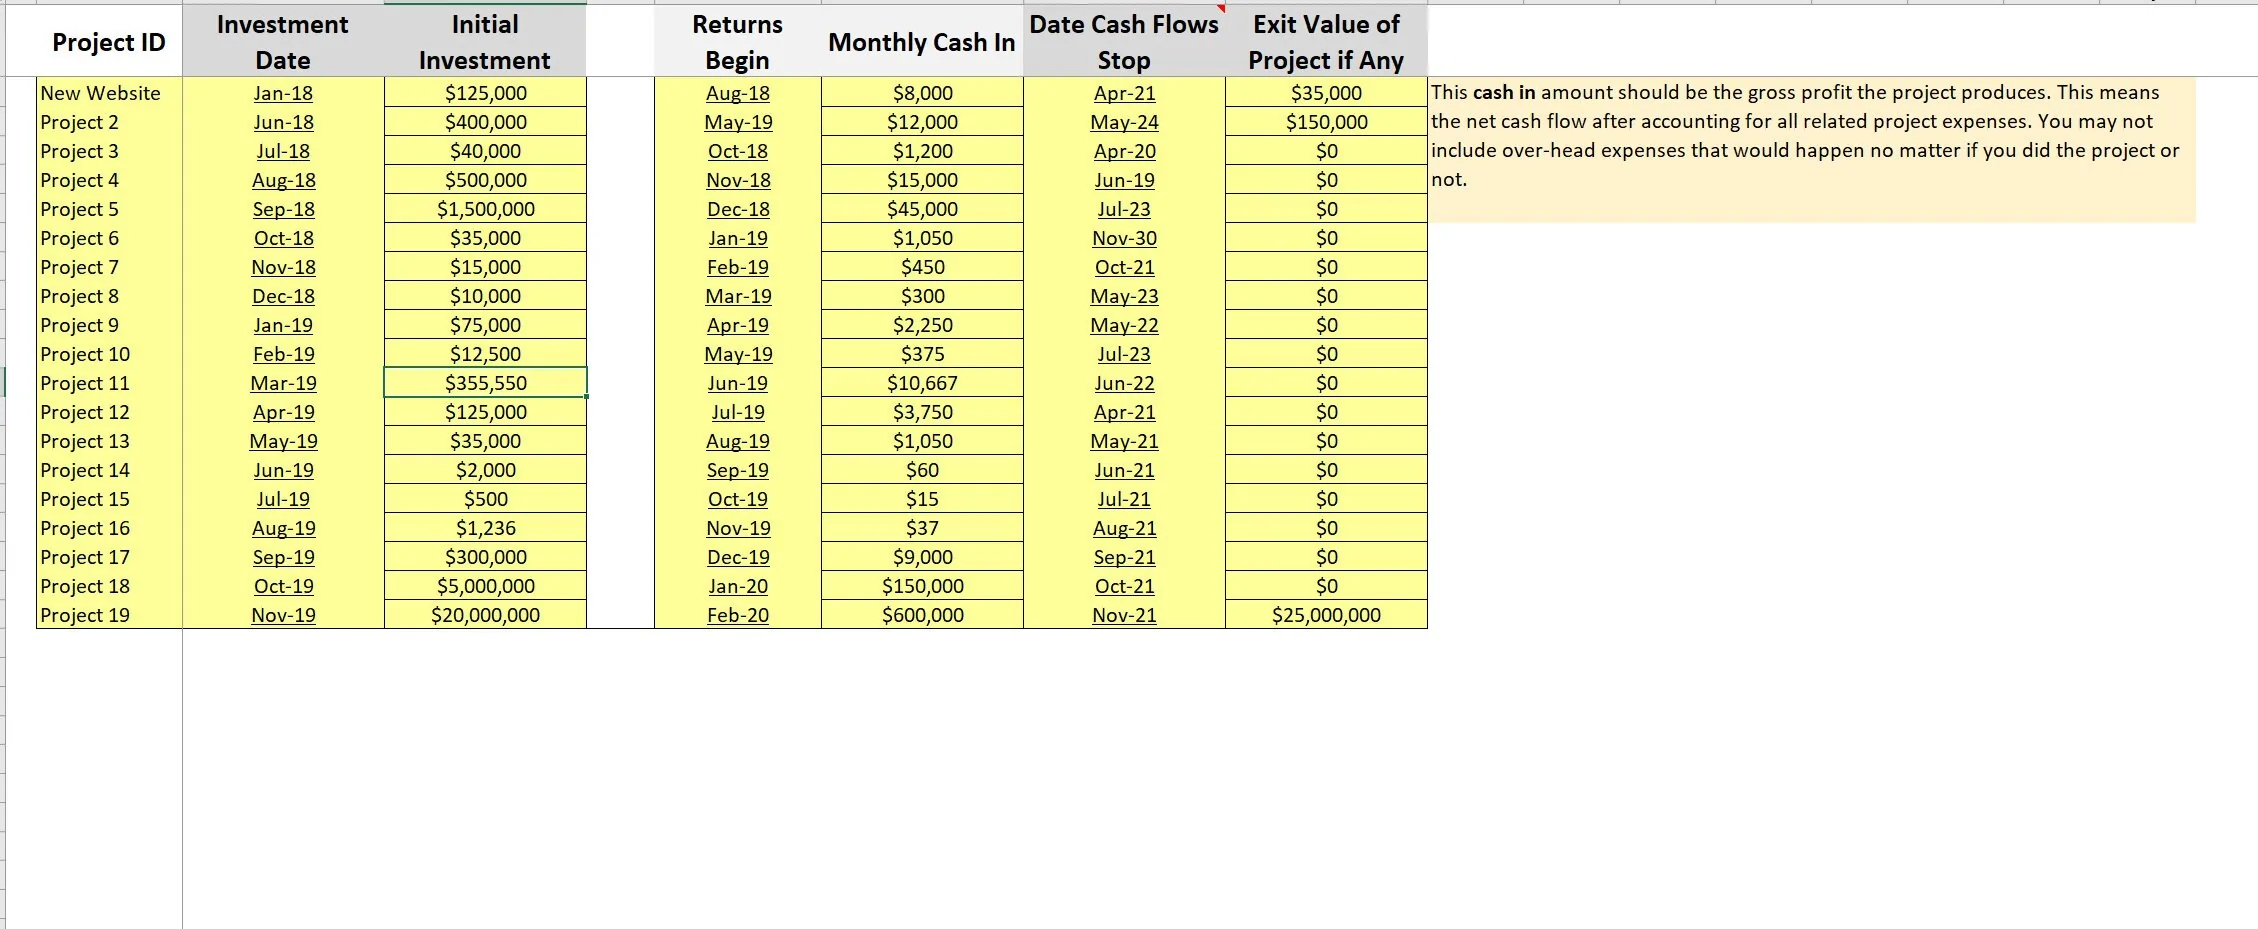
On the dashboard, the user can input the required rate of return and if the IRR is higher than that, it will turn green, otherwise red. A visual displays the results as well. The user can configure cash flows based on a start / stop month, the initial investment, monthly cash flows, exit value.

If these data structures don't fit exactly with your cash flows, simply go to the ‘monthly cash flow' tab and hard code in your expected cash inflows and outflows manually. The calculations will still run off of that.

The purpose of the ability to configure this instead of hard code in each stream is for quicker analysis of many projects.

Finally, if these are all independent projects, the final XIRR calculation will display the consolidated IRR for all projects on the same timeline.

Got a question about the product? Email us at support@flevy.com or ask the author directly by using the "Ask the Author a Question" form. If you cannot view the preview above this document description, go here to view the large preview instead.

Source: Best Practices in Business Case Development Excel: Investment Analysis: IRR Comparison Tool Excel (XLSX) Spreadsheet, Jason Varner | SmartHelping


$45.00
This valuation model was crafted by a Financial Modeler and Accountant with over 10+ years of global experience. He has served 750+ clients, from small family offices to billion-dollar corporations, across a multitude of industries.
Add to Cart
  

OVERVIEW

File Type: Excel xlsx (XLSX)
File Size: 362 KB

ABOUT THE AUTHOR

Additional documents from author: 157

I graduated in 2011 with a Bachelors degree in Accounting. From there, I worked at a few small businesses doing financial reporting and some bookkeeping. After a few years of that, I started doing freelance financial consulting work on Elance and Upwork.

After over 400 jobs completed with a 100% success rate, I now run my own modeling/consulting practice and continue to build new financial models every few weeks. [read more]

Ask the Author a Question

Must be logged in

Did you know?
The average daily rate of a McKinsey consultant is $6,625 (not including expenses). The average price of a Flevy document is $65.
Bundle and save! You can save up to % with bundles!

View bundle(s)


Trusted by over 10,000+ Client Organizations
Since 2012, we have provided best practices to over 10,000 businesses and organizations of all sizes, from startups and small businesses to the Fortune 100, in over 130 countries.
AT&T GE Cisco Intel IBM Coke Dell Toyota HP Nike Samsung Microsoft Astrazeneca JP Morgan KPMG Walgreens Walmart 3M Kaiser Oracle SAP Google E&Y Volvo Bosch Merck Fedex Shell Amgen Eli Lilly Roche AIG Abbott Amazon PwC T-Mobile Broadcom Bayer Pearson Titleist ConEd Pfizer NTT Data Schwab


Read Customer Testimonials


Save with Bundles

This document is available as part of the following discounted bundle(s):


Customers Also Bought These Documents

Document Bundle
$370.00 Bundle of 9 Documents


Customers Also Like These Documents

Related Management Topics


Business Case Development Business Case Example Costing Strategy Development Strategic Planning PowerPoint Diagrams Compilation Porter's Five Forces Growth Strategy Financial Modeling Employee Training Change Management IT Benefits Management Financial Analysis

Download our FREE Strategy & Transformation Framework Templates

Download our free compilation of 50+ Strategy & Transformation slides and templates. Frameworks include McKinsey 7-S Strategy Model, Balanced Scorecard, Disruptive Innovation, BCG Experience Curve, and many more.