Want FREE Templates on Digital Transformation? Download our FREE compilation of 50+ slides. This is an exclusive promotion being run on LinkedIn.

DCF Analysis with Sensitivity Tables   Excel template (XLSX)
$45.00

DCF Analysis with Sensitivity Tables (Excel template (XLSX)) Preview Image DCF Analysis with Sensitivity Tables (Excel template (XLSX)) Preview Image DCF Analysis with Sensitivity Tables (Excel template (XLSX)) Preview Image DCF Analysis with Sensitivity Tables (Excel template (XLSX)) Preview Image DCF Analysis with Sensitivity Tables (Excel template (XLSX)) Preview Image
Arrow   Unlock all preview images:   Login Register

DCF Analysis with Sensitivity Tables (Excel XLSX)

File Type: Excel template (XLSX)

$45.00
This valuation model was crafted by a Financial Modeler and Accountant with over 10+ years of global experience. He has served 750+ clients, from small family offices to billion-dollar corporations, across a multitude of industries.
Add to Cart


BUY WITH CONFIDENCE

Immediate digital download upon purchase.
Lifetime document updates included with purchase.
Fully editable & customizable XLSX document.
Trusted by over 10,000+ organizations.

DESCRIPTION

This product (DCF Analysis with Sensitivity Tables) is an Excel template (XLSX), which you can download immediately upon purchase.

One of the oldest and most reliable way to value something is coming up with the present value of all future cash flows that the item will produce.

DCF Analysis templates are very useful for those trying to figure out the present value of future cash flows, the resulting IRR (internal rate of return) and NPV (net present value).

This template in particular does a really good job at two things:

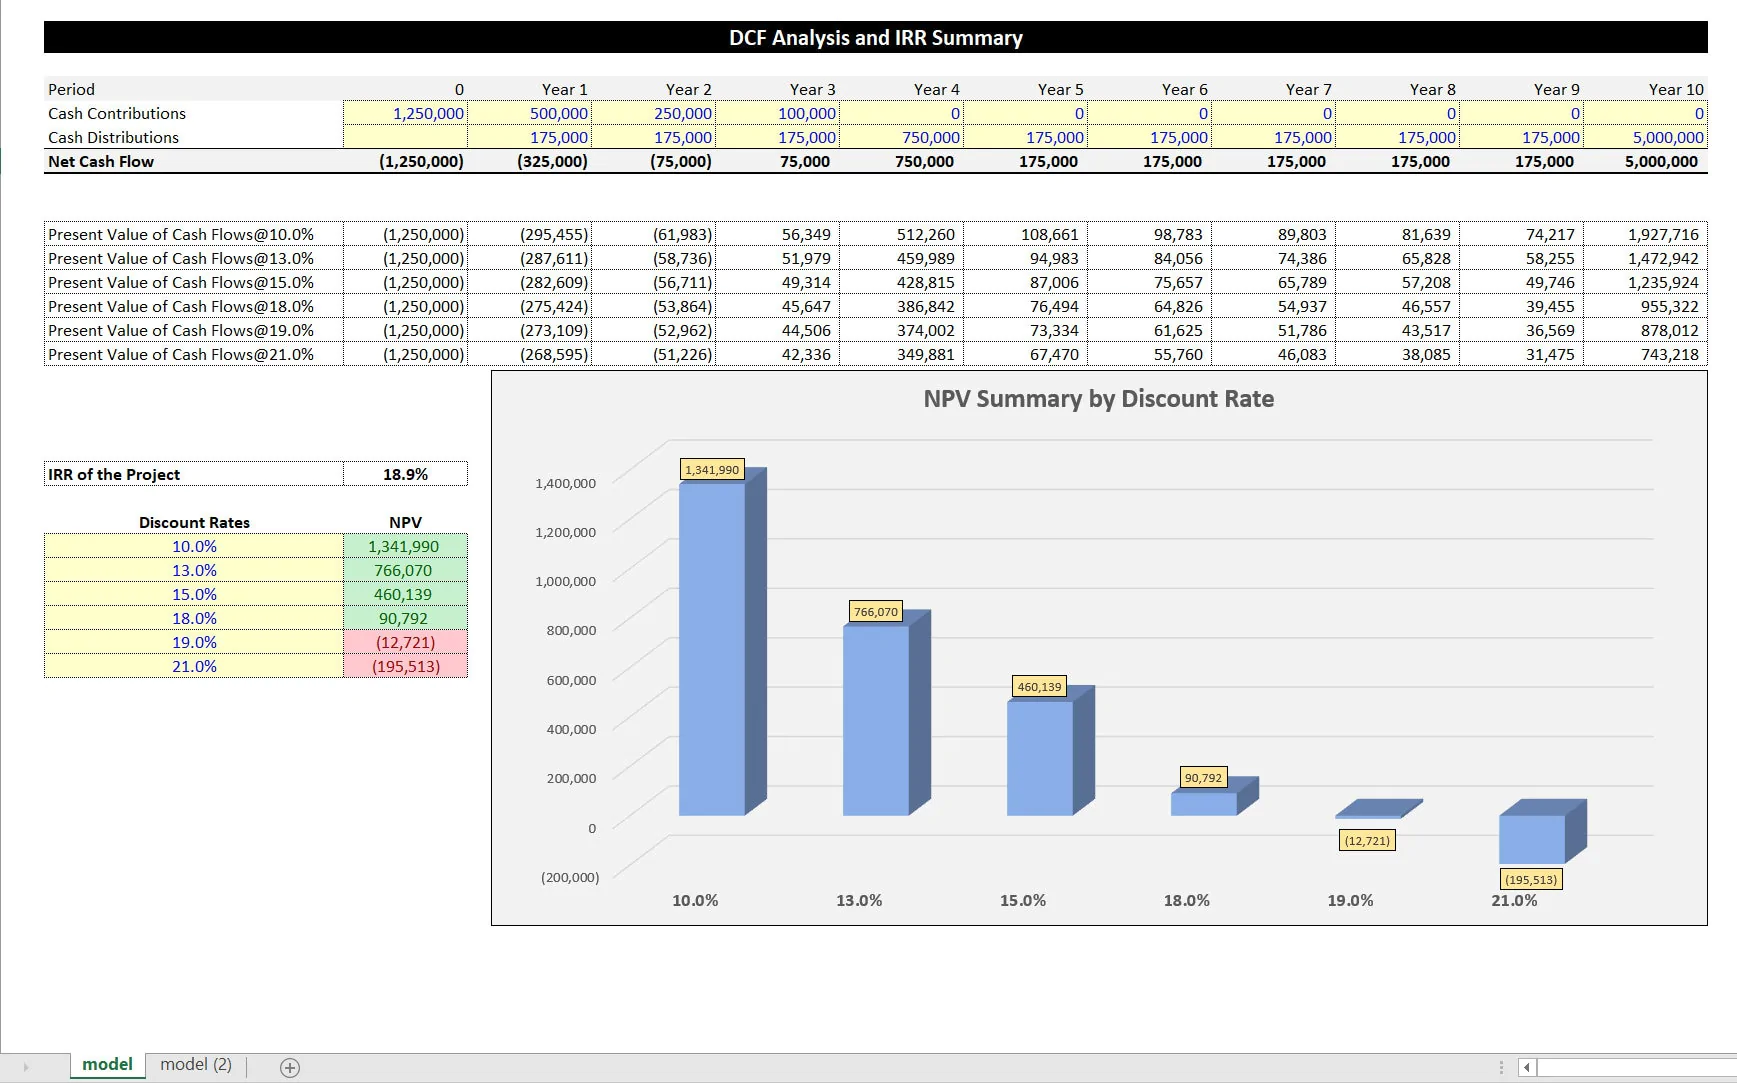
•  Providing a clean input for cash in and outflows and a NPV at up to 6 different discount rates.
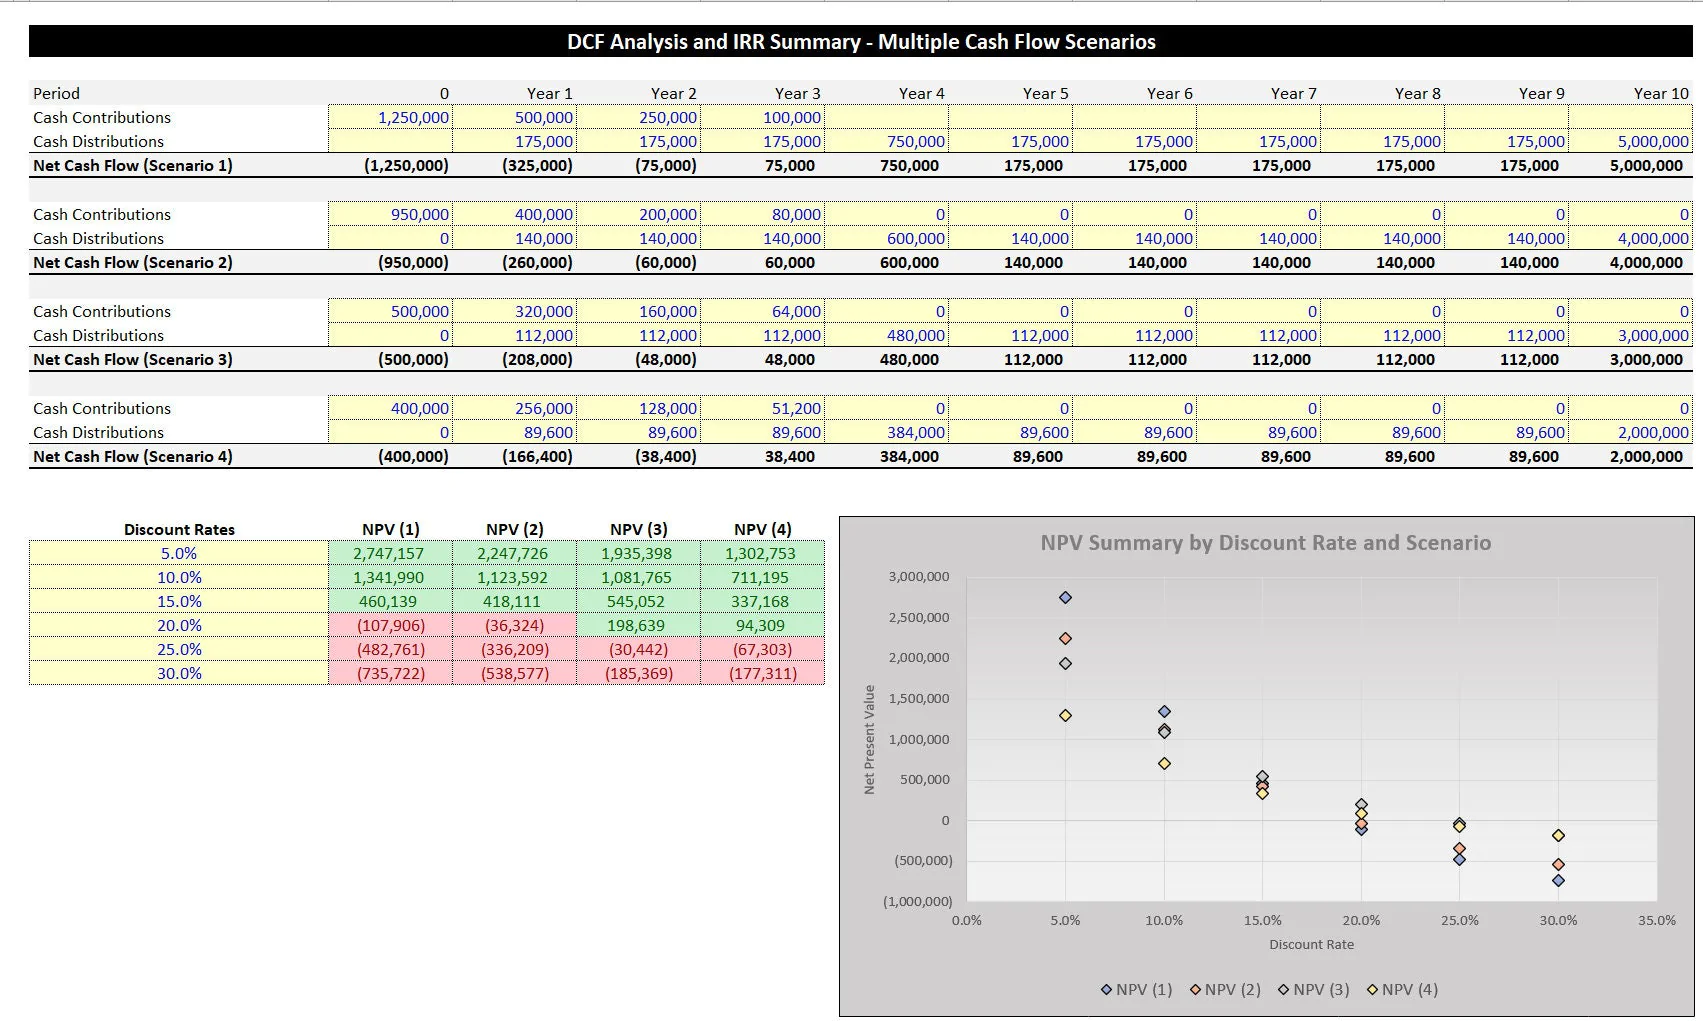
•  Provides a second input tab that allows for up to 4 different cash in and outflows and a NPV for each of those at 6 different discount rates (24 total NPVs) for better context and comparison analysis.

The flows could be the same project with different scenarios or different projects that need to be compared side-by-side. The user can input the range of discount rates. The visualization on the first tab will display a 3D bar chart for each of the 6 NPVs for the single cash flow stream.

The visualization on the second tab will be a diamond plot chart that shows all 24 NPVs at the various discount rates for each of the 4 scenarios.

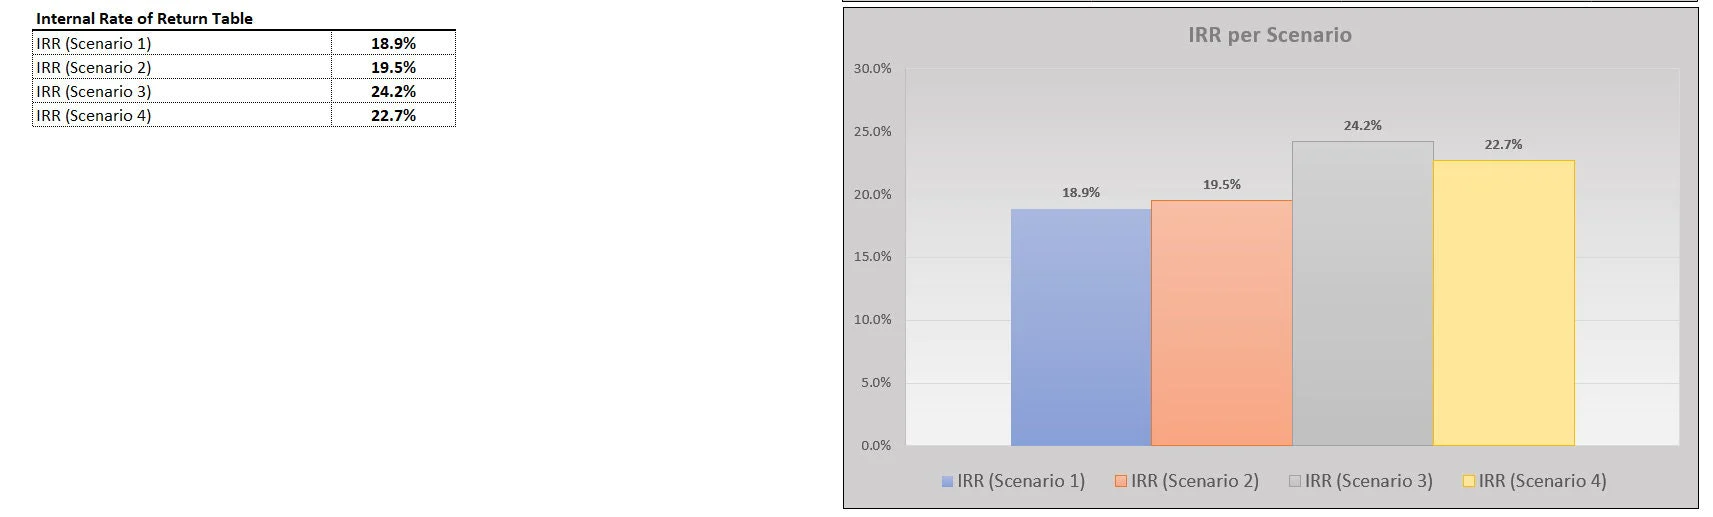
There is an additional visual on the second tab that also shows the IRR for each of the 4 cash flow streams. There are up to 10 periods for entry and will most commonly be used for annual cash flows.

If you want to show the values based on monthly cash flows, the formulas would need to be extended accordingly, but it wouldn't be overly complex to make this modification if needed. There is a Google Sheet version included in this as well.

The link is on the first model tab and if you want to use that, go through the link and then hit File > Make a Copy for your own editable sheet.

Got a question about the product? Email us at support@flevy.com or ask the author directly by using the "Ask the Author a Question" form. If you cannot view the preview above this document description, go here to view the large preview instead.

Source: Best Practices in Valuation Excel: DCF Analysis with Sensitivity Tables Excel (XLSX) Spreadsheet, Jason Varner | SmartHelping


$45.00
This valuation model was crafted by a Financial Modeler and Accountant with over 10+ years of global experience. He has served 750+ clients, from small family offices to billion-dollar corporations, across a multitude of industries.
Add to Cart
  

OVERVIEW

File Type: Excel xlsx (XLSX)
File Size: 37.4 KB

ABOUT THE AUTHOR

Additional documents from author: 156

I graduated in 2011 with a Bachelors degree in Accounting. From there, I worked at a few small businesses doing financial reporting and some bookkeeping. After a few years of that, I started doing freelance financial consulting work on Elance and Upwork.

After over 400 jobs completed with a 100% success rate, I now run my own modeling/consulting practice and continue to build new financial models every few weeks. [read more]

Ask the Author a Question

Must be logged in

Did you know?
The average daily rate of a McKinsey consultant is $6,625 (not including expenses). The average price of a Flevy document is $65.
Bundle and save! You can save up to % with bundles!

View bundle(s)


Trusted by over 10,000+ Client Organizations
Since 2012, we have provided best practices to over 10,000 businesses and organizations of all sizes, from startups and small businesses to the Fortune 100, in over 130 countries.
AT&T GE Cisco Intel IBM Coke Dell Toyota HP Nike Samsung Microsoft Astrazeneca JP Morgan KPMG Walgreens Walmart 3M Kaiser Oracle SAP Google E&Y Volvo Bosch Merck Fedex Shell Amgen Eli Lilly Roche AIG Abbott Amazon PwC T-Mobile Broadcom Bayer Pearson Titleist ConEd Pfizer NTT Data Schwab


Read Customer Testimonials


Save with Bundles

This document is available as part of the following discounted bundle(s):


Customers Also Like These Documents

Related Management Topics


Valuation M&A (Mergers & Acquisitions) Valuation Model Example Loans Venture Capital Change Management Due Diligence Integrated Financial Model

Download our FREE Strategy & Transformation Framework Templates

Download our free compilation of 50+ Strategy & Transformation slides and templates. Frameworks include McKinsey 7-S, Balanced Scorecard, Disruptive Innovation, BCG Curve, and many more.