Editor's Note: Take a look at our featured best practice, Landed Cost Calculator for USA Imports (Excel workbook). This landed cost calculator is an advanced Microsoft Excel ? spreadsheet that can be used to calculate the total landed cost of importing goods into the USA
No need to waste time reinventing the wheel this spreadsheet has evolved from many years of practical use and ongoing development by a [read more]
* * * *
Aluminum cans still package 78 percent of U.S. craft beer sold off-premise, according to the Brewers Association. But every uptick in the Midwest Premium, or a fresh round of tariff chatter, shaves margin. New digital printers now make short runs painless, leaving you with five suppliers, a dozen dielines, and pallets of slow-moving stock. Cash stalls in packaging instead of fueling the next brew. The quickest fix is to centralize specifications and eliminate duplicate components before you renegotiate contracts or freight. Do that, and you slash inventory and changeovers without sacrificing a single beer. Here’s the four-step playbook.
What “Packaging Consolidation” Really Means
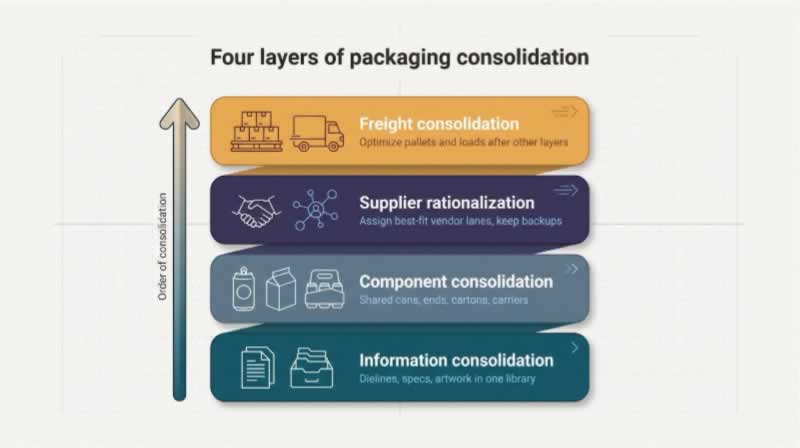
Packaging consolidation reduces hidden variety in your catalog so money and line time stop leaking. In practice, it unfolds across four layers that move at different speeds:
Information consolidation. Gather every dieline, material spec, and artwork file in one living library; stop rummaging through shared drives.
Component consolidation. Retire duplicate can bodies, ends, cartons, and carriers so several beers share the same parts.
Supplier rationalization. After parts are standardized, decide which vendors earn more volume, and where a backup still guards resilience.
Freight consolidation. Place multiple SKUs on the same pallet, truck, or container only after the first three layers are steady; otherwise, “savings” vanish in delays and swelling inventory.
Know exactly which layer you are tackling. When steps blur, the savings disappear.
The Five Fastest Paths, Ranked
The quickest wins sit at the top of the list; slower, higher-risk moves drop toward the bottom.
Rank
First big benefit
Works best when…
Watch-out
1. Build a unified specification library
Instant visibility of duplicate parts
Specs live in email threads and shared drives
Needs one owner to stay current
2. Standardize shared components
Smaller MOQs, faster changeovers
Multiple SKUs share can sizes or carriers
Retailers may lock case dimensions
3. Centralize artwork in a digital hub
Fewer approval loops, fewer misprints
Several agencies touch files
Discipline slips without clear roles
4. Give each vendor the right lane
Fewer POs, stronger service levels
Categories differ in volume and volatility
Over-consolidation increases supply risk
5. Squeeze freight last, with eyes open
Lower landed cost per case
Demand is stable enough to fill loads
Mixed pallets can balloon inventory
Path 1: Build a Unified Specification Library First
Picture every dieline, material spec, and artwork file living in a single, searchable home. McKinsey estimates that knowledge workers lose about 19 percent of their week just hunting for documents, time that disappears once a library turns searching into clicking.
Centralizing specs pays off. Duplicate 16-ounce can bodies or near-identical four-pack cartons surface in minutes, not at 2 a.m. during a change-over.
Approval rounds shrink because every stakeholder sees the latest file, not a rogue PDF.
Weight and material data sit next to the dieline, ready for looming EPR reports.
Zenpack calls this a unified packaging system: one architecture that governs structure, materials, and print rules across every SKU.
No tooling swaps. No supplier break-ups. Clean data powers every other consolidation step.
Path 2: Standardize the Physical Parts
With the spec library live, the quickest cash win is to retire “near-miss” parts. Three 16-ounce can bodies become one, and two four-pack cartons that differ by 6 mm merge into a single dieline.
Fewer unique components deliver three immediate payoffs:
Lower MOQs. One universal can body pulls demand across flavors, so orders hit price breaks without ballooning inventory.
Smoother line rhythm. Operators stop swapping carriers every flavor; muscle memory stays consistent and defects fall.
Freed floor space. A dozen core parts replace forty, opening pallet positions for finished beer instead of empty cartons.
Fillers, seamers, and tooling stay the same. You change what you buy, not how you fill. Savings appear in the next inventory cycle: a tighter catalog, the same shelf variety, and less cash on the floor.
Path 3: Put Artwork and Approvals in One Digital Hub
Files stop bouncing between designers and printers. Esko’s 2025 packaging trends research found that 89 percent of packaging artworks go through up to five review rounds, and only 17 percent of teams use dedicated artwork-management software; a cloud hub cuts the rounds to one or two. Compliance data, such as material weight and recycled content, travels with the file for easy EPR reporting.
What changes when the hub goes live?
Stakeholders see the latest art and color targets, so approval loops drop from five rounds to two.
Material weights and recycled-content data stay linked to the file, ready for EPR reports or last-minute export labels.
Printers download one package (dieline, color specs, QC checklist), so deviations surface before a truck leaves the dock.
No extra head count, just clarity. That clarity moves SKUs off the computer and onto the line.
Path 4: Give Each Vendor the Right Lane
Vendor rationalization means assigning the best-fit supplier to each packaging category without over-relying on one partner. After parts are standardized, overlap becomes obvious:
Printed cans often suit a national converter that can lock in plate pricing.
Labels and sleeves favor a regional digital printer that can turn volatile seasonals in days, not weeks.
Carriers and corrugated reward a high-volume generalist that can manage warehousing and just-in-time release.
The gain comes from giving every partner a clear lane, not from funneling everything through one warehouse.
Score each candidate on five weighted factors: landed cost, MOQ flexibility, lead-time reliability, quality record, and contingency capacity. Award lanes accordingly. One vendor may lead on cartons yet place fourth on labels, and that is fine; you are building a balanced portfolio, not choosing exclusivity.
Result: fewer purchase orders, simpler freight planning, and stronger service agreements without creating a single-point failure.
Path 5: Squeeze Freight Last, and with Eyes Open
Mixed pallets may look free, yet every load moves at the speed of the slowest SKU. When several suppliers feed one container, the slowest one sets the sailing date; without strict cutoffs, one late supplier drags the whole inventory plan with it. Run cube math only after demand, specs, and vendors align; otherwise, you trade freight savings for six extra weeks of inventory.
Get the order right, and freight becomes the cherry on top, not the anchor at the bottom of the tank.
The 48-hour Catalog Audit
A catalog audit is a two-day sprint that maps every packaging component to the beers that rely on it, then ranks the worst cash drains first.
Day 1: Freeze and Download
Pause any new cartons or sleeves until the data is clean. Export 12 months of purchase and production history for every can body, end, label roll, carton, and carrier. Tag each row with dimensions, supplier, annual volume, lead time, on-hand cases, unit cost, and any write-offs.
Day 2: Visualize and Score
Clean the sheet, then sketch a simple flow: forty saleable SKUs narrowing to a dozen shared parts. The picture sparks questions: Why does one saison need a unique four-pack? Why do two hazies use near-identical 16-ounce cans from different mills? End by flagging the highest-cost overlaps.
With those numbers on one page, leadership sees data, not anecdotes, and knows which parts to target first.
Forty-eight hours, one spreadsheet, and a clear path that can free six figures in working capital. That is speed worth toasting.
Turn Red Ink into a Packaging Friction Score
A best-seller can still bleed margin if its packaging burns time and space. A friction score makes that pain visible, component by component.
Step 1: Choose Six Drivers
Factor
Why it hurts
Data point
Forecast error
Mispicks and write-offs
% variance vs. rolling 6-mo. forecast
MOQ vs. annual demand
Ties up cash
Order qty ÷ annual use
Warehouse cube
Rent and handling
Pallet positions × $/pallet-month
Change-over minutes
Lost beer
Avg. minutes/run
Artwork touches
Delay and plate fees
Review rounds/file
Defects/expedites
Direct cost
$ scrapped or rushed
Step 2: Score 1–5 for each field (5 = worst), then add or weight as you prefer. L.E.K.’s 2023–24 packaging study shows companies gain 65–90 basis points of gross margin soon after reducing SKU count, as volume shifts to the core portfolio. A flagship printed can that runs daily may score 6, while a limited milk stout with a custom carrier could hit 20. Redesign the top three offenders and you usually free hours of line time and several pallet positions without touching the best-seller list.
Data, not debate, guides the next cuts.
One Catalog, Four Behaviors: Segment by Volume and Volatility
Segmenting SKUs by annual volume and forecast volatility lets you match each beer to the lowest-cost, reliable packaging path.
Quadrant
Typical SKU
Packaging play
Why it wins
High volume / Low volatility
Year-round IPA
Conventional printed cans + dedicated cartons
Tight forecast supports long print runs; pallet turns stay high
Define “high” and “low” in your own context. Many craft brewers treat more than 100,000 cans a year as high volume and above 30 percent forecast error as high volatility. Use your numbers, then choose the path that protects cash without curbing creativity.
Treat Primary, Secondary, and Tertiary Packaging as Three Separate Levers
A packaging catalog has three linked challenges: the can or bottle itself, the multipack that groups units, and the shipper that reaches the warehouse. Address each layer on its own timetable so the savings add up instead of collide.
Primary packaging: the can body, end, and decoration consumers see. Standardize essentials such as the 202 end on every 12-ounce can, then vary graphics with print, label, or sleeve.
Secondary packaging: four-pack carriers, six-pack cartons, trays, wrap. Aim for one carrier footprint that fits every 16-ounce SKU. A small dieline tweak costs pennies compared with a case-former changeover that steals minutes each run.
Tertiary packaging: the shipper, pallet pattern, and stretch film that protect margin. Refining pallet patterns and standardizing box sizes raises cube utilization, a metric where 22 to 27 percent counts as optimal for a typical warehouse once aisles and handling space are counted, according to pallet pooler iGPS.
Validate each change on the line. An ultra-light tray that scuffs labels at 300 cans per minute is not a win. When every layer clicks, seam parts drop, carrier swaps speed up, and freight costs fall without renegotiating a single can contract.
Centralize Artwork, Dielines, and Compliance Data
Centralizing packaging assets means storing every master dieline, artwork file, and regulatory panel in one governed system instead of scattered email threads.
Why it matters: Esko’s 2025 packaging trends research found that 89 percent of packaging artworks endure up to five approval rounds, and only 17 percent of teams use dedicated artwork-management software. Those delays fade when everyone works in the same hub.
What a single source delivers
Faster approvals. With one live file, review loops shrink and plate burns stop waiting on the wrong version.
Locked color and legal copy. One master file feeds every printer, and revisions reach purchasing and suppliers instantly.
Built-in compliance. Material weight, recycled content, and market-specific warnings sit beside the art, ready for California SB 54 or EU PPWR reports.
Suppliers benefit, too. They download one package containing the dieline, color targets, and QC checklist, so deviations surface before a truck leaves the dock. This matters because about 35 to 40 percent of product recalls link back to label and artwork errors, many of them born in manual processes, according to Esko.
A few hours of upfront tagging save months of future firefighting and free creative energy.
Source the Whole Portfolio, Not One Lonely SKU
Portfolio sourcing means quoting every can, carrier, and seasonal burst in the same RFQ so suppliers price the full year, not a single label.
Bundle core cans, seasonals, and variety-pack cartons into one bid. Plate charges on the flagship pale ale then offset low-MOQ digital cans for the pilot sour, and the vendor gains predictable throughput.
Build your RFQ around real life: total annual volume, release cadence, forecast flex, storage needs, and the mix of digital and conventional print. Then score vendors on landed cost, MOQ freedom, lead-time reliability, quality record, and contingency capacity. One printer may lead on conventional runs while trailing on digital; give each the lane they excel in and keep a backup for volatility.
Negotiate volume tiers that aggregate across SKUs (for example, 500 k, 1 million, 2 million units) rather than per design. Ask for inventory programs that release by forecast, not truckload lump sums, so cash stays in tanks instead of cartons.
Treat packaging like an investment portfolio: diversify where risk hides, consolidate where scale pays, and push every partner to price the life of the catalog, not a narrow slice of it.
Calculate Total Cost, Then Watch Quotes Shrink
Total cost of packaging = unit price + inbound freight + warehouse space + change-over labor + scrap + expedite fees. Once you tally every line, the four-cent “cheaper” can often costs more on the dock.
Commonly cited industry benchmarks put inventory carrying costs, including storage, insurance, and obsolescence, at 20 to 30 percent of total inventory value each year, pushing real packaging expense far above the invoice price. Capture the pennies you normally ignore:
Inbound freight and fuel surcharges
Pallet rent at $12–$18 per slot per month
Plate, artwork, and setup fees spread across the run
Run the math. A universal carrier that is two cents costlier yet saves 10 minutes per run can bottle an extra 2,000 cases a month on a 250-cpm line, worth more than the price delta.
Storage tells the same story: standardizing to five corrugated box SKUs can improve slotting, cut dimensional weight, and accelerate pick-pack speed, freeing substantial warehousing and freight capacity.
When teams model full TCO, disputes over fractions of a cent fade, and suppliers sharpen quotes because they know you see every hidden fee. Total cost is the real scoreboard; keep your eye on it and the savings stay.
Prove It on Ten SKUs before You Scale
A pilot on the ten highest-friction SKUs provides meaningful data without risking the entire catalog.
Week 1: baseline. Measure current line speed, change-over minutes, defects, and scrap.
Week 2: lock the spec. Engineering signs off on seams; marketing approves graphics; purchasing lines up at least two qualified suppliers per component.
Week 3: cost model. Quote the new parts, model inventory draw-down, and compare full TCO with the baseline. Set a green-light target such as ≥10 percent cost drop or ≥20 percent line-time gain.
Week 4: production run. Run at least one full shift, pull QA samples, and ship to real shelves. Gather distributor feedback on stackability and handling.
At day 60, review the scorecard: pallets consumed, hours saved, cost delta, and any customer issues. If you meet the green-light targets, move to the next ten SKUs; if not, adjust specs or supplier mix and repeat.
A ten-SKU slice is large enough to reveal every pinch point yet small enough to correct without writing off cartons. Complete the pilot, and scaling becomes execution, not guesswork.
When Consolidation Backfires
Consolidation fails whenever a cost cut creates new risk that outweighs the savings. Watch for three common traps:
Retailer-specific packaging. A chain buyer may demand its own case dimensions or barcode. Ship a “universal” carton without pre-approval and you face charge-backs plus return freight.
Single-source critical parts. Section 232 tariffs added can ends and lids in 2025; breweries that dropped backup suppliers found a lid shortage can idle a filler in hours.
Performance trade-offs. A lighter carton that flexes on the packer can cut line speed by a third. The cheaper carton then costs more in overtime than it saved on paper.
Mitigate by stress-testing every spec: retailer needs, tariff exposure, line mechanics, and market labels. Keep at least one qualified second source for ends, lids, and printed cans. Consolidation should cut cost, not add risk.
Match the Fix to the Pain
Consolidation is a toolkit, not a single hammer. Pick the tool that solves today’s problem:
Messy specs and rogue colors? Call a packaging-system integrator to audit dielines and build a governed library.
Endless artwork approvals? A cloud artwork hub or PLM platform trims review rounds from five to two once it pipes material weights and UPCs straight into the ERP.
In-box overflowing with POs? A distributor or category manager can bundle repeat components and release inventory by forecast, cutting the PO count on your desk.
Flashy, low-volume seasonals? Regional digital printers or sleeve converters handle sub-5k runs. Check MOQ, scuff resistance, and change-over fees before you commit.
Freight pain on light cartons? A mixed-load warehouse can compress cube, but only if lead time still meets launch dates. Model both before buying.
Chronic line downtime? Bring in a packaging engineer to trim change-overs or add accumulation; a 10-minute cut on a 250-cpm line frees roughly 2,500 cans per shift.
Start with the problem, not the label. The right lane delivers speed and savings; the wrong lane delivers meetings and excuses.
Consolidate in the Right Order
Savings stick only when you tackle knowledge, parts, partners, and freight in that exact sequence. Skip a step and the math falls apart.
Data first. A shared spec library exposes duplication in hours, not weeks.
Parts second. Standardize cans, carriers, and cases to cut MOQs, change-overs, and storage.
Partners third. Negotiate once suppliers can see true family volume, and keep a backup for resilience.
Freight last. Mixed loads pay off only after demand, specs, and vendors align.
Data ➜ parts ➜ partners ➜ pallets. Follow the rhythm and the savings stay on the P&L; scramble the order and they disappear.
Conclusion
Packaging consolidation is fastest when you put data first, then standardize parts, align suppliers, and finally optimize freight. Centralizing knowledge uncovers duplication, shared components slash MOQs and changeovers, and a balanced supplier mix prevents costly surprises. Execute the steps in order and the savings flow straight to the bottom line, without sacrificing a single beer.
An Industry Value Chain is a visual representation of the series of steps an organization in a specific industry takes to deliver a product or service to the market. It captures the main business functions and processes that are involved in delivering the end product or service, illustrating how [read more]
Do You Want to Implement Business Best Practices?
You can download in-depth presentations on Logistics and 100s of management topics from the FlevyPro Library. FlevyPro is trusted and utilized by 1000s of management consultants and corporate executives.
For even more best practices available on Flevy, have a look at our top 100 lists:
These best practices are of the same as those leveraged by top-tier management consulting firms, like McKinsey, BCG, Bain, and Accenture. Improve the growth and efficiency of your organization by utilizing these best practice frameworks, templates, and tools. Most were developed by seasoned executives and consultants with over 20+ years of experience.
Readers of This Article Are Interested in These Resources
This landed cost calculator is an advanced Microsoft Excel ? spreadsheet that can be used to calculate the total landed cost of importing goods into Australia
No need to waste time reinventing the wheel this spreadsheet has evolved from many years of practical use and ongoing development by a [read more]
Shortage of labor, intensified demand from e-tailers (online retailers), and technological disruption is forcing many organizations in the Logistics and Warehousing sectors to embrace technology, particularly Automation.
Automation is facilitating Warehouse operations predominantly by [read more]
Selecting a logistics service provider based on COST alone is a recipe for potential disaster.
Getting it wrong can be detrimental to your business in terms of both cost and time - especially if you need to exit the relationship as a result.
One of the most effective ways to ensure that you [read more]
An Air Freight Services Company specializes in transporting goods and cargo by air, offering fast, reliable logistics solutions for domestic and international shipments. It manages freight handling, customs clearance, warehousing, and delivery coordination to ensure efficient supply chain [read more]