
Complete Capital Optimization Guide – PowerPoint PPTX Template
PowerPoint (PPTX) + Excel (XLS) 126 Slides
BENEFITS OF THIS DOWNLOADABLE POWERPOINT DOCUMENT
- Provide a framework for developing a Capital Scrubbing and Optimization Strategy
COST REDUCTION ASSESSMENT PPT TEMPLATE DESCRIPTION
It's no secret that cost overruns and delays run rampant in large capital projects. But a lack of internal discipline, in both the proposal and management stages of a project, further raises costs—both of individual projects and entire portfolios of investment. According to McKinsey & Company, the capital expenditure spend category typically receives insufficient management attention or control, causing inefficient capital allocation and poorly prioritized project portfolios.
Effective capital planning decisions can lead to significant competitive advantages. Capital optimization can lower wasted resources on unnecessary projects and lead to improved profitability.
Companies across the world are already looking for methods and techniques to improve their current processes.
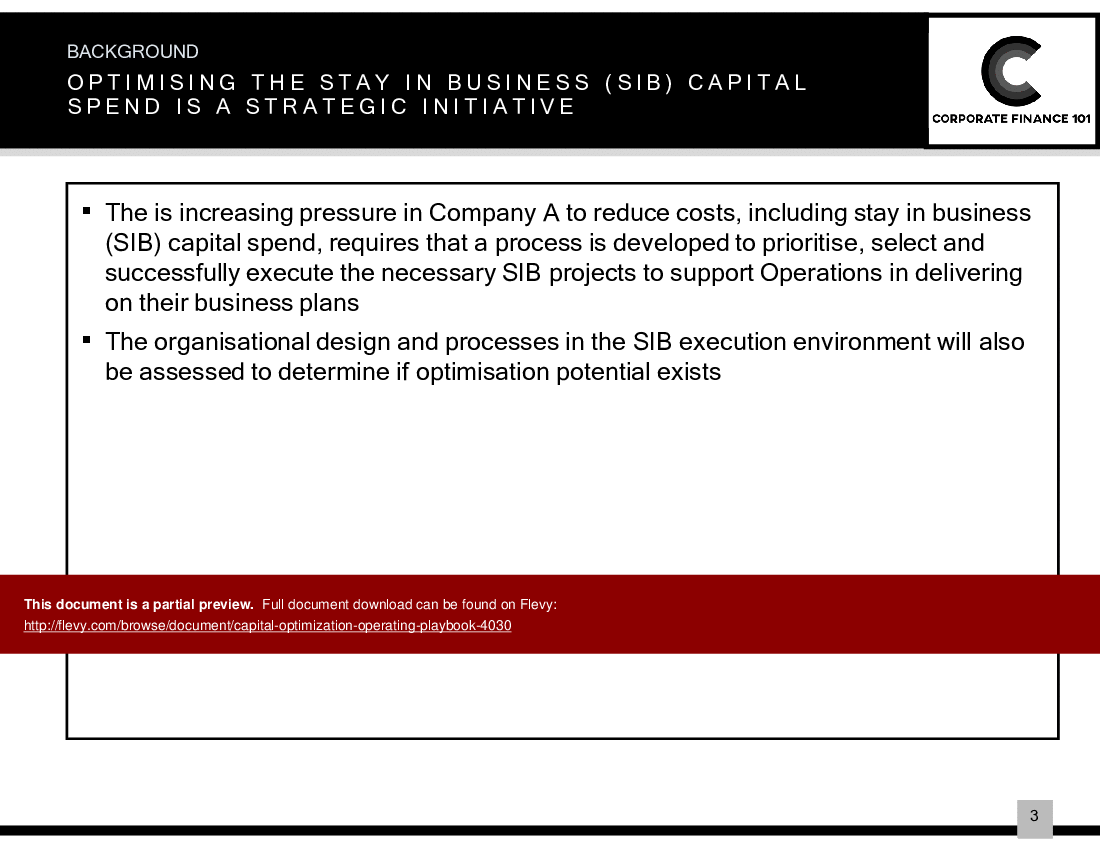
There is increasing pressure in companies to reduce costs, through capital optimization initiatives including stay-in-business (SIB) capital spend. It requires that a process is developed to prioritize, select, and successfully execute the necessary SIB projects to support operations in delivering on their business plans.
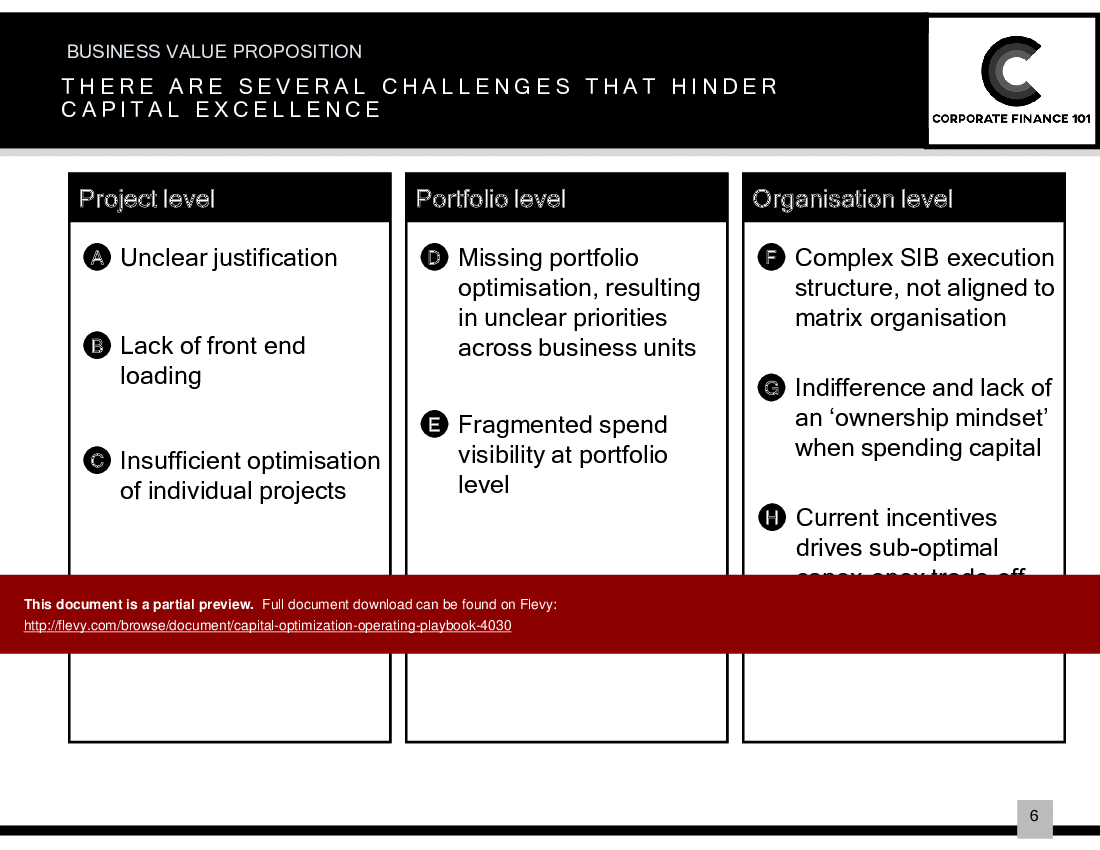
The design and processes playbook is developed in accordance with the methodology of a top-tier consulting firm in the SIB execution environment and will assist in assessing if capital optimization potential exists.
It covers the following sections:
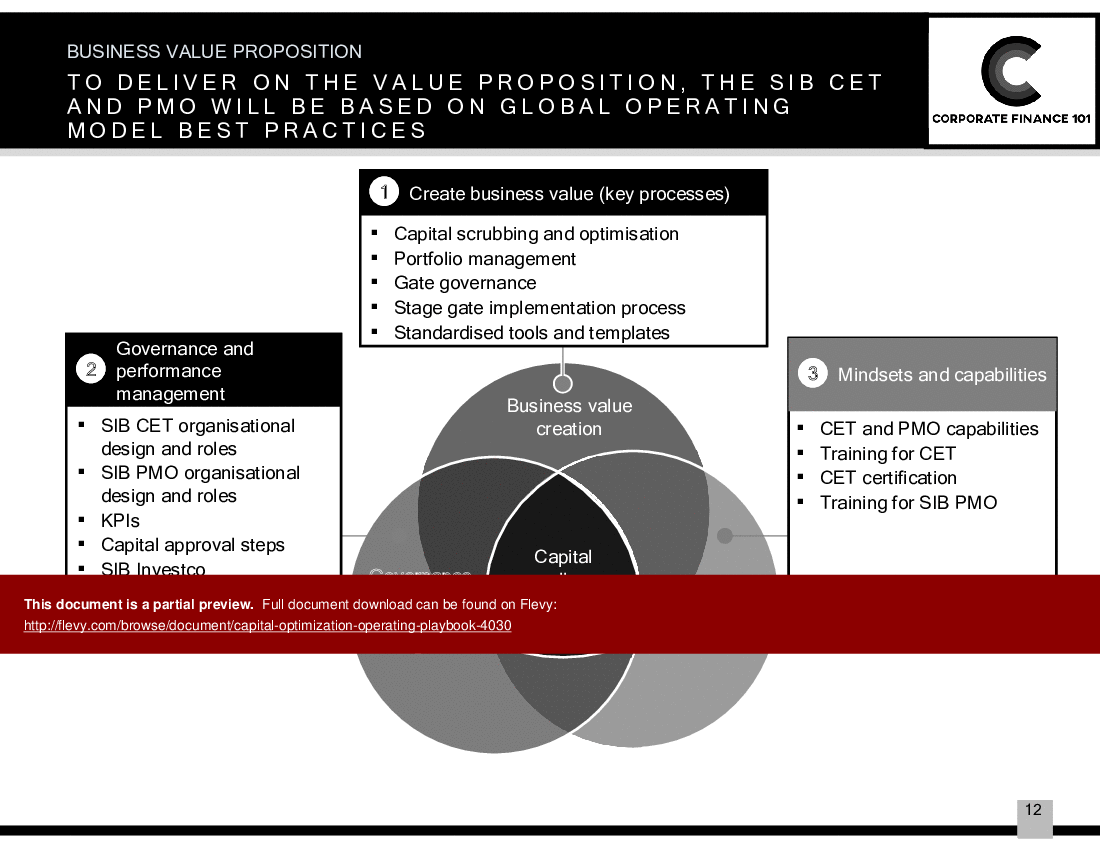
1. Business Value Proposition
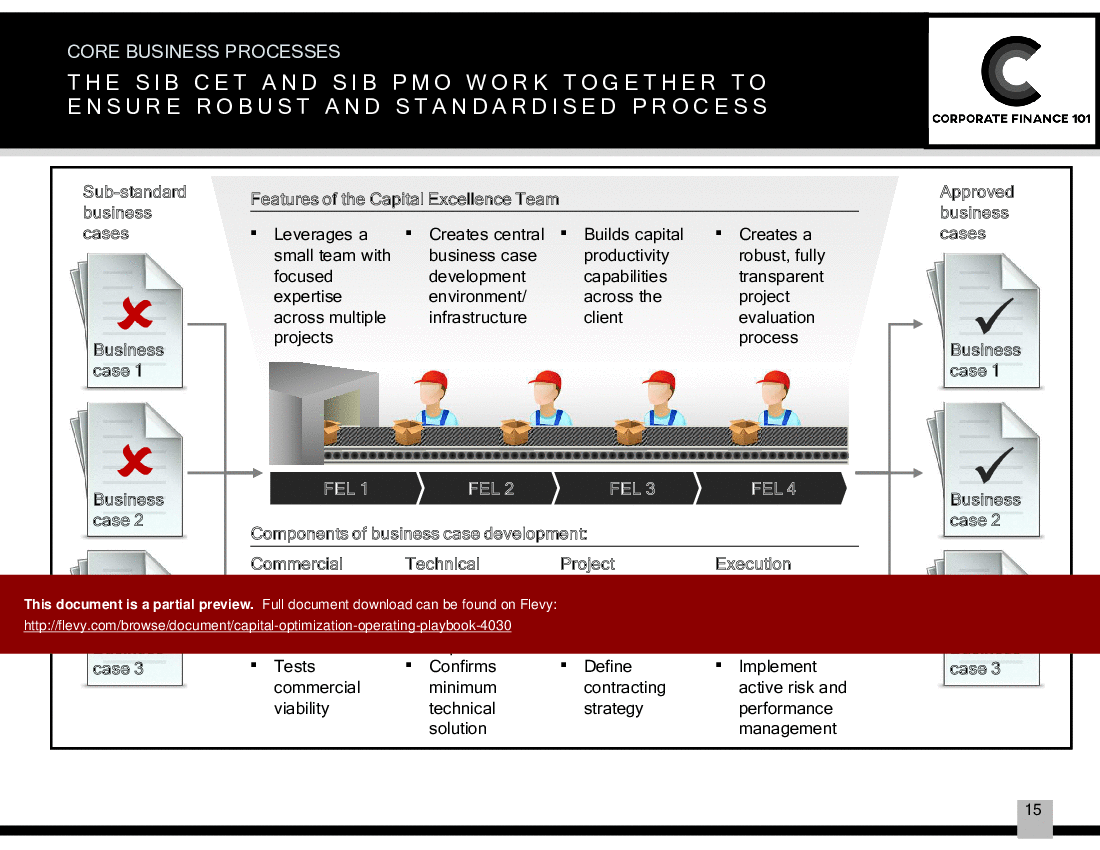
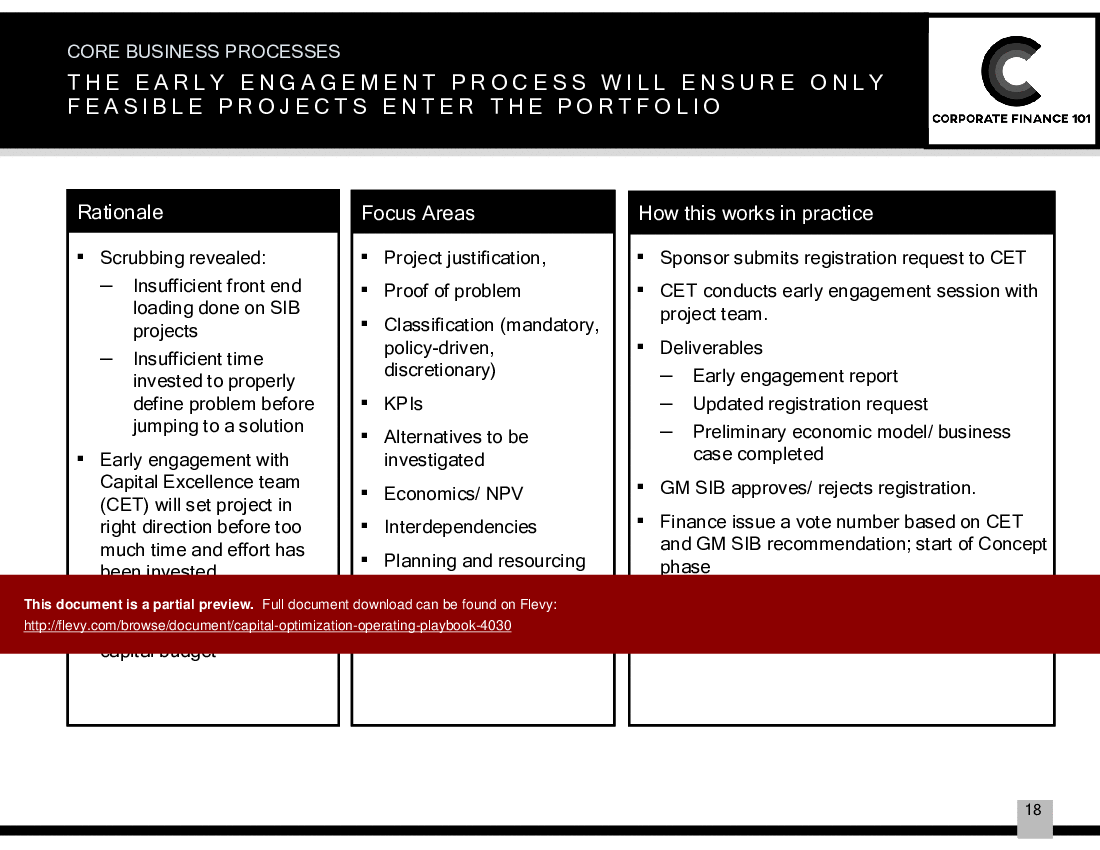
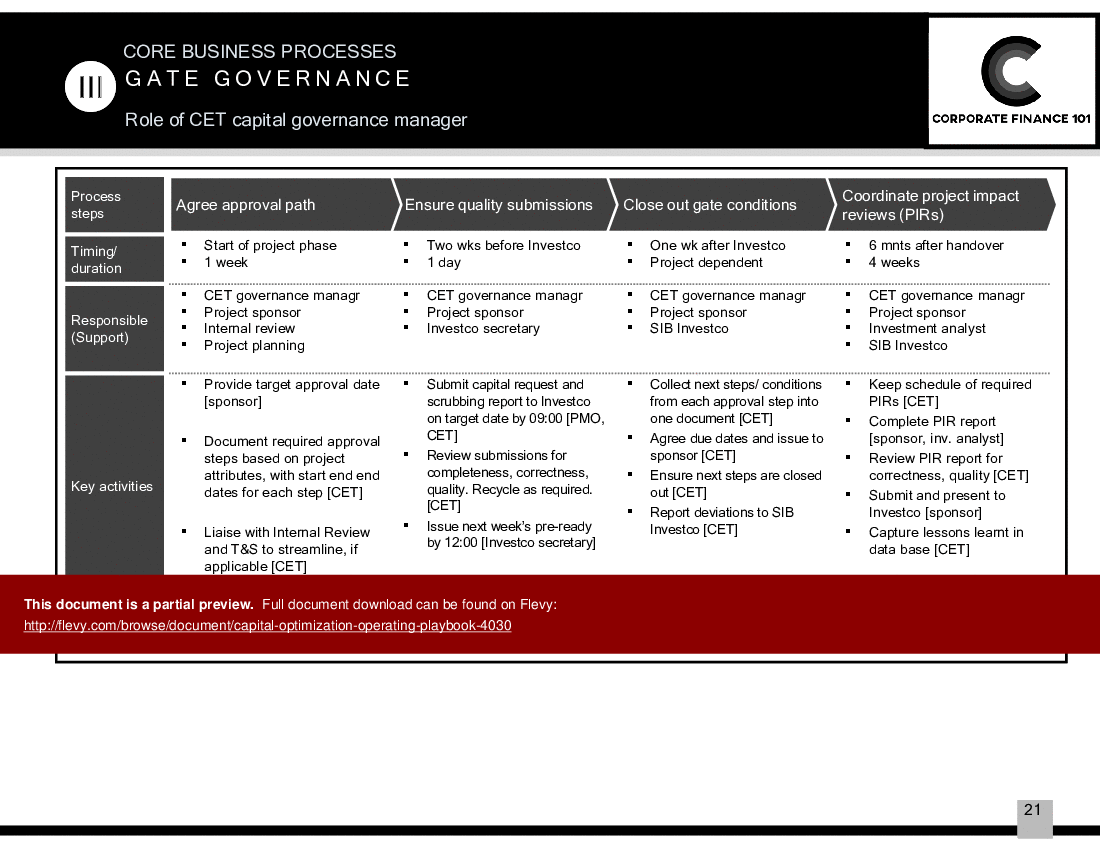
2. Core Business Processes
3. Governance and Performance structures (which includes but is not limited to organization design)
4. Change management
5. Implementation Roadmap
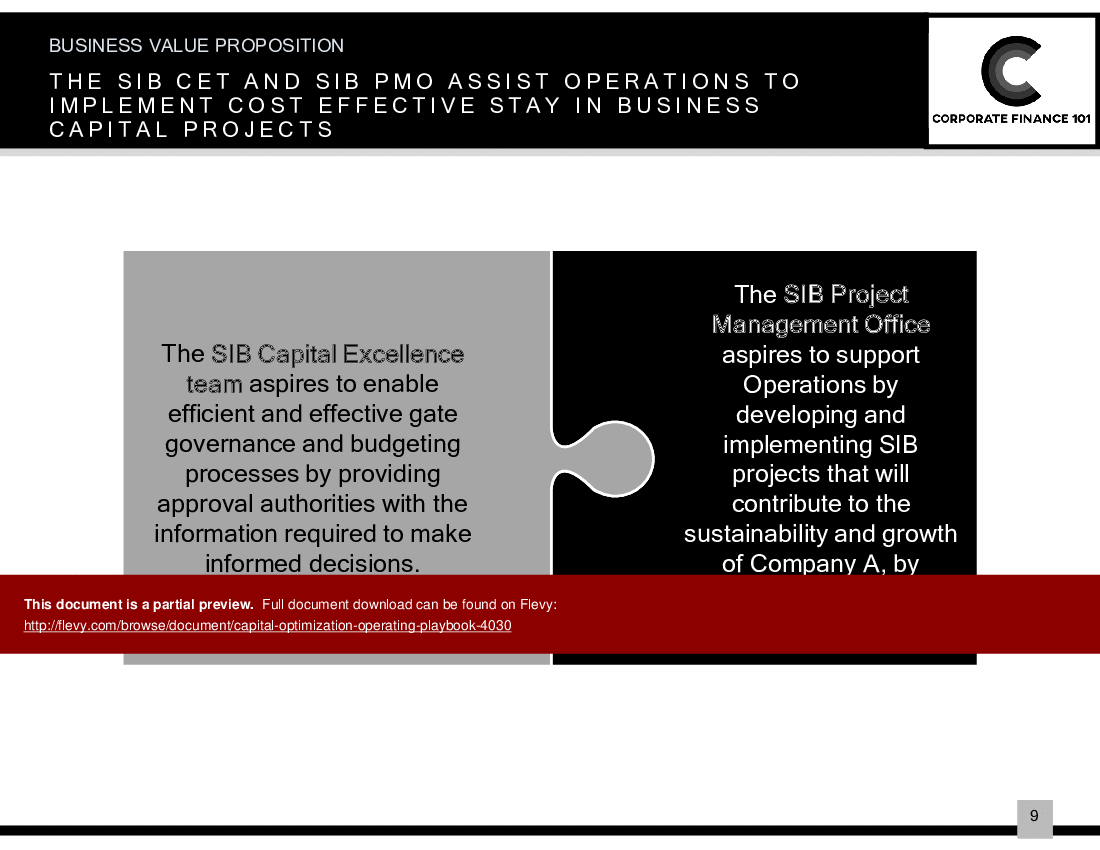
The Capital Optimization Guide delves into the intricacies of optimizing Stay-In-Business (SIB) capital spend, addressing the challenges at the project, portfolio, and organizational levels. It highlights the importance of clear project justification, front-end loading, and comprehensive optimization of individual projects. The guide also emphasizes the need for robust governance and performance management structures, including standardized tools and templates, to ensure efficient gate governance and budgeting processes. The PPT provides a detailed roadmap for creating business value through capital scrubbing, portfolio management, and stage gate implementation, supported by a well-defined organizational structure and roles.
Got a question about the product? Email us at support@flevy.com or ask the author directly by using the "Ask the Author a Question" form. If you cannot view the preview above this document description, go here to view the large preview instead.