Editor's Note: Take a look at our featured best practice, Kaizen (254-slide PowerPoint presentation). [NOTE: Our Kaizen presentation has been trusted by an array of prestigious organizations, including industry leaders such as Apple, Bayer, University of Michigan, General Motors, Cummins, Baxter, Johnson Controls, Ulta, Daimler Truck, Aramark, Parsons Corporation, to name just a few.]
Explore [read more]
* * * *
Kaizen (or commonly referred to as Value-Add Kaizen) is a problem solving tool used for process improvement by identifying if an activity (which is part of a process flow) is Value Add (VA) or Non-Value Add (NVA), then take steps to either remove or reduce these NVA activities. As these NVA activities are eliminated, the sequence of the process flow may need to be redesigned to be more efficient. This method can be used to improve throughput, cycle time, cost and reduce any type of waste in the organization.
A good definition of Kaizen (改善), Japanese for “improvement”, or “change for the better” refers to philosophies or practices that focus upon continuous improvement of processes in manufacturing, engineering, game development, and business management.
Value Add Kaizen, (VAK) is a problem solving tool used when designing or improving processes, or part of a process against a specific loss in the organization.
VAK Methodology
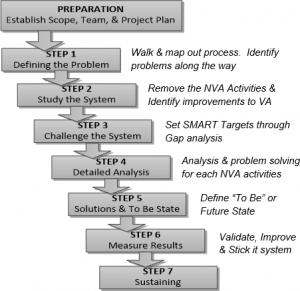
There are 7 steps for the VAK. They are:
Preparation: Establish the Theme, Team and Project Plan
Step 1: Defining the problem
Step 2: Study the system
Step 3: Challenge the system
Step 4: Detailed analysis
Step 5: Solutions and future state development
Step 6: Results
Step 7: Sustaining
We shall use an example to go through all the steps in this VAK.
PREPARATION: ESTABLISH THE THEME, TEAM AND PROJECT PLAN
We can use the Business KPI data to establish a theme. Often, in a fab environment, the common continuous improvement required is in areas of throughput, cycle time, cost and yield. Once a theme is selected, a “Project Charter” requires a Sponsoring Manager, who can help provide guidance, secure resources and approval, and link to higher management required for the success of the project.
The scope has to be clearly defined in the project charter, which includes deliverables (target) and time-frame. Typically, a VAK project can get to define a solution and a future state plan within a couple of months. Driving implementation and sustaining the improvements can have a wide and longer time-frame.
Next, the team must have a lead, process owner and relevant stakeholders. It will also be good to include an independent facilitator to advice on the technique. The roles, responsibilities and deliverables of the team members must be clarified during team formation. As the project may run over several months, approval from the member’s manager is required to allocate sufficient time for the project meetings and activities. A draft master plan should be prepared together during the first few meetings.
For our illustration of deploying the VAK methodology, we selected a recent cycle time reduction case study for a new product development (NPD) process of a LED manufacturer. At the start of this engagement the product development cycle normally took between twelve to fifteen months. MAX was engaged by this client to drive and achieve a target of 6 months for the NPD cycle. Our team consisted of a Program Manager, Technical Project Leads, Process Engineers, Manufacturing and Quality Engineers. The project scope spanned across all the development and manufacturing sites world-wide and it consisted in delivering an “As Is” state within 3-months (Steps 1-5) and to drive implementation in the following 15 months (Steps 6-7).
STEP 1: DEFINING THE PROBLEM
Now we are ready to walk and map out the entire process from the beginning to the end. Nash and Poling (2008) devoted an entire book for the mapping process.
We can map the process using flow charts or list the processes in a table. We started by mapping the process at a slightly higher level for a start to look at the big picture using Value Stream Mapping (VSM). We can always do a “deep dive” at a later stage for further analysis.
During the mapping process, all stakeholders should be present to contribute and participate to help draw the process flow. The starting point or “starting block” of the diagram is determined by the scope of the project. This flow can be drawn on a whiteboard as the facilitator help guide in the “what is the next process.” This can be done in a single or several sessions depending on the complexity of the flow.
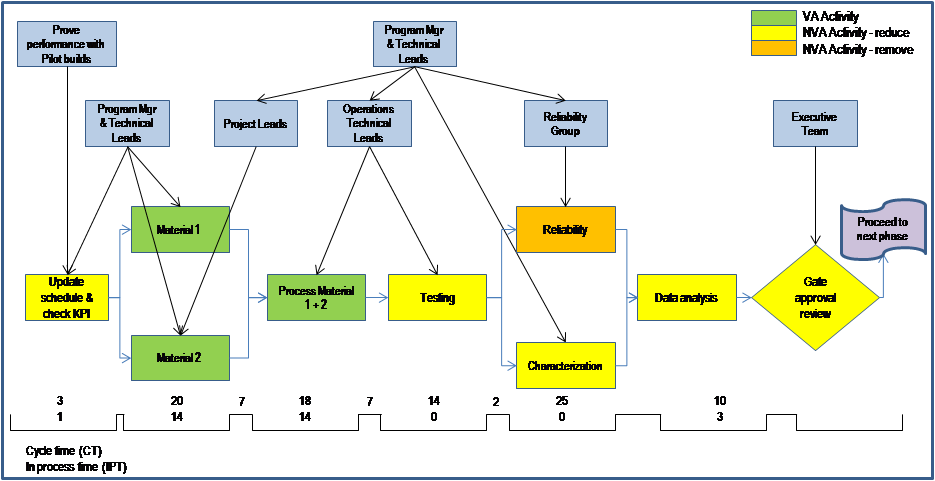
After we completed mapping the processes, we put in the process and the waiting time for the activities. Next, for each of the activities, we determined if the activity is Value Add (VA) or Non-Value Add (NVA) to the process. A VA activity adds value to the product based on customer’s expectation. An NVA activity could be a redundant transport, take time and space but does not add value to the product. We have now completed the “As Is” process flow of the current situation and this is illustrated in in the figure below.
STEP 2: STUDY THE SYSTEM
We then study the process map for the product flow. We have to verify that the NVA activities identified do not add value and can be removed, if not reduced from the flow. We then reviewed if this flow is closer to that of an ideal state with minimum or no wastage (time, material, space, etc.).
An example of NVA activity is inspection because from the customer’s standpoint inspection is wasteful. Inspection can be reduced, if not eliminated by having better quality inputs (better material from the supplier), training and certification of operators and having better designed “idiot proof” procedures or systems which can prevent errors from occurring.
Other examples of NVA activities are long approval loops, transportation and storage.
STEP 3: CHALLENGE THE SYSTEM
After removing the NVA activities, we needed to establish the real gap in performance and set SMART targets to achieve for the project. SMART is an acronym for Specific, Measurable, Achievable, Realistic and Time-bounded. If the targets cannot be defined as SMART targets, the project can quickly lose focus and derail.
We have to keep in mind that there may be multiple layers of NVA activities. In our case study, the removal or reduction of the NVA activities identified were sufficient for us to achieve our SMART targets. If removing the NVA activities does not meet the required targets, for example, cycle-time, we shall have to revisit the flow and further identify more opportunities for improvement.
STEP 4: DETAILED ANALYSIS
We studied in depth all the NVA activities listed. This means, studying their specific problems and seek their root cause to solve them. One of the methods to find the root cause is the “5-whys”. We continued to ask, “Why” until we isolate the “Symptoms” from the “Root” or “Main” reason. We can then use one of the following to mitigate the NVA activities, ECRS: Eliminate, Combine, Reduce or Simplify.
The table below lists some of the activities we looked into for cycle time reduction in our new Product Development, which compared against industrial standard benchmark as a guide. Setting realistic goals is important. Therefore, benchmarking data or another form of comparison is a good metric to keep the team focus on achievable results.
Summary of Analysis of Current vs. Goal against Benchmark as Reference
STEP 5: SOLUTIONS AND “TO BE” DEVELOPMENT
After studying in depth the NVA activities, we developed a working solution to improve the process flow and implemented the solutions on selected pilot or small scale runs. Quick improvements are important to validate the findings and back them up with actual measurable data.
As an example, we worked on the Design of Experiments (DOE) to optimize the runs and material usage. In the process flow diagram, this is embedded in the “Material 1” box and this is mentioned again in the table above.
Prior to this, 3 processes were evaluated by changing 1 parameter of the process at a time. This is both time consuming and does not give the “best combination” for the 3 processes. We used the “Minitab” software to generate a standard DOE matrix which allowed us to evaluate all factors in parallel. This reduced the time required for the runs by 50% as all runs are planned and defined so they do not depend on previous runs. Using the “Minitab” also allowed analysis of results and subsequent generation of predictive models to be automated.
After the model generated an optimum setting for the parameters, we did some verification runs to ensure that the new “solution” achieved the same objective or better as the old setting, without creating new issues (defects, wastage, rejects).
A “To Be” value steam map should be generated at this step which illustrates all improvements and the expected total cycle-time targets. The “To Be” or future state should be distributed across the entire organization. Communicating the new goals is critical and all stakeholders need to buy-in for improvements to stick.
STEP 6: RESULTS
We tracked and recorded the relevant improvements against the old process flow. A good measure here is on cycle time reduction, NVA activities were either reduced or eliminated or problems were resolved.
In our case, we were able to save close to 50% reduction in CT during the DOE. As the runs we optimized, we were also able to save close to 30% of material usage. This translated to reduced man-hours (labour cost) and material wastage in the line.
STEP 7: SUSTAINING
This step is essential to ensure that the new process flow is formally replacing the old flow and the organization does not revert back to the old flow.
As an example, the new procedure for DOE is documented for traceability purposes to record when the old process flow was switched to a new one. This impact will trigger down to other adjacent processes. Documenting was also critical for change control, risk management and will serve as a training tool for future education reference.
Other than documenting the new procedure, the new flow should now be tracked as one of the performance matrices with an owner. An easy way to embed improvements is to force checklist items at phase gate reviews and ask the team to provide metrics for the questioned step or process.
Conclusions
As in any problem solving tool, Value Add Kaizen will only be effective when this knowledge is put into practice continuously, as the name implies. The steps may seem trivial and straight forward but the challenge will be for the team to question convention, solicit support and approval to change what has been practiced in the organization for a long time.
In a successful implementation of Value Add Kaizen, the organization will have real savings in cycle time, material (WIP) and labour which in turn translates to reduced cost and faster time-to-market for new products.
Acknowledgements
The authors would like to thank the Product Development group of the LED manufacturer for their helpful discussion and support during the execution of this project.
[NOTE: Our Kaizen Event Guide has been trusted by an array of prestigious organizations, including industry leaders such as Apple, Bayer, University of Michigan, General Motors, Cummins, Johnson Controls, Ulta, Daimler Truck, Aramark, Parsons Corporation, Minerals Technologies, Hunter Douglas, to [read more]
Do You Want to Implement Business Best Practices?
You can download in-depth presentations on Kaizen and 100s of management topics from the FlevyPro Library. FlevyPro is trusted and utilized by 1000s of management consultants and corporate executives.
For even more best practices available on Flevy, have a look at our top 100 lists:
These best practices are of the same as those leveraged by top-tier management consulting firms, like McKinsey, BCG, Bain, and Accenture. Improve the growth and efficiency of your organization by utilizing these best practice frameworks, templates, and tools. Most were developed by seasoned executives and consultants with over 20+ years of experience.
Readers of This Article Are Interested in These Resources
In this Employee Suggestion System presentation, we address the critical issue of employee engagement and its impact on workplace success. Despite its significance, only less than 30% of employees worldwide are genuinely engaged, according to a recent Gallup State of the Global Workplace [read more]
This is a PowerPoint document. It has been designed as a comprehensive guide as to how to create and execute a 3–5-day Kaizen workshop. It can be used as reference material for project leads, or alternatively as training material. It also contains templates that can we used to facilitate the [read more]
This presentation has 114 slides and and comprises of the following:
What is Kaizen?
The 10 Commandments of Continuous Improvement
Value versus Waste concept
The 7 steps to eliminate or reduce waste:
1. Organize the workplace - 5S
2. Arrange everything to "flow"
3. Standardize work [read more]
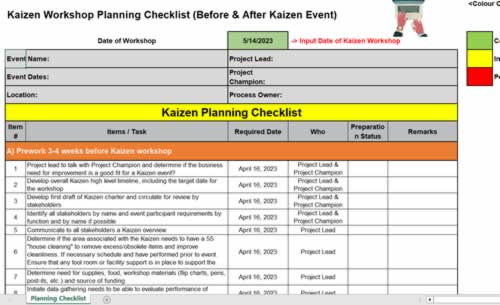
The key to a successful Kaizen workshop is planning. You have to prepare in order to be able to lead a team through a problem and gain stakeholder alignment or approval.
This is an excel document that helps you to action the tasks required within the desired timeframe in order to execute your [read more]
 There are 7 steps for the VAK. They are: