Editor's Note: Take a look at our featured best practice, A Comprehensive Guide to Change Management (586-slide PowerPoint presentation). This "new and improved" A Comprehensive Guide to Change Management,, which replaces my previous "best seller" of the same name, contains everything (well nearly everything) you would ever want to know about Change Management. This slide-deck now contains over 580 slides which includes [read more]
* * * *
“One picture is worth a thousand words.”
How can sponsors and change practitioners create a picture of sponsorship?
The sponsor holds a critical role in every change initiative. There is ample research that shows the importance of the role and the positive impact that sponsorship has on change success and staff engagement. The impact of the role, the critical activities that need to be performed and the duration that sponsors need to be engaged make it essential that sponsors are aware of how they show up. A simple curve can provide a representation of sponsorship that sponsors can use to assess themselves and change agents can use to hold meaningful conversations with their sponsor.
Components of a sponsorship curve
Sponsorship is not a new concept. While many descriptions are available, Daryl Conner clearly articulates the role with the simple statement “the sponsor legitimizes the change”. In his blog, Essential Truths about Sponsorship, Conner goes on to say that sponsors can take two actions to position a change for success: communicate the change to the target group and impose consequences (positive and negative implications for the way targets support the change).
Sponsors demonstrate these actions through their behaviors. These actions can be difficult because it takes tough conversations and decisions to drive consequences. Another difficulty is the duration of the role. To be successful, sponsors need to communicate the change throughout the duration of the change initiative — not just the kick off meeting and at go-live. The same holds true for driving consequences.
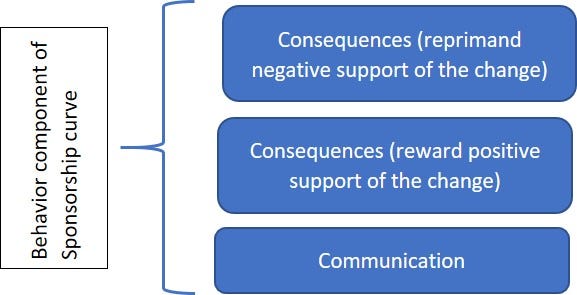
You can build your own sponsorship curve based on these two elements: demonstrated behaviors and time.
Behaviors are communication and consequences, both positive and negative.
Time is the duration of the change initiative.
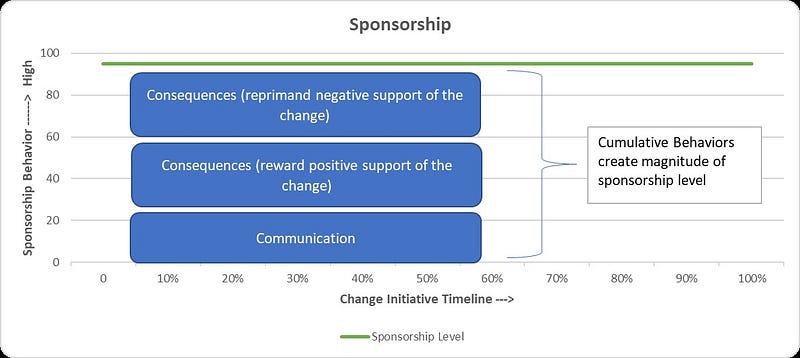
Sponsorship behaviors plotted against time
Together, a simple line chart captures how a sponsor shows up over the course of an initiative. The height of the sponsorship curve is determined by demonstrated behaviors.
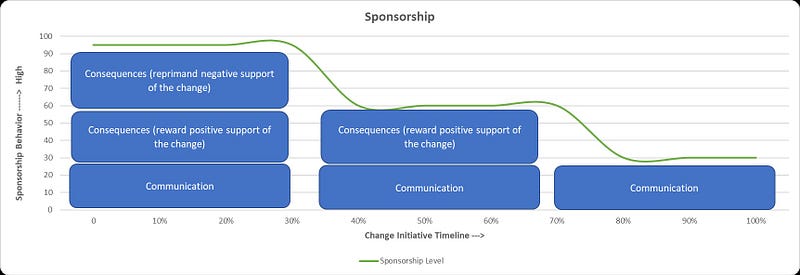
When plotted over time, sponsorship level shifts based on demonstrated behaviors. For example, if a sponsor stops driving consequences (positive or negative), their level of sponsorship drops.
Users have a lot of autonomy and flexibility with defining demonstrated behaviors (the height of the sponsorship curve). Both terms, communication and consequences can be a bit vague and are vulnerable to unexplained assumptions. Spend some time early in a change initiative to get clarity on what are the expectations of the person in the sponsor role. Those expectations can be used to further define or clarify what drives the height of the sponsorship curve and what the team considers worth measuring for each change. The use of the curve drives this important initial conversation between the change team and sponsor. The result is clearer expectations and a measurement device that sponsors and change agents can use throughout the change initiative.
So, what does your sponsorship curve look like?
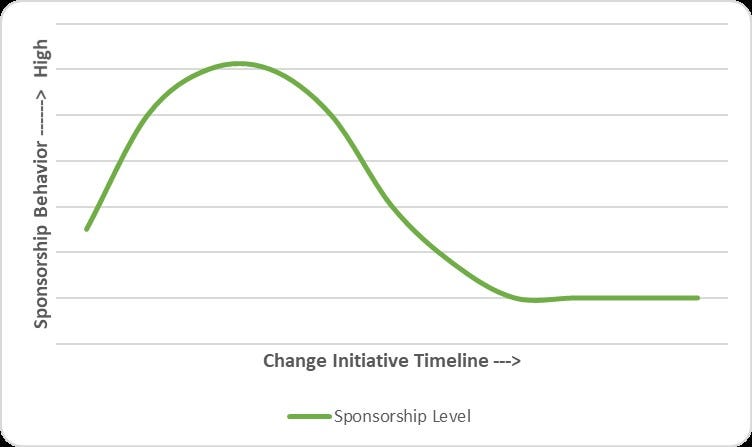
Here are a few examples of sponsorship curves.
Here is the shiny object curve. This sponsor’s behaviors come up to speed and are fully engaged early in the initiative. Then the sponsor gets distracted by other priorities. Sponsorship slips and remains nearly non-existent throughout the remainder of the initiative.
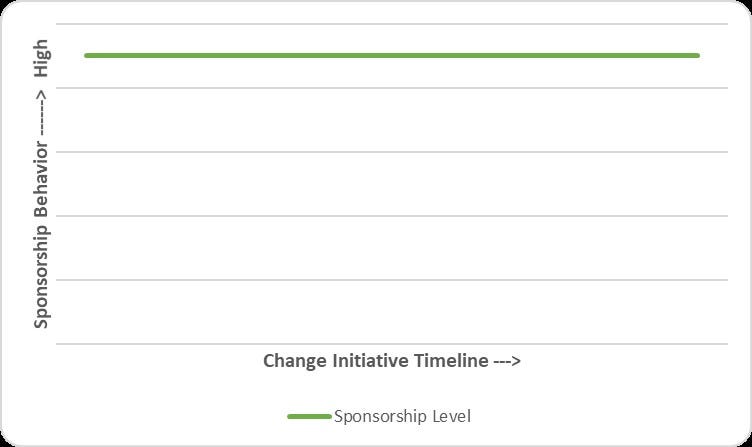
Here is the full steam ahead sponsorship curve. This sponsor is fully engaged from project start to project completion and realization.
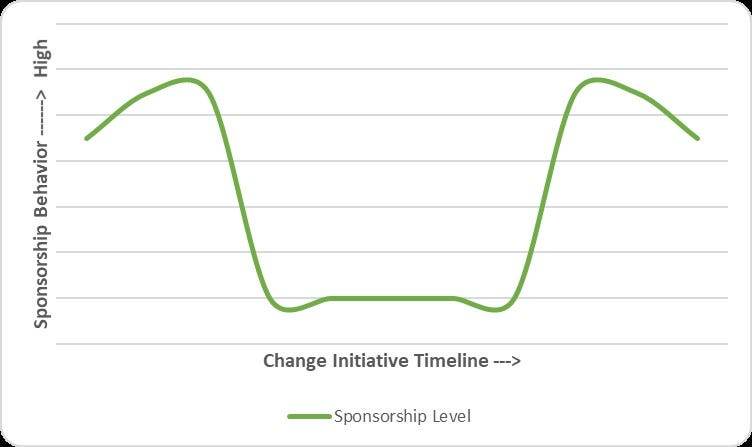
Above is the all too common bimodal sponsorshipcurve. This sponsor is full on at project start and at the final launch, with sponsorship falling away in the middle of the initiative.
A more extreme version of the bimodal curve is the two-dot sponsorship style. Here the sponsor makes the kick off meeting only, and the launch party. While rare, this does exist today.
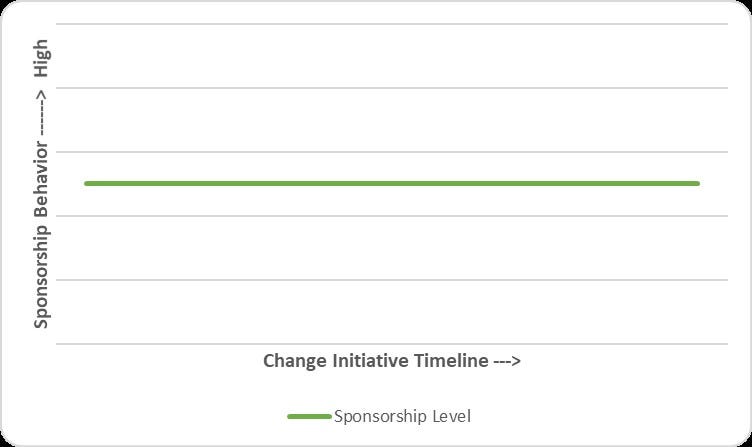
Finally, here is the halfway-there curve. This sponsor communicates frequently, but does not drive any consequences, positive or negative.
Why a sponsorship curve is important
Why is this important? Sponsorship is a component of success and is an important driver for staff engagement. Sponsors are visible to employees, and make employees care about the initiative. Sponsorship level is an indicator of how staff will engage with the change. Here is an observation to make the point.
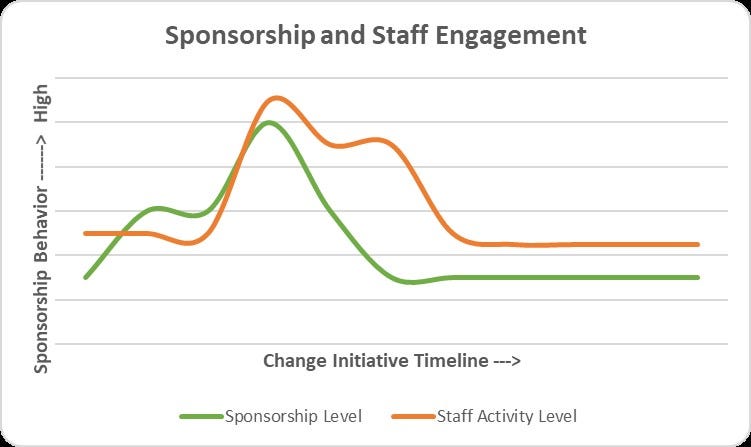
On a recent change project, the change team tracked target audience engagement via training session attendance along with the sponsor’s activities of communication, driving rewards for staff engaging with the change and delivering reprimands when staff did not engage with the change. Below are the results.
It is clear there is something going on here. Staff activity tracks with sponsorship level. The peak in the sponsorship curve and the staff activity curve is when the sponsor informed staff he expected them to take the training sessions that explained the change. Then the sponsor stopped requiring engagement by the staff. Shortly afterward, staff participation in the training sessions dropped and remained low. At the time of the initiative’s close, the sponsor was communicating key messages, and had stopped rewards and reprimands. By the end of the initiative, less than half of the target audience was involved in change training activities. This was not a successful initiative.
Please note the above was not performed as a scientific experiment. The change team did not have a control group and an experimental group. Other variables were not held constant. It is data from a set of observations. But if you are in the camp that believes sponsorship has an impact on staff engagement, then this data more than hints at that relationship.
Going a step further, think about the impact to staff engagement related to the curves discussed above. What kind of staff engagement would you expect when a sponsor follows the shiny object curve? Or the bimodal curve? Or the full steam ahead curve. Which curve do you want to demonstrate to your staff?
Challenge
Here is a challenge to sponsors and change teams. Agree to measure and trend sponsorship over the course of your current change initiative. Look for the impact on staff engaged with the change. Have an honest discussion on sponsorship using the sponsorship curve. Based on what you are observing and measuring, what is the level of your sponsorship? Make changes to ensure success for your change initiative and engagement of your staff.
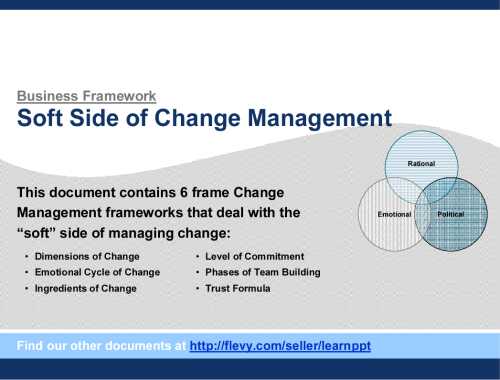
This document contains 6 frame Change Management frameworks that deal with the "soft" side of managing effective organizational change:
1. Dimensions of Change
2. Emotional Cycle of Change
3. Ingredients of Change
4. Level of Commitment
5. Phases of Team Building
6. Trust [read more]
Do You Want to Implement Business Best Practices?
You can download in-depth presentations on Change Management and 100s of management topics from the FlevyPro Library. FlevyPro is trusted and utilized by 1000s of management consultants and corporate executives.
For even more best practices available on Flevy, have a look at our top 100 lists:
These best practices are of the same as those leveraged by top-tier management consulting firms, like McKinsey, BCG, Bain, and Accenture. Improve the growth and efficiency of your organization by utilizing these best practice frameworks, templates, and tools. Most were developed by seasoned executives and consultants with over 20+ years of experience.
Readers of This Article Are Interested in These Resources
This is a collection of common Strategy and Management Consulting Frameworks. A Management Consulting Framework provides a structured approach to analyzing and solving a common business problem. It allows Management Consultants to address a client’s business issue in an organized, thorough, and [read more]
Change is the only constant in the work environment today. However, a McKinsey study revealed that 70% of change programs fail, most often due to resistance from employees. For change to be successful, it has to be effectively managed. To achieve this, it is essential that the human side of change [read more]
Change Management necessitates engaging and rallying people at all levels in the organization transition to a desired future. It is critical to ensure that the entire workforce is eager and ready to embrace the required new behaviors. More often than not, the technical side of a Change initiative [read more]
If you have already downloaded my Comprehensive Guide to Change Management or my Comprehensive Guide to Change Management and ERP Implementations then most of what is in these slides is already covered in them.
If you are one of the now nearly 1000 people who have downloaded my FREE Practical [read more]
 How can sponsors and change practitioners create a picture of sponsorship?