Editor's Note: Take a look at our featured best practice, Objectives and Key Results (OKR) (23-slide PowerPoint presentation). Successful organizations are using Objectives and Key Results (OKR) now. OKRs are efficient way to track company and team goals and measure their progress. It helps every organization's success by cutting out unimportant goals and focusing on what truly is important within the organization.
OKR [read more]
* * * *
Business dashboards are important tools to measure key performance indicators and data pertaining to an organization or certain procedure. Just as a vehicle dashboard is powerful performance management tool in summarizing a performance of a multitude of processes, a business dashboard summarizes the performance or impact of a host of functions, teams, and activities; and assists in strategic planning and decision making.
Business dashboards simplify sharing and analysis of large data, and help users visualize complex performance data in simple yet visually aesthetic manner. Dashboards aid in simplifying complex processes into smaller more manageable information pieces for the organizational leadership to focus on everyday operations. They keep everyone on the same wavelength and prioritize display of facts based on their importance and potential impact. The information on a well-designed dashboard is clear, presentable to enhance meaning, readily accessible, and dynamic. A carefully-planned dashboard allows the leadership to identify and answer business challenges in real-time, develop plan of action based on insights, and inculcate innovation.
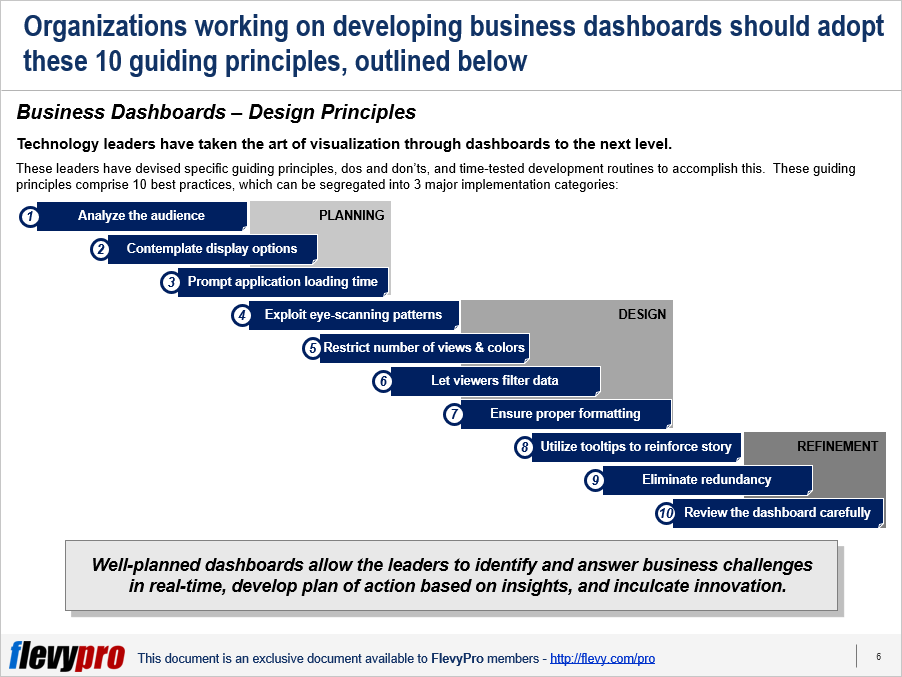
Proficient and capable dashboard designers and firms have taken the art of visualization of valuable indicators and insights through dashboards to the next level. They have devised specific guiding principles, dos and don’ts, and time-tested development routines to accomplish this. These guiding principles comprise 10 best practices, which can be segregated into 3 major implementation categories:
Planning
Analyze your audience
Contemplate display options
Prompt application loading time
Design
Exploit eye-scanning patterns
Restrict number of views & colors
Let viewers filter data
Ensure proper formatting
Refinement
Use Tooltips to reinforce story
Eliminate redundancy
Review the dashboard carefully
Let’s discuss the first 5 best practices for now.
Analyze your audience
A careful analysis and understanding of the business dashboard’s intended audience is the first important principle to consider before commencing the development of such a dashboard. For instance, a busy salesperson in need of quickly going through indicators, whereas senior management needing a deep-down review of quarterly sales results. This gives the developers a thorough idea of what the audience wants from a dashboard, what data they will visualize utilizing this, and let them know the audience’s technical capabilities in terms of data analysis, theme, issue, and business understanding.
Contemplate display options
The second principle to follow in designing a business dashboard is to research your users’ device and display preferences beforehand. Building a dashboard with desktop display options in mind when your audience prefers to use phones to view it could be a disaster. The designers should set the size of the dashboard properly—allowing the users to view it on a range of devices, by building in automatic sizing option for the dashboard to adopt to the dimensions of the browser window.
Prompt application loading time
Your audience and viewers are busy people who hate long waits. Therefore a stunningly designed dashboard would not get the right traction if it takes too much time to load. The dashboard author should facilitate prompt dashboard loading by deciding which filters to add in the dashboard and which ones to exclude. For instance, although filtering is useful in restricting the amount of data analyzed, it effects query performance. Some filters are quite slower than others as they load all of the data for a dimension instead of just what you want to keep. Knowing the Order of Operations is also beneficial in reducing the load times.
Exploit eye-scanning patterns
The dashboard authors should have a deep sense of the main purpose of the dashboard in mind when develop such a tool. They need to be aware of individuals’ eye tracking patterns—typically when most people look at a screen or content, they start scanning the upper left hand corner of the screen first by intuition—and make the best use of the screen space to display the most important content at the right place.
Restrict number of views & colors
The designers often get over enthusiastic during their application designs and try to stuff the dashboard with multiple relevant views. This is detrimental for the bigger picture. They must include not more than 2 to 3 views per dashboard and create more dashboards in case the scope creeps beyond the 2-3 views range. It is also crucial to ensure the content to be clearly visible to the viewer and to use colors correctly to facilitate analysis instead of cramming too many colors in the visuals, which creates a graphical overload for the viewers, slacken analysis (or may even prevent users to analyze data), and even blur the graphics.
Let viewers filter data
Allowing users to filter the data is another best practice to keep in mind while designing business dashboards. This added interactivity encourages data assessment and permits the users to have their most important view act as a filter for the other views in the dashboard. This helps in conducting side-by-side analysis, promotes involvement, and retains users’ interest.
You can download in-depth presentations on this and hundreds of similar business frameworks from the FlevyPro Library. FlevyPro is trusted and utilized by 1000s of management consultants and corporate executives. Here’s what some have to say:
“My FlevyPro subscription provides me with the most popular frameworks and decks in demand in today’s market. They not only augment my existing consulting and coaching offerings and delivery, but also keep me abreast of the latest trends, inspire new products and service offerings for my practice, and educate me in a fraction of the time and money of other solutions. I strongly recommend FlevyPro to any consultant serious about success.”
– Bill Branson, Founder at Strategic Business Architects
“As a niche strategic consulting firm, Flevy and FlevyPro frameworks and documents are an on-going reference to help us structure our findings and recommendations to our clients as well as improve their clarity, strength, and visual power. For us, it is an invaluable resource to increase our impact and value.”
– David Coloma, Consulting Area Manager at Cynertia Consulting
“As a small business owner, the resource material available from FlevyPro has proven to be invaluable. The ability to search for material on demand based our project events and client requirements was great for me and proved very beneficial to my clients. Importantly, being able to easily edit and tailor the material for specific purposes helped us to make presentations, knowledge sharing, and toolkit development, which formed part of the overall program collateral. While FlevyPro contains resource material that any consultancy, project or delivery firm must have, it is an essential part of a small firm or independent consultant’s toolbox.”
– Michael Duff, Managing Director at Change Strategy (UK)
“FlevyPro has been a brilliant resource for me, as an independent growth consultant, to access a vast knowledge bank of presentations to support my work with clients. In terms of RoI, the value I received from the very first presentation I downloaded paid for my subscription many times over! The quality of the decks available allows me to punch way above my weight – it’s like having the resources of a Big 4 consultancy at your fingertips at a microscopic fraction of the overhead.”
– Roderick Cameron, Founding Partner at SGFE Ltd
“Several times a month, I browse FlevyPro for presentations relevant to the job challenge I have (I am a consultant). When the subject requires it, I explore further and buy from the Flevy Marketplace. On all occasions, I read them, analyze them. I take the most relevant and applicable ideas for my work; and, of course, all this translates to my and my clients’ benefits.”
There are clear and measurable differences that exist between organizations that use Key Performance Indicators (KPIs) to monitor and assess performance and those that use KPIs to guide and drive performance improvements. Data-driven and customer-oriented leaders use KPIs to transform their [read more]
Readers of This Article Are Interested in These Resources
Organizations often face significant challenges in aligning their day-to-day operations with their long-term strategic goals. This issue of strategic misalignment is particularly detrimental to sectors like manufacturing, healthcare, and technology, where rapid decision-making and agility are [read more]
Elevate your team's performance and strategy execution to new heights with the Performance Scorecard Framework, crafted by former strategy consultants from elite firms such as BCG and EY. This unique tool combines the strengths of the Balanced Scorecard with an exclusive proprietary [read more]
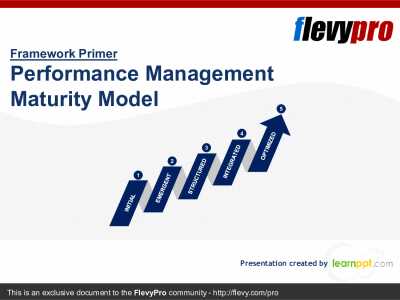
The organizational maturity notion signifies the progress of an organization in terms of developing its people, processes, technology, and capability by implementing quality practices. Organizations aiming to achieve the highest maturity levels in performance need to take care of the intricacies [read more]
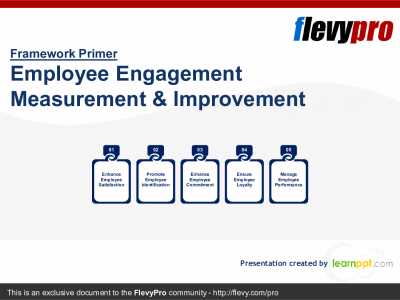
Employee Engagement has emerged as one of the significant pillars on which the Competitive Advantage, Productivity, and Growth of an organization rests. Measuring Employee Engagement is vital in shaping Employee Engagement Strategies that help propel the organization towards growth.
This [read more]