Editor's Note: Take a look at our featured best practice, Digital Transformation Strategy (145-slide PowerPoint presentation). Digital Transformation is being embraced by organizations across most industries, as the role of technology shifts from being a business enabler to a business driver. This has only been accelerated by the COVID-19 global pandemic. Thus, to remain competitive and outcompete in today's fast paced, [read more]
* * * *
Market Analysis is a critical strategic function. It provides the insights necessary to understand market dynamics, consumer behavior, and the competitive landscape. As a foundational element of Strategic Planning and Performance Management, Market Analysis empowers organizations to identify opportunities, anticipate trends, and mitigate risks. It is an indispensable tool for shaping an organization’s strategic direction and ensuring its offerings resonate with the target audience.
On the surface, conducting Market Analysis may appear straightforward. However, beneath the surface, it is filled with difficult, strategic questions that require accurate and robust data to address. One of the most powerful data-driven tools to do this is Market Analysis Key Performance Indicators (KPIs).
This article discusses the significance of Market Analysis KPIs and how they can illuminate the path to strategic and operational excellence. We will explore how these KPIs enable organizations to make data-driven decisions, adapt to market shifts, and optimize their performance. The objective is to provide a framework that leaders can use to dissect market complexities and carve out a Competitive Advantage in their respective industries.
Importance of Market Analysis
We already highlighted this briefly, but let’s dig deeper. In a world where market conditions fluctuate rapidly, the ability to perform a thorough Market Analysis is not just beneficial; it is critical for survival. These analyses offer organizations a macro and micro view of their operating environment, revealing consumer preferences, market needs, and competitive forces.
Navigating the market landscape is fraught with challenges. Organizations often grapple with understanding the size and growth trajectory of their market, identifying the right customer segments, and positioning their brand effectively.
Moreover, the task of monitoring competitive moves and technological advancements can be overwhelming. Market Analysis KPIs cut through these complexities by providing clear metrics to gauge market potential, track competitive activity, and measure market penetration and sentiment.
These Market Analysis KPIs serve as a navigational tool for organizations to make informed decisions, align their strategies with market demands, and maintain a competitive edge.
Top 10 Market Analysis KPIs
Certain KPIs in Market Analysis stand out for their capacity to provide a comprehensive view of an organization’s market position and opportunities. Below, we have identified the top 10 KPIs that are universally significant for Market Analysis across a broad range of industries. These KPIs are selected from the Flevy KPI Library, a robust database of over 15,000+ KPIs.
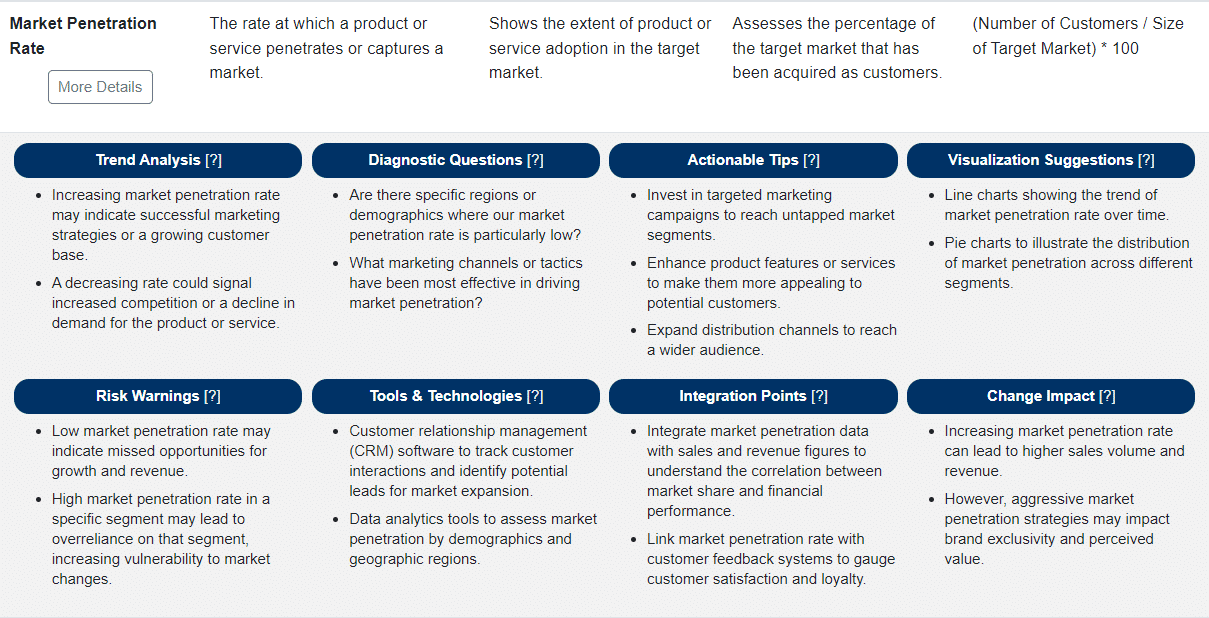
1. Market Penetration Rate
Definition: The percentage of the identified market that has purchased the organization’s products or services.
Relevance: It measures the organization’s success in reaching its potential market and can indicate the potential for market expansion.
2. Market Share Growth
Definition: The increase in the percentage of total market sales captured by the organization over a specific period.
Relevance: This KPI is a direct indicator of an organization’s growth relative to its competitors, reflecting the effectiveness of sales and marketing strategies.
3. Customer Acquisition Cost (CAC)
Definition: The total cost associated with acquiring a new customer, including marketing and sales expenses.
Relevance: A critical KPI for evaluating the effectiveness and efficiency of marketing strategies and budget allocation.
4. Customer Lifetime Value (CLV)
Definition: The total revenue an organization can expect from a single customer account throughout the business relationship.
Relevance: CLV helps organizations strategize customer retention efforts and allocate marketing resources more effectively.
5. Brand Equity
Definition: A measure of a brand’s value, which reflects the overall customer perception of the brand’s strength and loyalty.
Relevance: Strong brand equity translates to higher customer retention, pricing power, and overall market influence.
6. Customer Retention Rate
Definition: The percentage of customers who continue to buy from the organization over a given period.
Relevance: It is indicative of customer satisfaction and loyalty, which are essential for sustained business growth.
7. Annual Sales Growth
Definition: The year-over-year percentage increase in total sales revenue.
Relevance: This KPI provides a straightforward indicator of the organization’s overall growth and market demand for its offerings.
8. Churn Rate
Definition: The percentage of customers who stop doing business with an organization over a specific period.
Relevance: A low churn rate is indicative of a strong value proposition and customer satisfaction, while a high churn rate can signal the need for product or service improvements.
9. Sales Revenue per Employee
Definition: The amount of sales generated by each employee, serving as a productivity benchmark.
Relevance: This KPI can highlight the effectiveness of the organization’s workforce and can also be used for workforce planning and performance evaluation.
10. Brand Awareness Reach
Definition: The extent to which consumers are familiar with the qualities or image of the particular brand.
Relevance: High brand awareness often correlates with increased market share and sales, as well as being a precursor to brand loyalty.
To dig deeper into any of these KPIs, we invite you to explore the Flevy KPI Library, which allows you to drill down into 12 attributes for each KPI in the database. Here is an example for our top ranked KPI, Market Penetration Rate:
Case Studies and Success Stories
Leveraging CLV to Boost Market Position
A digital streaming service was experiencing stagnant growth and sought to enhance its market position. It decided to focus on “Customer Lifetime Value (CLV)” and “Market Share Growth” as its primary KPIs.
The organization implemented a multi-tiered subscription model to maximize CLV, offering personalized content recommendations and exclusive features to higher-tier subscribers. They also launched targeted marketing campaigns to attract new customer segments.
Outcome: Over the next year, the streaming service saw a 20% increase in CLV and a 5% rise in market share, outperforming several key competitors. The new subscription tiers effectively increased revenue and customer engagement.
Lessons Learned: Investing in customer retention strategies and personalized experiences can significantly improve CLV and contribute to market share growth. Tailored content and exclusive features were key differentiators in driving customer value and competitive advantage.
Revitalizing Brand Awareness to Stimulate Sales
An established consumer goods company noticed a plateau in “Annual Sales Growth” despite a strong “Brand Equity.” The company recognized the need to revitalize its “Brand Awareness Reach” to stimulate growth.
The company launched an innovative marketing campaign across multiple channels, leveraging social media influencers to enhance brand visibility. They also improved their sales enablement tools to boost “Sales Revenue per Employee.”
Outcome: The company’s brand awareness increased by 30% within six months, and annual sales growth jumped by 12%. The sales team’s productivity rose, reflected in a 15% increase in sales revenue per employee.
Lessons Learned: A well-executed brand awareness campaign can significantly impact sales growth, especially when coupled with strategic sales enablement. Harnessing the power of social media and influencer partnerships can be a game-changer in increasing market presence and energizing sales teams.
Additional Resources and Further Reading
Foremost, if you are in the process of selecting or refreshing your Corporate Strategy KPIs, take a look at the Flevy KPI Library. With over 15,000+ KPIs, our KPI Library is one of the largest databases available. Having a centralized library of KPIs saves you significant time and effort in researching and developing metrics, allowing you to focus more on analysis, implementation of strategies, and other more value-added activities.
Here are other KPI Strategy and KPI Management articles we’ve published:
Principles of KPI Selection. This article breaks down the 8 guiding principles to KPI selection and provides several case studies on how to use these principles in practice.
Principles of KPI Maintenance. It’s important to recognize that as market conditions and strategic objectives evolve, so too must the KPIs. This article provides a disciplined approach to maintaining KPIs.
KPI Dashboard Design & Visualization. Learn the art and science of designing KPI dashboards, including types of data visualization and how to choose among them.
Anatomy of a Strong KPI. Learn what makes a KPI effective, discussing the characteristics of KPIs that are most impactful and how they can drive strategic business decisions.
10 Common Pitfalls in KPI Implementation. Learn how to identify and remediate the 10 most common pitfalls in KPI implementation. If left unfixed or as unknowns, these pitfalls can have disastrous, long-term impacts on the organization.
KPIs and Organizational Alignment. This article discusses the concepts of strategic, tactical, and operational KPIs; as well as balancing individual, team, and organizational objectives.
Integrating KPIs into Employee Performance. This article discusses 5 methods for integrating KPIs into individual performance metrics; and includes several case studies.
Future-Proofing KPIs. Understand how to “future-proof” KPIs by understanding the impacts of emerging market trends, emerging technologies, and evolving consumer behaviors on KPIs.
KPIs and Digital Transformation. All organizations are undergoing Digital Transformations. Learn how to define, select, and implement relevant Digital Transformation KPIs.
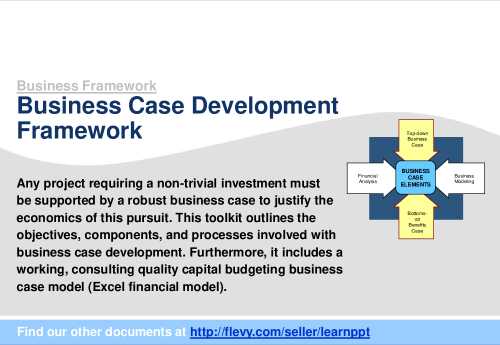
The Business Case is an instrumental tool in both justifying a project (requiring a capital budgeting decision), as well as measuring the project's success. The Business Case model typically takes the form of an Excel spreadsheet and quantifies the financial components of the project, [read more]
Do You Want to Implement Business Best Practices?
You can download in-depth presentations on 100s of management topics from the FlevyPro Library. FlevyPro is trusted and utilized by 1000s of management consultants and corporate executives.
For even more best practices available on Flevy, have a look at our top 100 lists:
These best practices are of the same as those leveraged by top-tier management consulting firms, like McKinsey, BCG, Bain, and Accenture. Improve the growth and efficiency of your organization by utilizing these best practice frameworks, templates, and tools. Most were developed by seasoned executives and consultants with over 20+ years of experience.
Readers of This Article Are Interested in These Resources
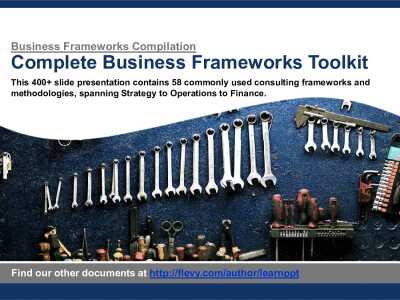
This is a very comprehensive document with over 400+ slides--covering 58 common management consulting frameworks and methodologies (listed below in alphabetical order). A detailed summary is provided for each business framework. The frameworks in this deck span across Corporate Strategy, [read more]
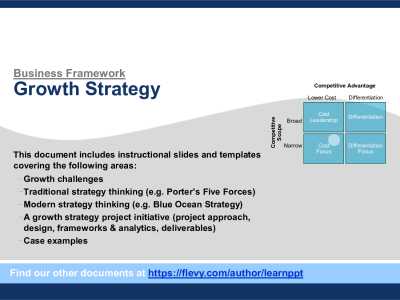
The reality is: all businesses face the challenge of achieving sustainable Growth. They need viable Growth Strategies.
So, what is Growth Strategy?
It is the organization's high-level Corporate Strategy Plan that outlines everything the organization needs to do to achieve its goals for [read more]
Recent McKinsey research surveyed a large set of global executives and suggests that many companies, these days, are in a nearly permanent state of organizational flux. A rise in efforts in Organizational Design is attributed to the accelerating pace of structural change generated by market [read more]
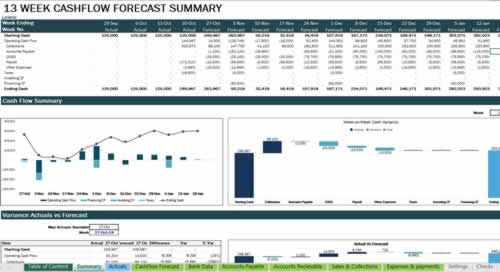
This comprehensive and user-friendly template is designed to help businesses efficiently manage their cash flow with accuracy and flexibility. Ideal for SMEs, the template provides tools to forecast, track, and analyze cash flow over a 13-week horizon.
Key Features:
Customizable Settings: [read more]
 Market Analysis is a critical strategic function. It provides the insights necessary to understand market dynamics, consumer behavior, and the competitive landscape. As a foundational element of