Editor’s Note: This is a series of articles on best practices related to KPI selection and implementation. These resources are provided in support of the Flevy KPI Library, one of the largest available databases of business KPIs. Having a centralized library of KPIs saves users significant time and effort in researching and developing metrics, allowing them to focus more on analysis, implementation of strategies, and other more value-added activities.
* * * *
 In the current fast-paced and ultra-competitive business environment, the ability to quickly interpret and act on data is critical. “KPI dashboards” emerge as vital instruments, turning the tide of data complexity into strategic advantage. These visual tools not only simplify the interpretation of complex data, but also amplify the decision-making process, enabling leaders to navigate through the noise with clarity and precision.
To explore the universe of potential KPIs for inclusion your KPI dashboard, peruse our Flevy KPI Library.
What Are KPI Dashboards
The evolution of KPI dashboards parallels the evolution of business intelligence, from rudimentary charts to sophisticated, interactive decision-making tools. At its core, an effective dashboard provides a snapshot of performance, encapsulating various metrics in an intuitive visual format. The anatomy of a successful dashboard is multifaceted, encompassing thoughtful design, relevant metrics, and adaptability. It’s not just about displaying data–it’s about presenting it in a way that is immediately actionable and aligned with the operational pulse of the organization.
As we delve into the components of an impactful dashboard, it becomes clear that each element, from layout to visualization choice, plays a pivotal role in its effectiveness. The layout must be intuitive, guiding the viewer naturally through the most critical data points. Visualizations should be selected not just for aesthetic appeal but for their ability to convey complex information quickly and clearly. The right combination of these elements transforms a simple display into a powerful tool for insight and action.
The Art and Science of KPI Dashboard Design
The design of a KPI dashboard is both an art and a science, requiring a balance of aesthetic appeal and functional clarity. The principles of effective design revolve around understanding the end-user and what they need to accomplish.
Simplicity is key. A cluttered dashboard is as ineffective as a cluttered mind. Each element should serve a purpose, contributing to the overall narrative of the data.
Choosing the right visualization techniques is crucial. From bar charts to heat maps, the variety of available options means there’s always a tool for the task, but the art lies in matching the visualization to the data and the decision-making needs of the user. Here are 10 common types of data visualization:
- Bar Charts: Useful for comparing quantities across different categories. Best for discrete data or categorical data when you want to show the size of components relative to each other.
- Line Graphs: Ideal for displaying data trends over time. They are particularly effective for showing changes in a few discrete data points.
- Pie Charts: Useful for showing percentages or proportions of a whole. They are best used when the total of your numbers is 100% and you have fewer than six categories to compare.
- Histograms: Similar to bar charts but used for continuous data where the bars represent the frequency of occurrence of data points in successive intervals.
- Scatter Plots: Great for showing the relationship between two different variables or for detecting patterns, clusters, or outliers.
- Heat Maps: Useful for comparing different categories with color variations. They are especially good for visualizing matrices or tables of numbers.
- Area Charts: Similar to line graphs but the area under the lines are filled with colors or patterns. Useful for demonstrating how different components contribute to the whole over time.
- Bullet Graphs: Serve as a variation of a bar graph but designed to address some of the problems that gauges and meters face. They are used to display performance data in a richer, more space-efficient manner.
- Box and Whisker Plots: Useful for showing the distribution of a dataset. It can tell you about your outliers and what their values are.
- Funnel Charts: Often used to represent stages in a sales process and show the amount of potential revenue for each stage.
When selecting the most appropriate visualization, let’s keep in mind the following considerations:
- Nature of the Data: Understand whether your data is categorical, continuous, or time-series. Bar charts are good for categorical data, line graphs for time-series data, and scatter plots for showing relationships in continuous data.
- Objective of the Analysis: Identify what you’re trying to communicate. If it’s a part-to-whole relationship, consider a pie chart or a stacked bar chart. For trends, use line graphs. For distributions, consider histograms or box plots.
- Number of Variables: Determine how many variables you need to show in a single chart. Scatter plots are great for two variables, but for more complex data, consider multi-dimensional charts or heat maps.
- Comparison Needs: If you need to compare different categories or track changes over time, bar charts and line graphs are typically the most effective.
- Audience: Always consider who will be viewing these visualizations. Ensure that the chart type you choose will be easily understood by your audience. Avoid overly complex visualizations for a general audience.
- Clarity and Avoiding Misinterpretation: Ensure that the visualization you choose clearly communicates the intended message and is not prone to misinterpretation. Sometimes simpler visualizations are more effective in conveying the necessary insights.
By carefully considering these aspects, we can select the most appropriate data visualization for your KPIs, enhancing the understanding and effectiveness of your data reporting. Each type of visualization has its strengths and specific use cases, so aligning the choice of visualization with the nature of your KPIs and the story you want to tell is key.
Implementing and Utilizing KPI Dashboards
Integrating KPI dashboards into business processes marks the transition from design to action. For dashboards to have a tangible impact, they must be embedded into the decision-making rhythms of the organization. This integration involves not just technical deployment but also cultural adaptation. Staff need to be trained not only on how to use the dashboards but also on how to interpret and act on the insights they provide. Cultivating a data-driven culture is as much about mindset as it is about skillset.
The successful utilization of KPI dashboards hinges on their alignment with the organization’s strategic objectives and operational realities. They should be flexible, evolving with the business and its data needs. This section discusses strategies for effective implementation, including technical considerations, training programs, and tips for fostering an organizational culture that embraces data-driven decision-making.
Case Studies
Real-world examples serve as the most compelling testament to the power of KPI dashboards and visualization techniques. Consider a leading financial institution that revamped its performance strategy by integrating a sophisticated dashboard system. This system provided real-time insights into market trends, customer behavior, and internal performance metrics, leading to improved decision-making and a notable increase in profitability. The success of this initiative was rooted in a keen understanding of user needs, resulting in a dashboard that was not only visually compelling but deeply integrated with the institution’s strategic processes.
Industry insights also reveal the diverse applications of dashboards across sectors. In healthcare, for instance, dashboards are used to monitor patient outcomes, optimize treatment plans, and manage operational efficiency. In retail, they track customer preferences, inventory levels, and sales performance. Each industry tailors its approach to visualization based on specific strategic objectives, regulatory environments, and operational dynamics. This section explores a variety of these case studies and best practices, offering a window into the transformative potential of well-implemented KPI dashboards.
The Future of KPI Dashboards and Visualization
As we look to the horizon, the future of KPI dashboards and visualization techniques is illuminated by advances in technology and shifts in business practices. Emerging trends such as Artificial Intelligence, Machine Learning, and interactive data displays are set to redefine the landscape of business intelligence. Predictive analytics, for instance, are enabling organizations to not only assess current performance but also to forecast future trends, opening new vistas for strategic planning and competitive advantage.
Preparing for the future means staying abreast of these developments and understanding how they can be harnessed to enhance business strategy. It involves a commitment to continuous learning and adaptation, ensuring that your organization’s approach to data visualization remains cutting-edge. This section discusses these emerging trends and offers guidance on how businesses can position themselves to take full advantage of the next wave of innovations in KPI dashboard and visualization technology.
So, is your organization, already utilizing KPI dashboards?
To assess your current tools and processes around KPI dashboard design, ask: Are they providing the clarity, insight, and impact that you need? Are they aligned with your strategic objectives? Are they adaptable to the changing landscape of your industry?
Embrace the principles and insights outlined in this article to transform your organization’s approach to Performance Management. Invest in the right tools, cultivate the necessary skills within your team, and foster a culture that values data-driven decision-making.
As a reminder, to explore the universe of potential KPIs, peruse our Flevy KPI Library. Each KPI in our database includes detailed descriptions, potential business insights, measurement processes, and standard formulas, designed to enhance Strategic Decision Making and Performance Management for executives and business leaders.
Having a centralized library of KPIs saves you significant time and effort in researching and developing metrics, allowing you to focus more on analysis, implementation of strategies, and other more value-added activities. This vast range of KPIs across various industries and functions offers the flexibility to tailor Performance Management and Measurement to the unique aspects of your organization, ensuring more precise monitoring and management.
Do You Want to Implement Business Best Practices?
You can download in-depth presentations on Dashboard Design and 100s of management topics from the FlevyPro Library. FlevyPro is trusted and utilized by 1000s of management consultants and corporate executives.
For even more best practices available on Flevy, have a look at our top 100 lists:
These best practices are of the same as those leveraged by top-tier management consulting firms, like McKinsey, BCG, Bain, and Accenture. Improve the growth and efficiency of your organization by utilizing these best practice frameworks, templates, and tools. Most were developed by seasoned executives and consultants with over 20+ years of experience.
Readers of This Article Are Interested in These Resources
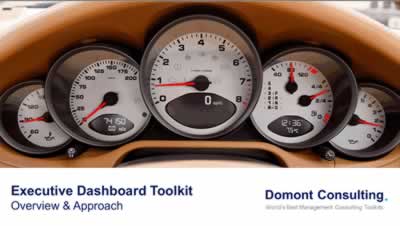
200-slide PowerPoint presentation
This Executive Dashboard Toolkit was created by ex-McKinsey, Deloitte & BCG Management Consultants, and JP Morgan Investment Bankers. It includes all the Excel and PowerPoint dashboards required to monitor and optimize the performance of any organization, function, team, investment portfolio or
[read more]
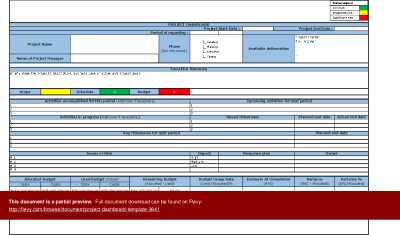
Excel workbook
Use this project dashboard to give team members and stakeholders a snapshot of your project, including an executive summary, completed and upcoming activities, milestones, risks, budget information and more.
The Project Dashboard Template offers a comprehensive view of your project's key metrics
[read more]
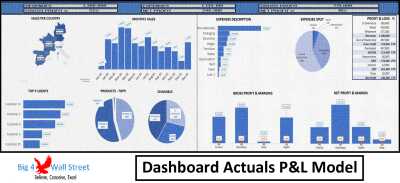
Excel workbook
Dashboard Actuals P&L Model generates a dynamic dashboard that can be filtered both by country and by month. The dashboard is based on 2 tables, namely Revenue Table and Expense Table.
The model is intended to be used in a specific calendar year and allows the user to enter actual data for both
[read more]
12-slide PowerPoint presentation
The business metrics and KPI is a professional way to track your business performance and measure success?
With a table of contents included, you can easily navigate to the section you need and view a summary dashboard, quarterly summary, top revenue sources, tasks dashboard, test case
[read more]