Editor's Note: Take a look at our featured best practice, Digital Transformation Strategy (145-slide PowerPoint presentation). Digital Transformation is being embraced by organizations across most industries, as the role of technology shifts from being a business enabler to a business driver. This has only been accelerated by the COVID-19 global pandemic. Thus, to remain competitive and outcompete in today's fast paced, [read more]
* * * *
In today’s interconnected global economy, Logistics and Transportation serve as the backbone of efficient supply chains and effective market reach. Logistics and Transportation encompasses the strategic planning, execution, and management of moving goods from origin to destination as efficiently as possible.
With the rise of e-commerce, just-in-time manufacturing, and global sourcing, Logistics and Transportation have become more critical than ever, directly impacting an organization’s ability to compete and satisfy customer demands.
This article aims to explore the pivotal role that KPIs within Logistics and Transportation play in enhancing operational efficiency, reducing costs, and improving overall customer satisfaction. We will highlight how leveraging key performance indicators (KPIs) in Logistics and Transportation can provide organizations with the insights needed to make informed decisions, streamline operations, and achieve strategic objectives. By examining these KPIs, executives and senior managers will gain an understanding of how to optimize logistics operations, enhance transportation strategies, and ultimately, drive business success in a competitive landscape.
Importance of Logistics & Transportation
As organizations strive to meet the increasing demands of customers for faster and more reliable delivery, the importance of Logistics and Transportation cannot be overstated. Logistics and Transportation directly influences cost structures, customer satisfaction, and the agility of businesses to respond to market changes.
Effective management of Logistics and Transportation can lead to significant competitive advantages, including reduced operational costs, enhanced supply chain visibility, and improved customer loyalty.
Challenges with Improving Logistics & Transportation
Navigating the complexities of global logistics networks presents numerous challenges, including optimizing route planning, managing carrier relationships, and ensuring the timely delivery of goods amidst unforeseen disruptions. Additionally, organizations must balance the need for cost efficiency with sustainability goals and regulatory compliance.
The KPIs associated with Logistics and Transportation address these challenges by offering metrics to evaluate performance, identify bottlenecks, and implement improvements. Through a strategic focus on these KPIs, organizations can overcome common obstacles, enhance their logistics and transportation operations, and align them more closely with their broader business strategies.
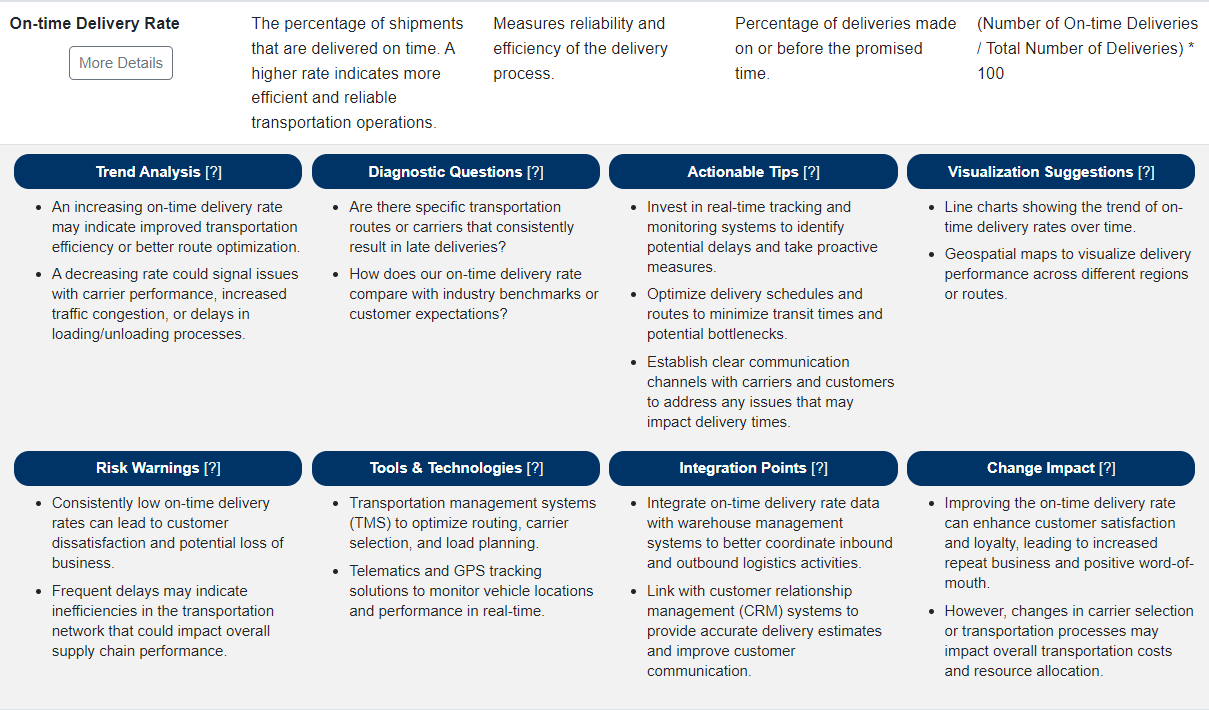
Definition: The percentage of deliveries that arrive at their destination within the scheduled time frame.
Relevance: This KPI is crucial for assessing the reliability of the logistics operations, directly impacting customer satisfaction and loyalty.
2. Freight Cost as Percentage of Sales
Definition: The total freight costs divided by total sales, expressed as a percentage.
Relevance: It helps organizations gauge the efficiency of their transportation spending in relation to their revenue generation.
3. Carrier Compliance Rate
Definition: The percentage of times carriers meet the agreed-upon delivery and service standards.
Relevance: High compliance rates indicate reliable carrier performance, essential for maintaining smooth operations and customer satisfaction.
4. Average Miles per Gallon (MPG) of Fleet
Definition: The average distance traveled per gallon of fuel by the transportation fleet.
Relevance: This KPI is key for monitoring fuel efficiency, a significant factor in reducing transportation costs and environmental impact.
5. CO2 Emissions per Ton-Mile
Definition: The amount of carbon dioxide emissions produced per ton-mile of freight transported.
Relevance: Important for assessing the environmental sustainability of logistics operations, increasingly a factor in customer and partner decisions.
6. Cost per Shipment
Definition: The total cost associated with transporting a shipment from origin to destination.
Relevance: Directly affects the bottom line, making it essential for identifying opportunities to reduce logistics expenses.
7. Delivery in Full on Time (DIFOT) Rate
Definition: The rate at which orders are delivered in full, without backorders or shortages, and on time.
Relevance: A comprehensive measure of logistics effectiveness, impacting customer satisfaction and operational efficiency.
8. Damage-Free Delivery Rate
Definition: The percentage of deliveries made without any damage to the goods.
Relevance: Essential for quality assurance, reducing returns and associated costs, and maintaining customer trust.
9. Fleet Utilization Rate
Definition: The ratio of active transportation vehicles to the total fleet over a specific period.
Relevance: High utilization rates indicate efficient use of assets, contributing to cost savings and increased profitability.
10. Order to Delivery Lead Time
Definition: The time taken from when an order is placed until it is delivered to the customer.
Relevance: A critical metric for evaluating the speed and efficiency of the logistics process, affecting customer satisfaction and inventory levels.
To dig deeper into any of these KPIs, we invite you to explore the Flevy KPI Library, which allows you to drill down into 12 attributes for each KPI in the database. Here is an example for our top ranked KPI, On-time Delivery Rate:
Case Studies and Success Stories
Streamlining Operations with On-time Delivery Rate
A leading e-commerce platform was experiencing customer dissatisfaction due to late deliveries. Focusing on the “On-time Delivery Rate” KPI, the company aimed to identify bottlenecks and improve its logistics operations.
The company invested in advanced route optimization software and enhanced its carrier performance monitoring. Training programs were also introduced for logistics staff to improve handling and dispatch times.
Outcome: These measures led to a substantial improvement in the on-time delivery rate, from 85% to 98% within six months. Customer satisfaction scores saw a corresponding increase, and the platform experienced a significant uptick in repeat purchases.
Lessons Learned: Prioritizing on-time delivery and investing in technology and training can dramatically enhance customer satisfaction and loyalty. Continuous monitoring and optimization of logistics processes are essential for maintaining high performance.
Reducing Environmental Impact with CO2 Emissions per Ton-Mile
A multinational manufacturing company committed to sustainability aimed to reduce its logistics carbon footprint. The “CO2 Emissions per Ton-Mile” KPI was identified as a critical measure for achieving this goal.
The company transitioned to a more fuel-efficient fleet and optimized its shipping routes to minimize unnecessary mileage. It also increased its use of renewable energy sources for warehouse operations.
Outcome: These initiatives led to a 25% reduction in CO2 emissions per ton-mile over two years, contributing to the company’s sustainability goals and improving its brand image among eco-conscious consumers.
Lessons Learned: Focusing on environmental KPIs like CO2 emissions per ton-mile can guide companies in making impactful sustainability improvements. Investing in fuel efficiency and renewable energy not only reduces environmental impact but can also offer long-term cost savings.
Additional Resources and Further Reading
Foremost, if you are in the process of selecting or refreshing your Supply Chain Management KPIs, take a look at the Flevy KPI Library. With over 15,000+ KPIs, our KPI Library is one of the largest databases available. Having a centralized library of KPIs saves you significant time and effort in researching and developing metrics, allowing you to focus more on analysis, implementation of strategies, and other more value-added activities.
Here are other KPI Strategy and KPI Management articles we’ve published:
Principles of KPI Selection. This article breaks down the 8 guiding principles to KPI selection and provides several case studies on how to use these principles in practice.
Principles of KPI Maintenance. It’s important to recognize that as market conditions and strategic objectives evolve, so too must the KPIs. This article provides a disciplined approach to maintaining KPIs.
KPI Dashboard Design & Visualization. Learn the art and science of designing KPI dashboards, including types of data visualization and how to choose among them.
Anatomy of a Strong KPI. Learn what makes a KPI effective, discussing the characteristics of KPIs that are most impactful and how they can drive strategic business decisions.
10 Common Pitfalls in KPI Implementation. Learn how to identify and remediate the 10 most common pitfalls in KPI implementation. If left unfixed or as unknowns, these pitfalls can have disastrous, long-term impacts on the organization.
KPIs and Organizational Alignment. This article discusses the concepts of strategic, tactical, and operational KPIs; as well as balancing individual, team, and organizational objectives.
Integrating KPIs into Employee Performance. This article discusses 5 methods for integrating KPIs into individual performance metrics; and includes several case studies.
Future-Proofing KPIs. Understand how to “future-proof” KPIs by understanding the impacts of emerging market trends, emerging technologies, and evolving consumer behaviors on KPIs.
KPIs and Digital Transformation. All organizations are undergoing Digital Transformations. Learn how to define, select, and implement relevant Digital Transformation KPIs.
The Business Case is an instrumental tool in both justifying a project (requiring a capital budgeting decision), as well as measuring the project's success. The Business Case model typically takes the form of an Excel spreadsheet and quantifies the financial components of the project, [read more]
Do You Want to Implement Business Best Practices?
You can download in-depth presentations on 100s of management topics from the FlevyPro Library. FlevyPro is trusted and utilized by 1000s of management consultants and corporate executives.
For even more best practices available on Flevy, have a look at our top 100 lists:
These best practices are of the same as those leveraged by top-tier management consulting firms, like McKinsey, BCG, Bain, and Accenture. Improve the growth and efficiency of your organization by utilizing these best practice frameworks, templates, and tools. Most were developed by seasoned executives and consultants with over 20+ years of experience.
Readers of This Article Are Interested in These Resources
This is a very comprehensive document with over 400+ slides--covering 58 common management consulting frameworks and methodologies (listed below in alphabetical order). A detailed summary is provided for each business framework. The frameworks in this deck span across Corporate Strategy, [read more]
The reality is: all businesses face the challenge of achieving sustainable Growth. They need viable Growth Strategies.
So, what is Growth Strategy?
It is the organization's high-level Corporate Strategy Plan that outlines everything the organization needs to do to achieve its goals for [read more]
Recent McKinsey research surveyed a large set of global executives and suggests that many companies, these days, are in a nearly permanent state of organizational flux. A rise in efforts in Organizational Design is attributed to the accelerating pace of structural change generated by market [read more]
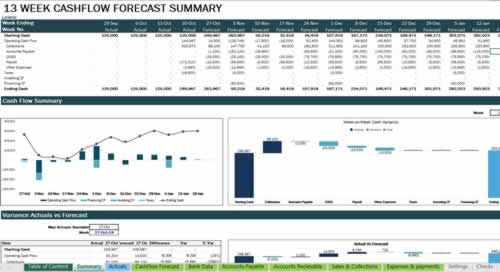
This comprehensive and user-friendly template is designed to help businesses efficiently manage their cash flow with accuracy and flexibility. Ideal for SMEs, the template provides tools to forecast, track, and analyze cash flow over a 13-week horizon.
Key Features:
Customizable Settings: [read more]
 In today’s interconnected global economy,