Editor's Note: Take a look at our featured best practice, Ecommerce Financial Model (Excel workbook). Model Options:
This template is a detailed and user-friendly financial model that considers an e-commerce business's specifics.
By Taking into account key assumptions such as traffic from different sources, conversion rates, the average purchase value for different product categories, and the [read more]
* * * *
At checkout, buy now, pay later is a single button. Behind it sits a lending business that, in Affirm’s case, processed $50.2 billion in gross merchandise volume in the fiscal year that ended June 30, 2026. Much of that volume cost the shopper nothing extra: a June 2026 Federal Reserve note found that more than 60% of BNPL issuance carried a 0% APR.
The revenue has to come from somewhere else, and for the largest providers it comes from five places: merchant discount fees, consumer interest, card and network fees, the spread on funding, and a thin layer of late fees and adjacent income. How much each contributes varies by provider, and those differences explain much of why companies turn a profit.
Engine 1: Merchant Discount Fees
For the classic pay-in-four product, the merchant is the customer that pays. Retailers accept a discount on each transaction in exchange for higher conversion, larger baskets, and access to shoppers who might otherwise abandon the cart.
That discount is steep by payment standards. The Federal Reserve note cites academic research estimating BNPL merchant fees at 5% to 8% of the purchase price, compared with 2% to 3% for credit cards. In its original 2021 inquiry into the sector, the Consumer Financial Protection Bureau put the typical range merchants were willing to pay at 3% to 6%.
For a retailer, the higher fee works like a cost of closing the sale. Shoppers who might have abandoned the cart go ahead with the purchase, and the retailer is paid in full upfront, so collecting a missed installment months later falls to the provider. The early pay-in-four companies leaned heavily on that arrangement. In 2017, an Afterpay co-founder said retailers accounted for about 80% of the company’s revenue, with late fees making up the other 20%.
Merchants often fund the promotions as well. In Affirm’s second fiscal quarter of 2026, which included a 0% APR sales event the company called the Big Nothing, 39% of all transactions carried 0% APR, and Affirm said merchant funding covered that pricing.
Engine 2: Consumer Interest Income
Monthly installment plans work differently. On a six-month loan for a mattress or a two-year plan for a laptop, shoppers often pay interest at a rate set by their credit profile.
Affirm has been moving more of its business toward those loans. On its fiscal fourth-quarter 2026 earnings call, management said more than 80% of the loans made through Affirm’s own app and card now carry interest. At a retailer’s checkout, the merchant decides whether to pay for a 0% promotion. When a customer returns through Affirm’s app instead, Affirm sets the terms.
This engine also concentrates risk. Interest income only holds value if credit losses stay contained, which makes underwriting the core competency of any BNPL lender. Affirm reported a 30-day delinquency rate of 2.5% on monthly installment loans in its fiscal fourth quarter, excluding Peloton and Pay in X loans.
Engine 3: Card and Network Revenue
Cards are the newest part of the model. Affirm’s physical and virtual cards let a shopper split a purchase into installments at stores that have never signed up with Affirm. Each swipe generates interchange, which Affirm reports as card network revenue.
The card grew quickly in fiscal 2026. Active cardholders reached 5.2 million, up 125% from a year earlier, and card GMV rose 159% in the second fiscal quarter alone. Promotions followed the shoppers: by that quarter, 0% APR purchases made up almost 20% of card volume. Across all of Affirm’s products, the average active consumer made 7.0 transactions over the year, up 20%.
Engine 4: Capital Markets and Funding Efficiency
Most large providers fund loans through warehouse credit lines, asset-backed securities, and forward-flow agreements that sell loans to institutional buyers, then earn the spread between what the loans yield and what the capital costs.
That spread moved sharply in Affirm’s favor this year. In March 2026, the company priced its third consecutive revolving asset-backed deal at a blended yield under 5%, and its average annualized cost of funds fell to the lowest level in three and a half years. Transaction costs, which include funding, dropped to 4.7% of GMV in the third fiscal quarter from 5.5% a year earlier. Cheaper capital gives lenders room to cut merchant pricing, subsidize more 0% offers, or keep the difference as margin.
Across six large pay-in-four lenders, 4.1% of loans were assessed a late fee in 2023, down from 5.2% in 2022, and the late fees actually collected came to 0.18% of gross merchandise volume.
Affirm doesn’t charge late fees at all. A Congressional Research Service report on the sector lists advertising and subscription services as additional revenue at some providers.
The Metric That Ties It Together
Revenue alone overstates BNPL economics because lending carries heavy variable costs: funding, credit losses, processing, and loan servicing. Affirm addresses this by reporting Revenue Less Transaction Costs (RLTC), which strips out those costs.
The fiscal 2026 numbers illustrate the gap. Affirm processed $50.2 billion in gross merchandise volume and generated $4.26 billion in revenue, roughly 8.5% of GMV. RLTC came to $2.08 billion, or about 4.1% of GMV, up from $1.48 billion the prior year. Roughly half of every revenue dollar goes to funding and servicing the loan. Analysts evaluating any BNPL provider should look for an equivalent contribution metric rather than headline revenue.
Horizontal Scale Versus Vertical Specialization
Affirm, Klarna, Afterpay and PayPal chase the same broad pool of retail and online spending, and the purchases are small by lending standards. In the CFPB’s 2023 data, the average pay-in-four loan was $135, and PayPal caps its Pay in 4 product at $1,500. At that size, a lender’s edge comes mostly from volume and lower funding costs.
Other providers have organized around a single industry, with healthcare, dental, and aesthetics the most developed. A patient financing an implant or a series of treatments may borrow thousands of dollars over several years, and healthcare lenders set limits ranging from $20,000 to $65,000. Pricing to the practice varies just as widely. Published comparisons of healthcare-focused alternatives to Affirm list starting merchant fees from under 2% to nearly 6%, depending on the provider and how its loans are structured.
A lender built around $135 purchases can win on speed and repeat use across thousands of retailers. Financing a multi-thousand-dollar treatment plan is a different job: it means underwriting larger balances, carrying terms that run for years, and fitting into a practice’s billing process, so merchant fees and risk appetite end up far apart between the two groups.
Case Example: Affirm’s Fiscal 2026
Affirm’s fiscal year ending June 30, 2026, shows the five engines working in combination. Merchant-funded 0% promotions drove volume at checkout. Interest-bearing loans dominated the direct-to-consumer channel. Card adoption more than doubled. Funding costs declined meaningfully. Late fees played no material role, as Affirm does not charge them.
The result was 36% GMV growth in the fourth quarter, the company’s eleventh consecutive quarter above 30%, alongside a 30% adjusted operating margin. For fiscal 2027, management guided to GMV above $64 billion, with revenue holding near 8.5% of GMV.
The Strategic Takeaway
BNPL is often described as a consumer product. Economically, it operates as a merchant acquisition service, a consumer lender, and a capital markets business. Providers that sustain profitability balance all five engines, lowering funding costs, controlling credit risk, and matching product design to the industries they serve.
For executives evaluating a partnership, an investment, or a competitive threat, the relevant question goes beyond who offers 0% interest. It is which part of the revenue stack pays for it.
Frequently Asked Questions
Why do merchants pay more for BNPL than for credit cards?
Merchants pay for incremental sales, not payment processing alone. The fee covers conversion lift, larger average orders, and the transfer of credit risk to the provider.
Is a 0% APR loan unprofitable for the provider?
Not necessarily. Merchants typically fund the promotion through a higher discount fee, and the provider gains a customer who may later use interest-bearing products.
What is the biggest risk to the model?
Funding costs and credit losses. A rise in interest rates or delinquencies compresses the spread between revenue and transaction costs faster than most other variables.
How should a merchant evaluate a BNPL partner?
Compare the total fee against measured lift in conversion and order value, then weigh approval rates, loan limits, and fit with the merchant’s industry.
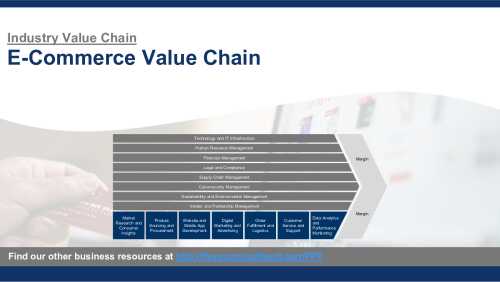
An Industry Value Chain is a visual representation of the series of steps an organization in a specific industry takes to deliver a product or service to the market. It captures the main business functions and processes that are involved in delivering the end product or service, illustrating how [read more]
Do You Want to Implement Business Best Practices?
You can download in-depth presentations on Ecommerce and 100s of management topics from the FlevyPro Library. FlevyPro is trusted and utilized by 1000s of management consultants and corporate executives.
For even more best practices available on Flevy, have a look at our top 100 lists:
These best practices are of the same as those leveraged by top-tier management consulting firms, like McKinsey, BCG, Bain, and Accenture. Improve the growth and efficiency of your organization by utilizing these best practice frameworks, templates, and tools. Most were developed by seasoned executives and consultants with over 20+ years of experience.
Readers of This Article Are Interested in These Resources
Growth Hacking is neither "scoring some quick wins to kick-start growth" nor "breaking into something one should not." Growth Hacking actually involves a consistent, scientific process to work towards business growth.
Growth Hacking is valuable for large enterprises, but more so for small [read more]
This e-commerce business plan is a detailed roadmap that will guide you in starting a successful e-commerce business. It has pre-written content, including important sections like market research, product offerings, marketing strategies, and financial projections.
You can use this sample plan as [read more]
Financial technology (better known as fintech) is used to describe new technology that seeks to improve and automate the delivery and use of financial services. At its core, fintech is utilized to help companies, business owners, and consumers better manage their financial [read more]
An e-commerce platform for physical products is a digital solution that enables businesses to sell tangible goods online. It provides tools for listing products, managing inventory, processing payments, handling shipping, and tracking orders. Customers can browse, purchase, and review items through [read more]
 At checkout, buy now, pay later is a single button. Behind it sits a lending business that, in Affirm’s case, processed $50.2 billion in gross merchandise volume in the fiscal year that ended June 30, 2026. Much of that volume cost the shopper nothing extra: a June 2026 Federal Reserve note found that more than 60% of BNPL issuance carried a 0% APR.