Editor's Note: Take a look at our featured best practice, Key Performance Indicators (KPIs): Best Practices (21-slide PowerPoint presentation). There are clear and measurable differences that exist between organizations that use Key Performance Indicators (KPIs) to monitor and assess performance and those that use KPIs to guide and drive performance improvements. Data-driven and customer-oriented leaders use KPIs to transform their [read more]
Also, if you are interested in becoming an expert on Performance Management, take a look at Flevy's Performance Management Frameworks offering here. This is a curated collection of best practice frameworks based on the thought leadership of leading consulting firms, academics, and recognized subject matter experts. By learning and applying these concepts, you can you stay ahead of the curve. Full details here.
* * * *
There are leading and lagging indicators in business. It is important that managers understand the difference between them and ensure they have both types of metrics to get an accurate picture of performance. However, there are also some important issues to watch out for.
All performance measures are, by definition, backward looking. They tell us what has already happened. Current trends are on merging the data and information from backward looking metrics or performance indicators with the forward-looking insights gleaned from predictive analytics.
However, this focus on the future is simply a natural step forward from the work that has been done in understanding the relationships between leading and lagging indicators.
The use of the terms ‘leading’ and ‘lagging’ indicators has become a standard part of the performance measurement and management approaches in many companies. The term “leading indicator” has been used in the field of economics since the early years of the 20th century. In economics, a leading indicator is defined as a measurable economic factor that changes before the economy starts to follow a particular pattern or trend. Leading indicators are used to predict changes in the economy, but are not always accurate. (We shall come back to this.)
Switching to the world of organizational performance, a leading indicator is one that is focused on the factors that predict likely future results/outcomes, whereas a lagging indicator is focused on the result/outcome itself and whether the expected result was achieved.
The popularity of management tools, like the Balanced Scorecard, largely stemmed from the argument that financial performance measures (such as profit, etc) were lagging measures (so provided information on what had already happened) and no longer provided a complete enough picture of performance in what was then (the early 1990s) the beginnings of the knowledge era (they provide an even less complete picture in 2015!).
What was required for a broader understanding of performance, was the inclusion of leading indicators, such as the new product development pipeline (a leading indicator of future financial results) and other indicators that looked more at the development of new organizational capabilities or employee skills. As simple examples, customer satisfaction might be a leading indicator of customer loyalty and employee satisfaction might be leading indicators of employee retention.
Although of course useful for providing a broad performance overview and for understanding causality between strategic objectives, both lagging and leading indicators do have their shortcomings, which provide watch-outs for executives. Let’s begin with lagging indicators.
Because they tell us what has already happened, lagging indicators might provide insights too late for management to do anything about it – irreparable damage might already have been done. For example, simply finding out that most of your key customers have defected to the competition will not likely keep you in business. It’s too late! Even if not too late, lagging indicators may not offer useful or insightful information about what is causing poor results and where to focus the improvement interventions required to improve performance. What exactly is causing the downward trend in customer retention and what can we do about it?
Another issue with lagging measures is that there is a tendency (prevalent in the government sector) to focus on outputs (a numbers-based measure to what has happened) rather than outcomes (what did we really want to achieve). As a an illustration from the health service, a lag measure of number of patients treated is often used: this is relatively easy to hit by simply reducing the time spent with patients, which will negatively impact the more important outcome lag measure of correct diagnosis and treatment plan (much harder to measure).
The value of leading indicators is that they provide data and information on what is likely to result in the future (as captured in lagging measures). This is why we require leading indicators
However, leading indicators are not without their issues. Note from the earlier definition from economics, “Leading indicators are used to predict changes in the economy, but are not always accurate.” They provide insights into what mighthappen and not necessarily what will happen. For instance, we now know that a high satisfaction with a product might not, in these fast-moving times, always be a good predictor of likely repurchase (many people were very happy with their Nokia mobile phones, but that didn’t stop then defecting to Apple when the iPhone was released). Typically, organizations need to understand and analyze the contributions of a number of leading indicators to get a firmer view of likely lag performance.
Moreover, leading indicators are much harder to identify (are often company specific and therefore the data might not be available to built the indicator) than their lag counterparts (which are more often industry wide and therefore easy to build, measure, and indeed benchmark).
This often means companies overvalue the lagging measures and undervalue leading indicators, even if the latter are in reality much more useful. Leaders should beware such performance sapping cul-de-sacs and keep in mind that the purpose of measurement (lag or lead) is to identify and act on improvement opportunities. It is about having a data-driven conversation about performance and improvements, and not a conversation about data!
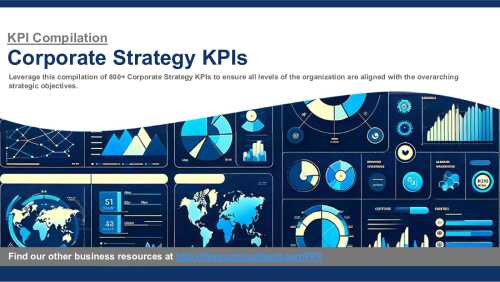
This presentation is a comprehensive collection of Key Performance Indicators (KPI) related to Corporate Strategy. A KPI is a quantifiable measure used to evaluate the success of an organization, employee, or process in meeting objectives for performance.
KPIs are typically implemented at [read more]
Want to Achieve Excellence in Performance Management?
Gain the knowledge and develop the expertise to become an expert in Performance Management. Our frameworks are based on the thought leadership of leading consulting firms, academics, and recognized subject matter experts. Click here for full details.
Performance Management (also known as Strategic Performance Management, Performance Measurement, Business Performance Management, Enterprise Performance Management, or Corporate Performance Management) is a strategic management approach for monitoring how a business is performing. It describes the methodologies, metrics, processes, systems, and software that are used for monitoring and managing the business performance of an organization.
As Peter Drucker famously said, "If you can't measure it, you can't improve it."
Having a structured and robust Strategic Performance Management system (e.g. the Balanced Scorecard) is critical to the sustainable success of any organization; and affects all areas of our organization.
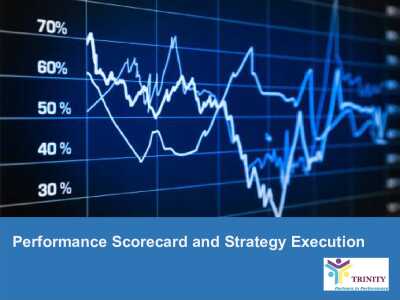
Elevate your team's performance and strategy execution to new heights with the Performance Scorecard Framework, crafted by former strategy consultants from elite firms such as BCG and EY. This unique tool combines the strengths of the Balanced Scorecard with an exclusive proprietary [read more]
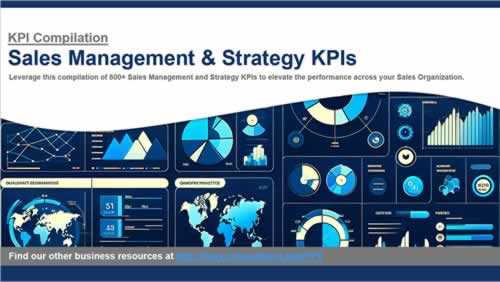
This presentation is a comprehensive collection of over 600+ Key Performance Indicators (KPI) related to Sales Management and Strategy. Leverage these Sales KPIs to elevate the performance across your Sales Organization.
A KPI is a quantifiable measure used to evaluate the success of an [read more]
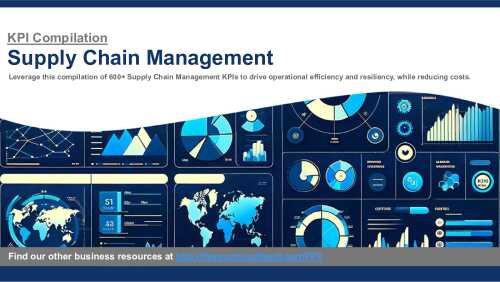
This presentation is a comprehensive collection of Key Performance Indicators (KPI) related to Supply Chain Management (SCM). A KPI is a quantifiable measure used to evaluate the success of an organization, employee, or process in meeting objectives for performance.
KPIs are typically [read more]
This document provides a collection of 100+ Key Performance Indicators (KPIs) related to the Supply Chain functions listed further below.
Keeping in mind that each organization is different, the enclosed KPIs are intended as a general reference and their relevance depends on the specific [read more]