Editor's Note: Take a look at our featured best practice, Comprehensive Guide to Financial Statement Analysis (89-slide PowerPoint presentation). This document provides a detailed step-by-step guide on how to analyse financial statements. Designed for anyone who wants to understand how to review financial data and interpret the findings, the document is split into the following sections:
Introduction to financial statements
1. Income [read more]
* * * *
Traders and analysts today operate in an environment where raw price data alone is no longer enough to compete effectively. The shift toward modern market analysis has been gradual but decisive, driven by the growing availability of real-time data, more sophisticated visualization technology, and a clearer understanding of how institutional activity actually shapes price.
Because of this, professional traders have access to a far different toolkit in 2026 than they did ten years ago, and navigating that toolkit has become a talent in and of itself.
From Price Charts to Market Microstructure
Traditional charting tools gave traders a historical record of where the price had been. What they could not show, however, was the mechanics behind each move. This limitation became increasingly apparent as markets grew faster and more fragmented.
Whereas candlestick charts reveal merely open, high, low, and close values, more advanced analytical methods reveal the complete market auction process by showing how much volume traded at each exact price level and whether aggressive sellers or buyers triggered those trades.
This deeper layer of analysis is what the category of financial market analysis tools has expanded to address. Rather than reacting to price after the fact, traders using these platforms can observe supply and demand dynamics forming in real time. The result is a meaningful shift in how entries, exits, and risk levels are determined.
The Core Technologies Powering Advanced Analysis
Analyzing market trends through modern platforms typically involves three interconnected data layers, each revealing a different dimension of market activity:
Footprint charts, which display the volume traded at every price tick within a bar, breaking down buy and sell activity to expose imbalances, absorption zones, and exhaustion signals
Volume profiles, which aggregate traded volume horizontally across price levels to identify high-activity nodes, the Point of Control, and low-volume rejection zones that often act as support or resistance
Depth of Market indicators, which provide a live view of resting limit orders on both sides of the book, help traders gauge current liquidity and anticipate where large participants are positioned.
Together, these tools form the foundation of what professional traders now call order flow analysis. The platforms that combine all three in a single, cohesive interface are particularly valued because switching between separate tools during live market hours introduces friction that costs both time and focus.
Where Software Capability Makes the Difference
The quality of the underlying platform matters enormously when working with this type of data. Processing tick-level information across multiple instruments simultaneously, rendering footprint charts without lag, and aggregating fragmented exchange prints into readable order flow all require purpose-built architecture.
This is precisely where dedicated stock market analysis software, designed specifically for real-time order and volume data, delivers a clear advantage over general-purpose charting platforms that have added these features as afterthoughts.
Professional platforms in this space specialize in order flow analysis, cluster analysis, volume market profile, and advanced technical analysis, processing raw data and visualizing it in an intuitive form with extensive filtering capabilities and flexible setups. That combination, depth of data paired with usability, is what separates tools built for serious traders from those built for mass appeal.
How Data-Driven Market Insights Are Reshaping Decision-Making
The move toward data-driven market insights has changed not just what traders look at, but how they think about risk and opportunity. When a trader can see, for instance, that a price level absorbed a large cluster of aggressive sell orders without breaking lower, that is actionable information about where demand is likely to hold.
Delta, the difference between buying and selling volume, can sometimes contradict a candle’s direction entirely, with a green candle showing negative delta, a divergence that often signals weakness in the move and potential reversal.
This kind of nuanced reading was simply unavailable with price-only tools. Furthermore, because this analysis is grounded in actual executed transactions rather than indicator formulas applied to price, it tends to hold up more consistently across different market conditions.
Market Research Technologies in 2026: A Practical Comparison
The table below outlines the key analytical layers that distinguish modern platforms from conventional charting tools:
Feature
Traditional Charting
Advanced Order Flow Platform
Price visualization
Open, high, low, close
Tick-level bid and ask breakdown
Volume display
Bar or line volume overlay
Volume at each price level per candle
Order book access
None
Real-time DOM with resting limit orders
Delta analysis
Not available
Buy minus sell volume per bar and price
Institutional activity
Inferred from price patterns
Visible through large trade filters and Smart Tape
Backtesting
Candle-based replay
Tick-by-tick historical replay with full order flow
Building a Practical Workflow with Market Analysis Tools
Adopting advanced market analysis tools effectively requires more than just subscribing to a platform. The most productive approach treats these tools as complementary layers rather than standalone signals. A reasonable workflow for the trader’s success might look like this:
Begin with the volume profile to identify the key price levels where the most activity has previously concentrated, establishing your structural framework for the session
Use footprint charts to observe how price behaves as it approaches those levels, watching for absorption, delta divergence, or aggressive one-sided volume that confirms or challenges the level’s relevance
Monitor the DOM in real time as price reaches those areas to gauge whether resting liquidity is thin or deep, which shapes both timing and position sizing.
The Road Ahead for Financial Market Analysis
The direction of travel in this space is toward greater integration and automation. The use of AI for predictive accuracy in trading is becoming standard, with firms leveraging machine learning for market microstructure analysis to uncover subtle patterns.
Even so, the foundational value of order flow and volume analysis remains intact: markets are driven by the aggregate actions of buyers and sellers, and tools that make those actions visible will continue to hold a central place in professional trading practice. For traders willing to invest in understanding these platforms thoroughly, the analytical edge available in 2026 is substantial and continues to grow with each platform iteration.
This document explains the financial statement analysis process. Most slides are instructional and covered topics include the financial statement analysis process, financial ratios analysis, accounting information (assumptions, principles, policies, procedures), and others.
Financial [read more]
Do You Want to Implement Business Best Practices?
You can download in-depth presentations on Financial Analysis and 100s of management topics from the FlevyPro Library. FlevyPro is trusted and utilized by 1000s of management consultants and corporate executives.
For even more best practices available on Flevy, have a look at our top 100 lists:
These best practices are of the same as those leveraged by top-tier management consulting firms, like McKinsey, BCG, Bain, and Accenture. Improve the growth and efficiency of your organization by utilizing these best practice frameworks, templates, and tools. Most were developed by seasoned executives and consultants with over 20+ years of experience.
Readers of This Article Are Interested in These Resources
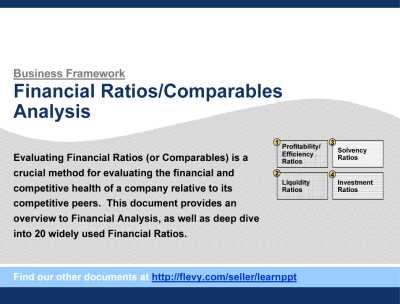
Evaluating Financial Ratios (or Financial Comparables) is a crucial method for evaluating the financial and competitive health of a company relative to its competitive peers. This document provides an overview to Financial Analysis, as well as deep dive into 20 widely used Financial [read more]
User friendly and easy customizable guide to the world of Financial Ratios and Valuation Multiples.
A must have Financial tool for anyone performing Financial Modeling and Financial Analysis.
The template is a detailed guide of Financial Ratios and their application on Financial Statements and [read more]
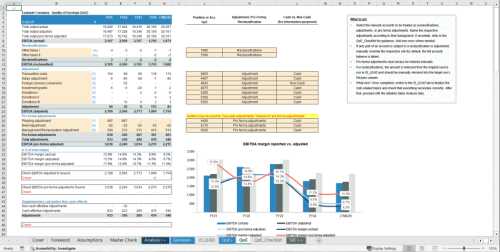
Purpose of the tool
This Excel-based Quality of Earnings (QoE) Model provides a structured framework to analyse the underlying earnings quality of a business by reconciling reported financials to adjusted and pro-forma results. It enables you to capture and classify reclassifications, [read more]
Curated by McKinsey-trained Executives
PART I: THE EVOLVING ROLE OF THE CFO
1. The Strategic Imperative of the Modern CFO
• 1.1 The CFO as a Corporate Strategist
• 1.2 Navigating the C-Suite: Board and CEO Collaboration
• 1.3 CFO vs. Controller vs. Treasurer: Distinctions and [read more]
 Traders and analysts today operate in an environment where raw price data alone is no longer enough to compete effectively. The shift toward modern market analysis has been gradual but decisive, driven by the growing availability of real-time data, more sophisticated visualization technology, and a clearer understanding of how institutional activity actually shapes price.
 Adopting advanced market analysis tools effectively requires more than just subscribing to a platform. The most productive approach treats these tools as complementary layers rather than standalone signals. A reasonable workflow for the trader’s success might look like this: