
Transaction Services – FDD Quality of Earnings (QoE) Model – Excel XLSX
Excel (XLSX) + Excel (XLSX)
BENEFITS OF THIS DOWNLOADABLE EXCEL DOCUMENT
- Reconciles reported results to adjusted and pro-forma EBITDA through clear, transparent bridges.
- Captures reclassifications, normalisations and pro-forma items with consistent documentation and checks.
- Produces a compact QoE output ready for TS reports, due diligence and factbooks.
FINANCIAL ANALYSIS EXCEL DESCRIPTION
Purpose of the tool
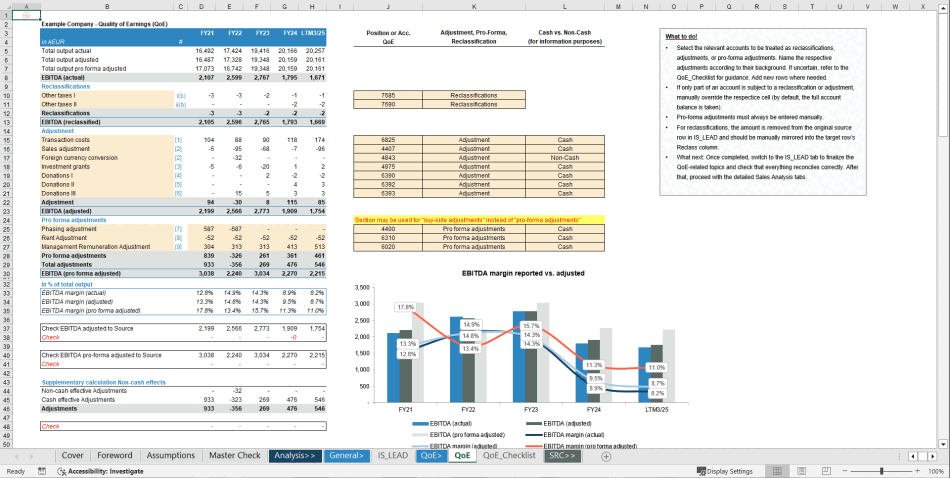
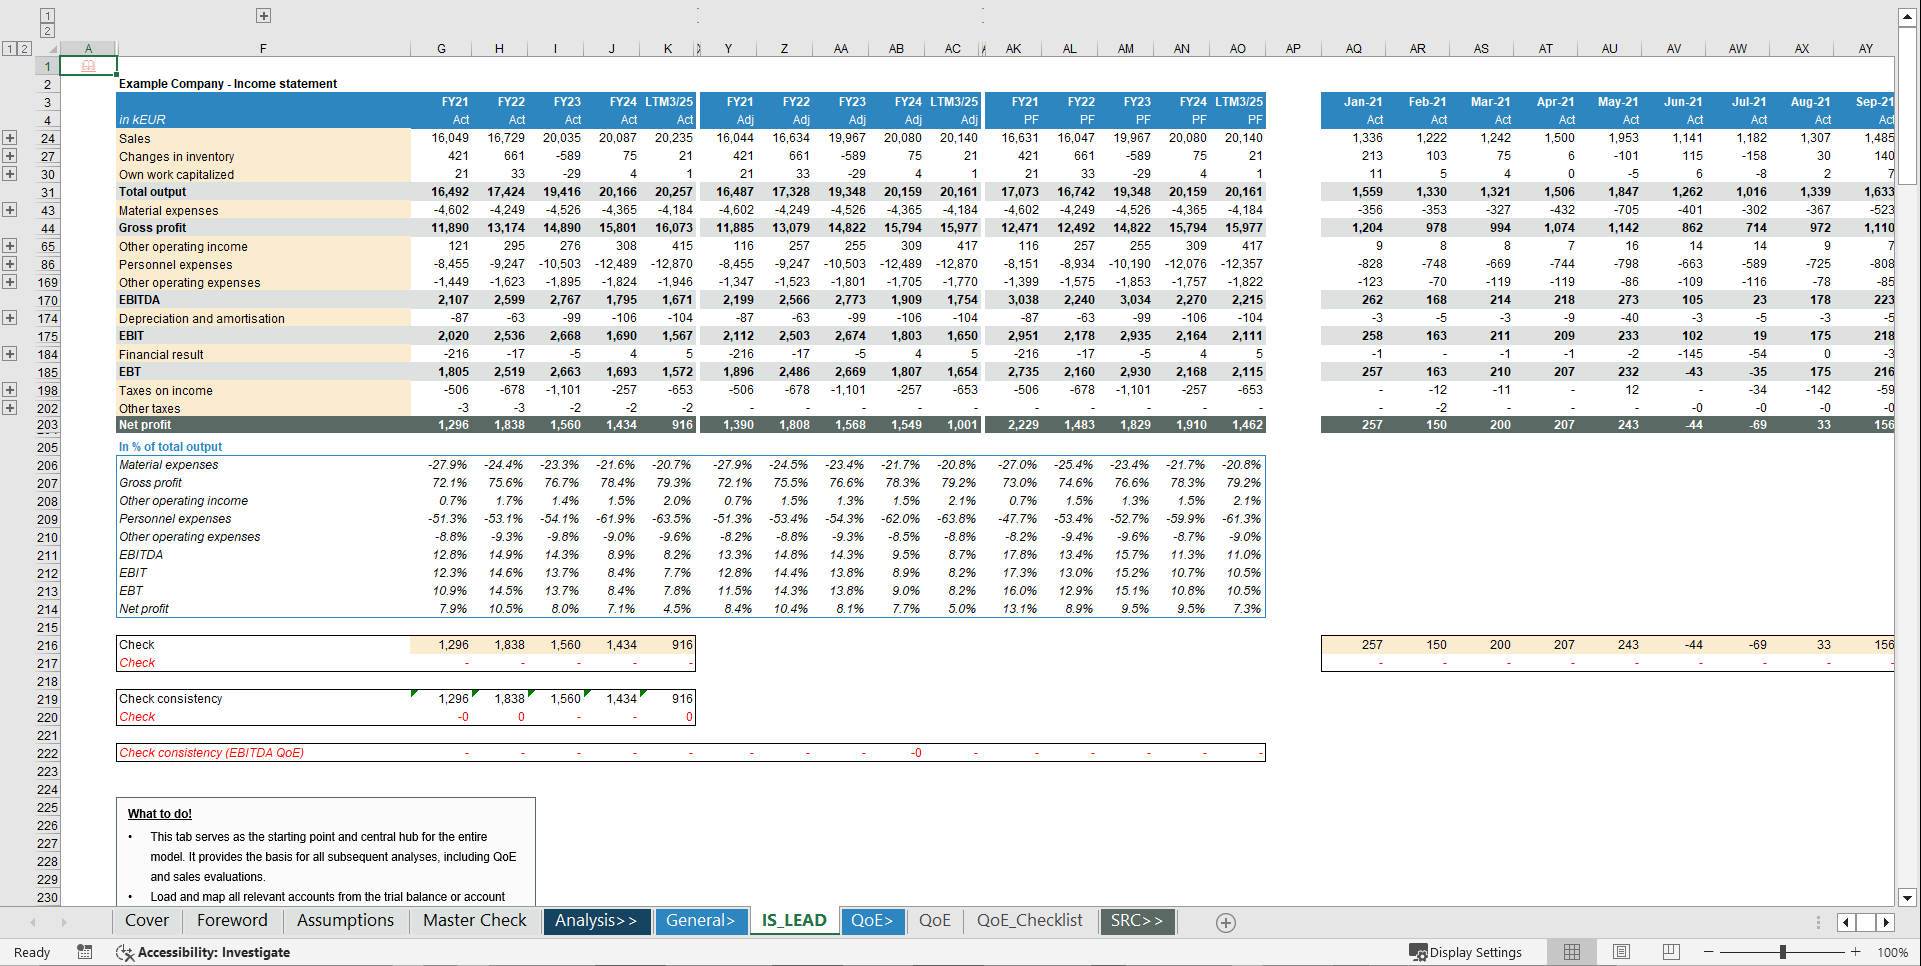
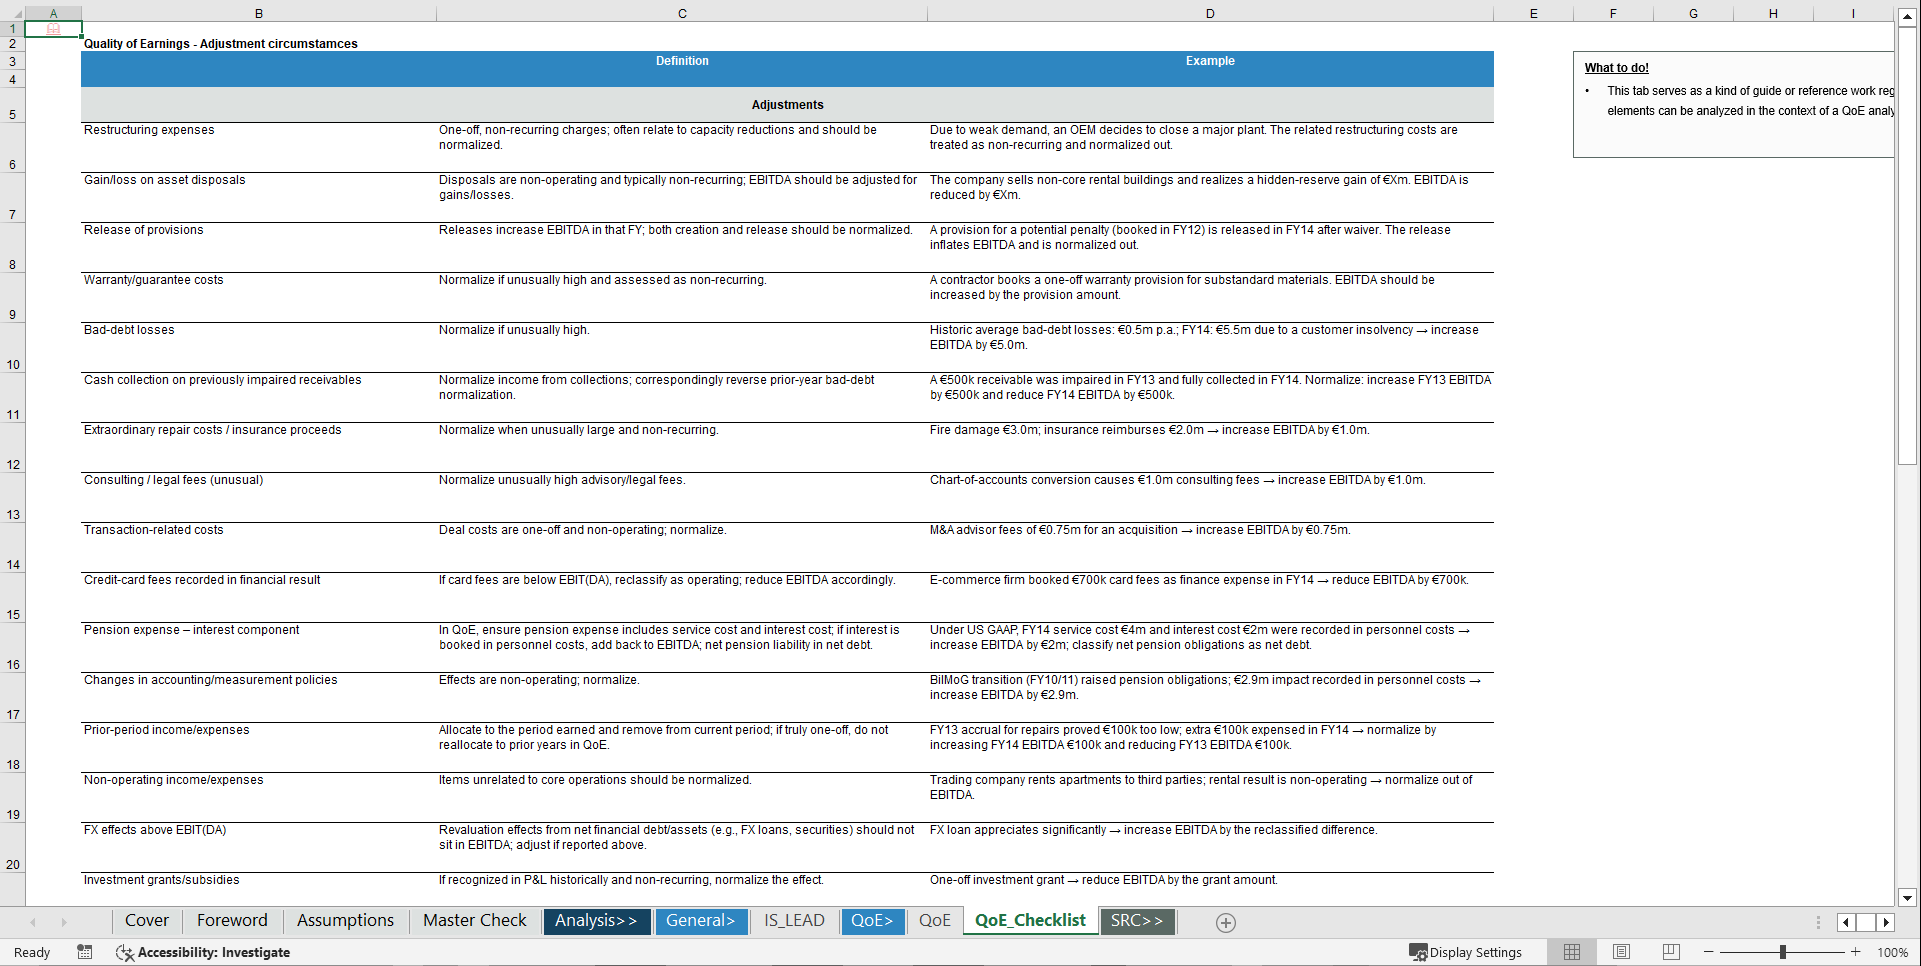
This Excel-based Quality of Earnings (QoE) Model provides a structured framework to analyse the underlying earnings quality of a business by reconciling reported financials to adjusted and pro-forma results. It enables you to capture and classify reclassifications, normalising adjustments and pro-forma items in a transparent way and to link them back to the income statement via clear bridges and checks. The model focuses on EBITDA and earnings-related KPIs and shows reported, adjusted and pro-forma EBITDA and margins. It clearly distinguishes between cash vs. non-cash items and recurring vs. non-recurring effects. Each adjustment can be documented consistently with description, category and impact, making the logic easy to follow for both internal and external stakeholders. The tool is particularly useful for Transaction Services, buy-side and sell-side QoE reports, financial due diligence and factbook preparation, but it can also be applied in internal performance reviews where normalised earnings and transparency on adjustments are key. Each sheet includes a short "What to do / What to know" box with practical instructions, so you always know exactly what is expected on that tab and how it feeds into the overall model.
Key Outputs
The model provides reported, adjusted and pro-forma EBITDA and margins supported by clear bridge views. It separates bridge components for reclassifications, normalising adjustments and pro-forma items, and offers an overview of cash vs. non-cash adjustments as well as recurring vs. non-recurring items. Reconciliation checks between the income statement, adjustment schedules and the final QoE view ensure consistency, while a compact QoE overview is available for direct inclusion in reports, factbooks and presentations.
Key Inputs & Assumptions
As a foundation, the model uses income statement / trial balance data, ideally monthly and at account level. It relies on flags for QoE-relevant accounts and mapping to adjustment categories, as well as line-by-line adjustment entries in the QoE schedule (description, classification, cash/non-cash and amount). Optional assumptions can be used for grouping of adjustments or custom labelling of categories.
How to use
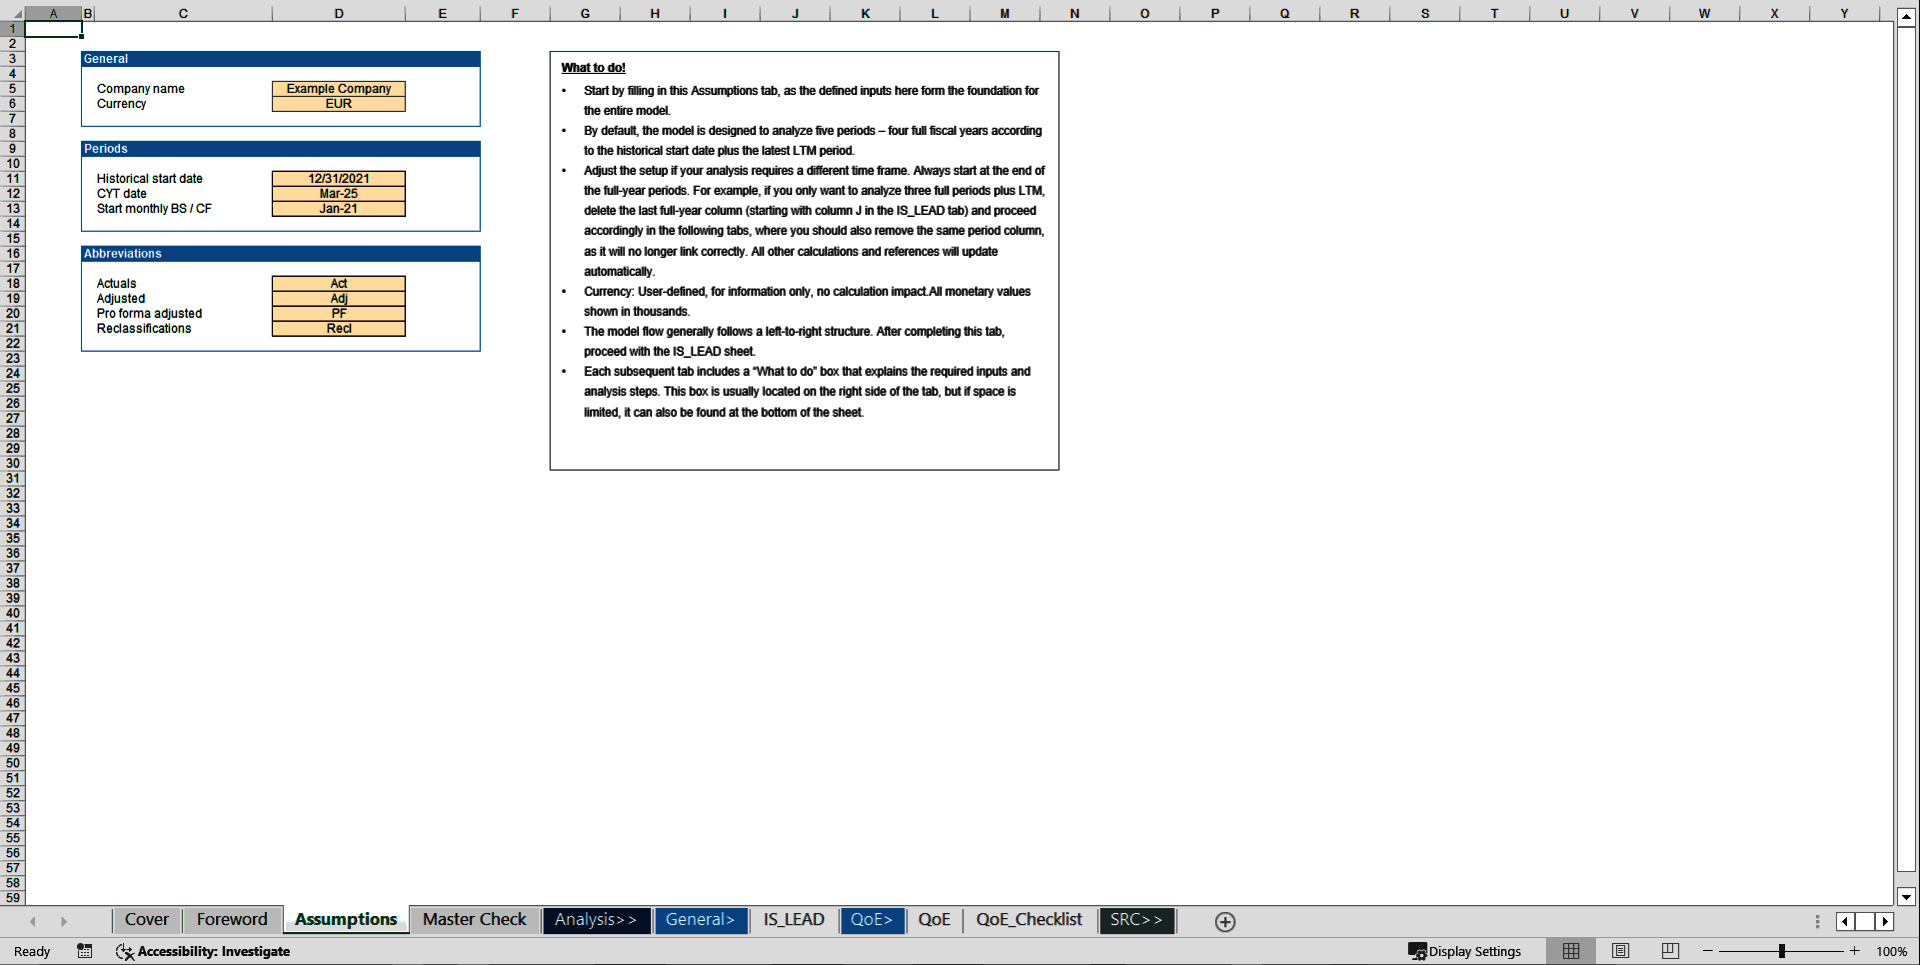
First, set the core parameters (time horizon, currency and basic options) in the Assumptions sheet. Then load the income statement / trial balance data into the IS_LEAD / source sheets and ensure full reconciliation. Next, identify and enter reclassifications, normalising adjustments and pro-forma items in the QoE adjustment tab. Finally, review the EBITDA bridges, margin views and the cash vs. non-cash overview as the basis for your QoE report or factbook.
Customization & support
The model is highly customisable and allows you to adapt categories, labels, grouping logic, KPIs and charts to your firm's QoE style, sector specifics or reporting standards. For more complex customisations or individual requirements such as firm-specific templates, integration into broader workbooks or additional analysis modules, feel free to reach out and we can discuss a tailored solution. Each download includes both a fully blank "Clean Template" for working directly with your own data and a pre-populated Example Template that illustrates the model's logic and calculations using realistic sample data. If you want to cover the full analysis scope—from Earnings/QoE and Working Capital to Net Debt plus Sales and customer analytics—you may also want to have a look at the "Transaction Services All-in-One Financial Analysis Workbook."
Got a question about the product? Email us at support@flevy.com or ask the author directly by using the "Ask the Author a Question" form. If you cannot view the preview above this document description, go here to view the large preview instead.
TOPIC FAQ
What is a Quality of Earnings (QoE) analysis and what does it reconcile?
A QoE analysis reconciles reported financials to adjusted and pro‑forma results to show underlying earnings quality. It captures reclassifications, normalising adjustments and pro‑forma items, links them back to the income statement via bridge views and reconciliation checks, and focuses on reported, adjusted and pro‑forma EBITDA.Why do QoE models separate cash vs non‑cash and recurring vs non‑recurring items?
Separating these categories clarifies which earnings components are available to the business and which are non‑operational or timing effects, improving sustainability assessment. QoE models provide explicit overviews that distinguish cash vs non‑cash and recurring vs non‑recurring adjustments for clearer EBITDA interpretation.What inputs do I need to run a QoE workbook effectively?
Effective inputs include an income statement or trial balance ideally monthly and at account level, flags for QoE‑relevant accounts, mapping to adjustment categories, and line‑by‑line adjustment entries with description, classification, cash/non‑cash flag and amount.How should I choose a QoE Excel model when I have limited time and a small team?
Prioritize models that accept trial‑balance level inputs, include reconciliation checks, and provide sheet‑level guidance to accelerate work. Transaction Services – FDD Quality of Earnings (QoE) Model supplies "What to do / What to know" boxes and both a Clean Template and pre‑populated Example Template to reduce setup time.How can a QoE model support sell‑side factbook preparation?
A QoE model documents and reconciles adjustments so you can present reported, adjusted and pro‑forma EBITDA with clear bridges and a compact QoE overview that is directly includable in factbooks, while ensuring each adjustment is documented with description, category and impact.What value does buying a QoE template deliver versus building one from scratch?
A purchased template provides ready‑made reconciliation logic, standardized adjustment schedules, and instructional guidance per sheet, which reduces build time and helps ensure consistency and reconciliation checks across the workbook, notably the sheet‑level "What to do / What to know" boxes.How should adjustments be documented and classified in a QoE schedule for buyers?
Document each adjustment with a clear description, classification/category, cash vs non‑cash flag, and amount, and link items back to the income statement via bridge views and reconciliation checks so external users can follow the logic and impacts on EBITDA.What outputs should I expect from a QoE model to support valuation and negotiations?
Useful outputs include reported, adjusted and pro‑forma EBITDA and margins, EBITDA bridge views separating reclassifications, normalising and pro‑forma items, a cash vs non‑cash and recurring vs non‑recurring overview, reconciliation checks, and a compact QoE summary for reports.Source: Best Practices in Financial Analysis, Due Diligence, Financial Statement Analysis Excel: Transaction Services – FDD Quality of Earnings (QoE) Model Excel (XLSX) Spreadsheet, Finance Model Hub
ABOUT THE AUTHOR
I am an independent financial analyst specializing in valuation, transaction services, M&A analysis, and the development of practical Excel-based models for advisors and investors.
My templates are built on corporate finance, valuation, and financial modeling best practices and are structured to be intuitive, transparent, and easy to customize. The goal is to translate complex topics into clear,
... [read more]
Ask the Author a Question
You must be logged in to contact the author.
