

Ultimate Guide to Financial Ratios – Excel XLSX
Excel (XLSX)
BENEFITS OF THIS DOWNLOADABLE EXCEL DOCUMENT
- Assist users in preparing a detailed analysis of a company's Financial ratios
- Template is suitable for any kind of business
FINANCIAL ANALYSIS EXCEL DESCRIPTION
User friendly and easy customizable guide to the world of Financial Ratios and Valuation Multiples.
A must have Financial tool for anyone performing Financial Modeling and Financial Analysis.
The template is a detailed guide of Financial Ratios and their application on Financial Statements and Business Valuation.
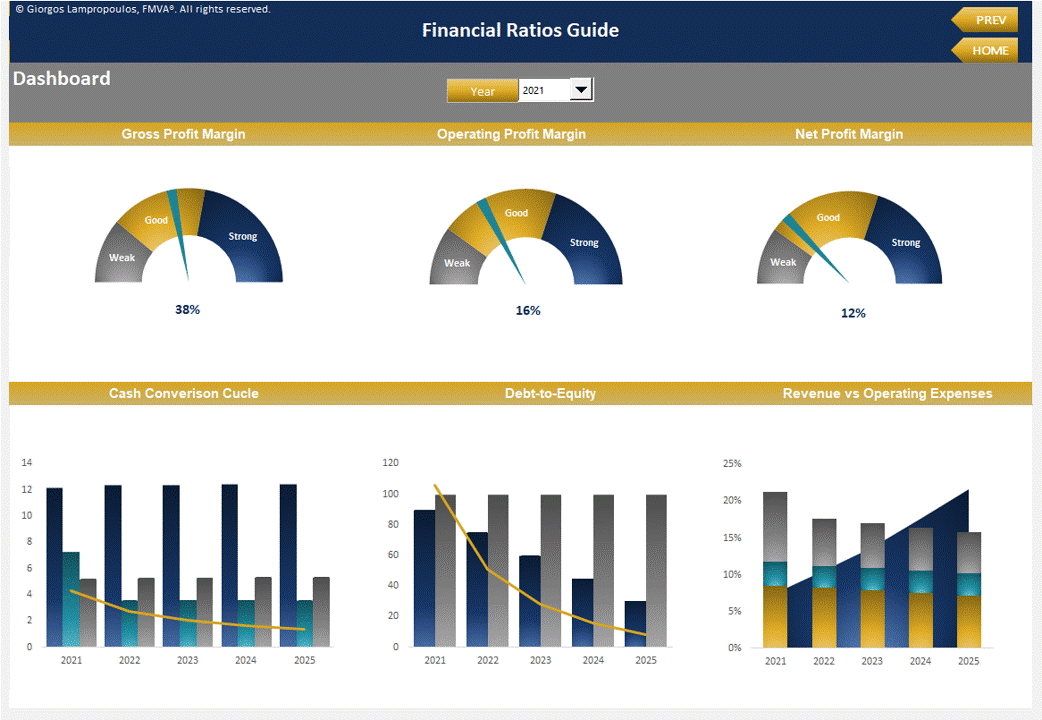
Template includes Terminology & Formulas for all categories of Financial Ratios, 3 Statement Financial Model, Financial Ratios Calculations, Dupont Analysis (Pyramid Chart), Valuation Multiple Ratios and highly-sophisticated Dashboard.
General Outline
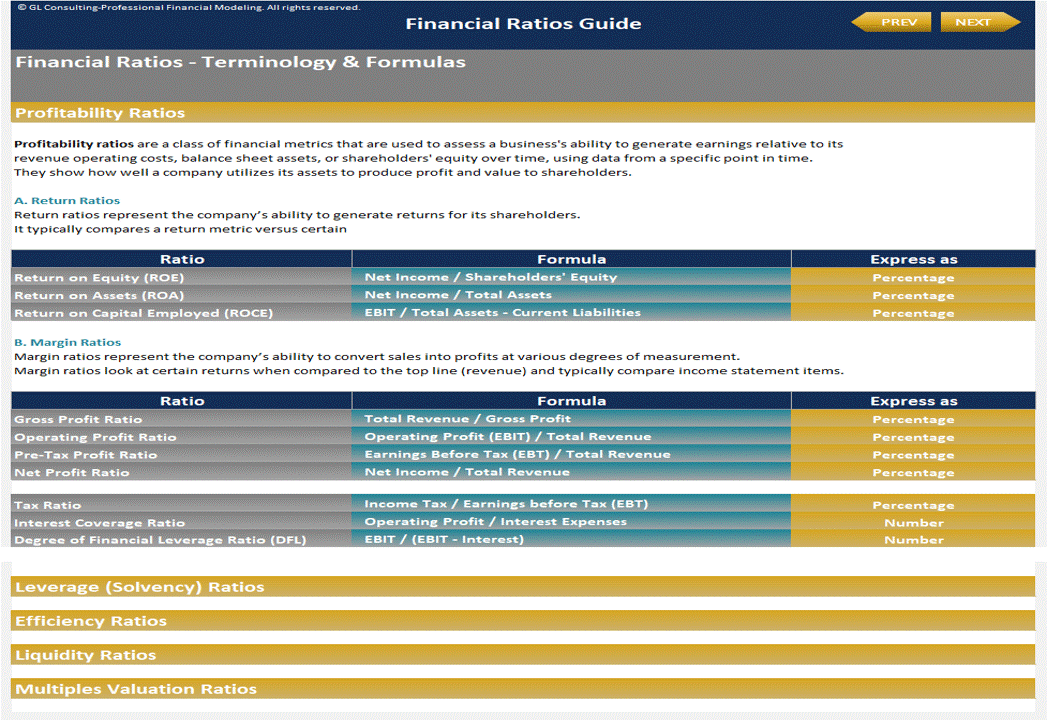
Terminology & Formulas Tab
A detailed list with all of the main categories of Financial Ratios including Terminology and formula for each ratio.
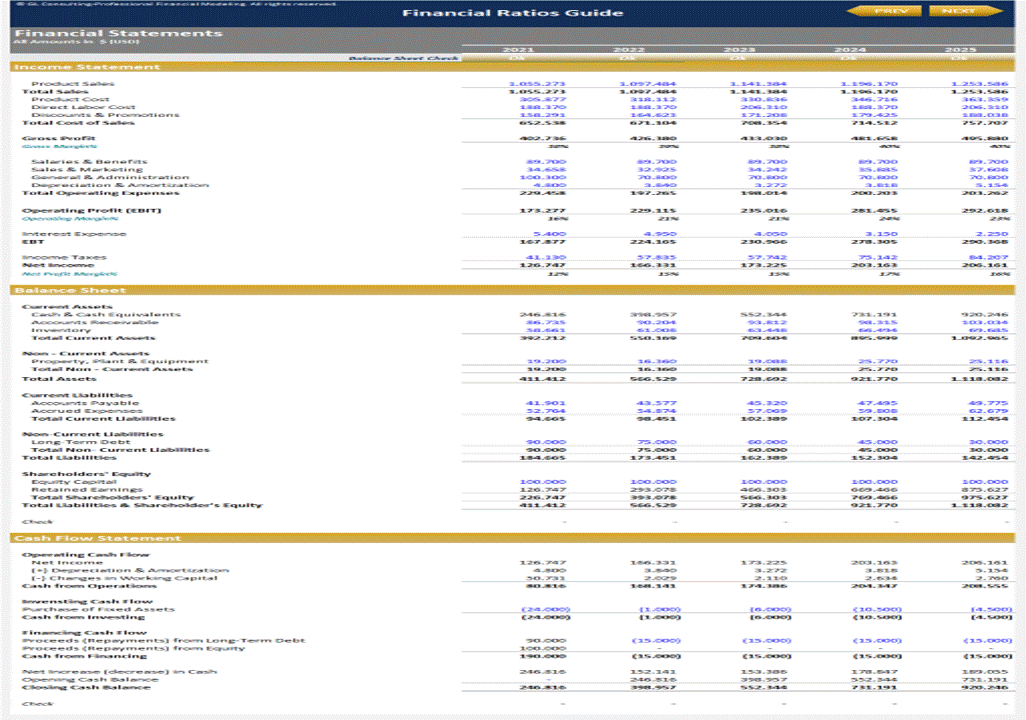
Inputs Tab
User must only fill in the blue color numbers in the tab "3 Statement Financial Model".
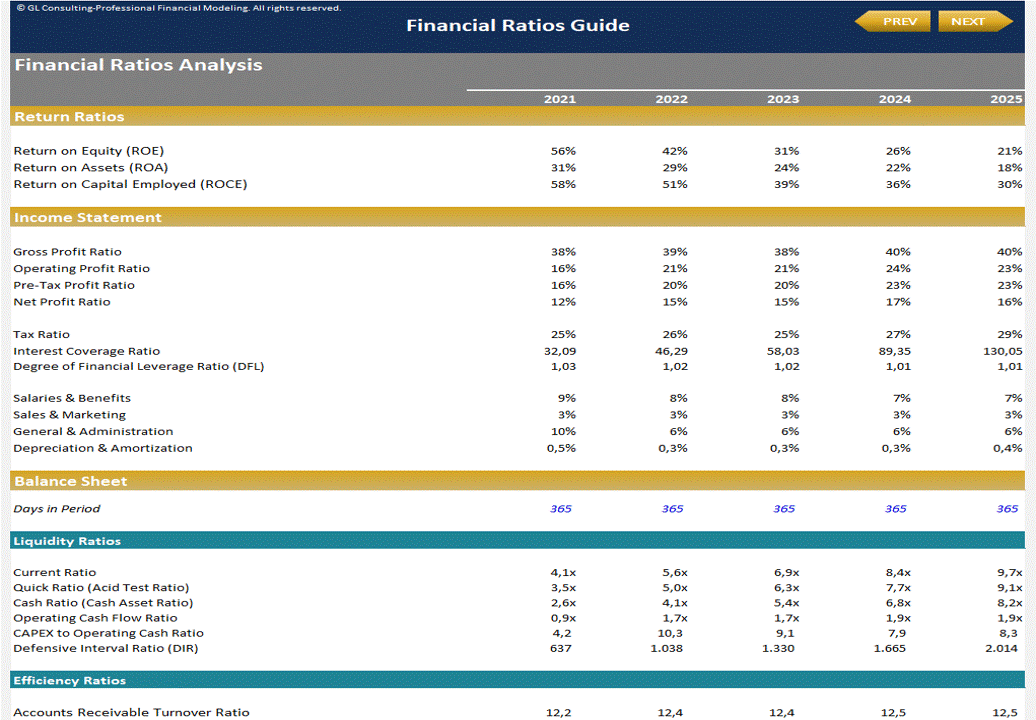
Outputs Tab
Financial Ratios Analysis: Calculation of Profitability, Efficiency, Leverage and Liquidity Ratios based on the 3 Statement Model
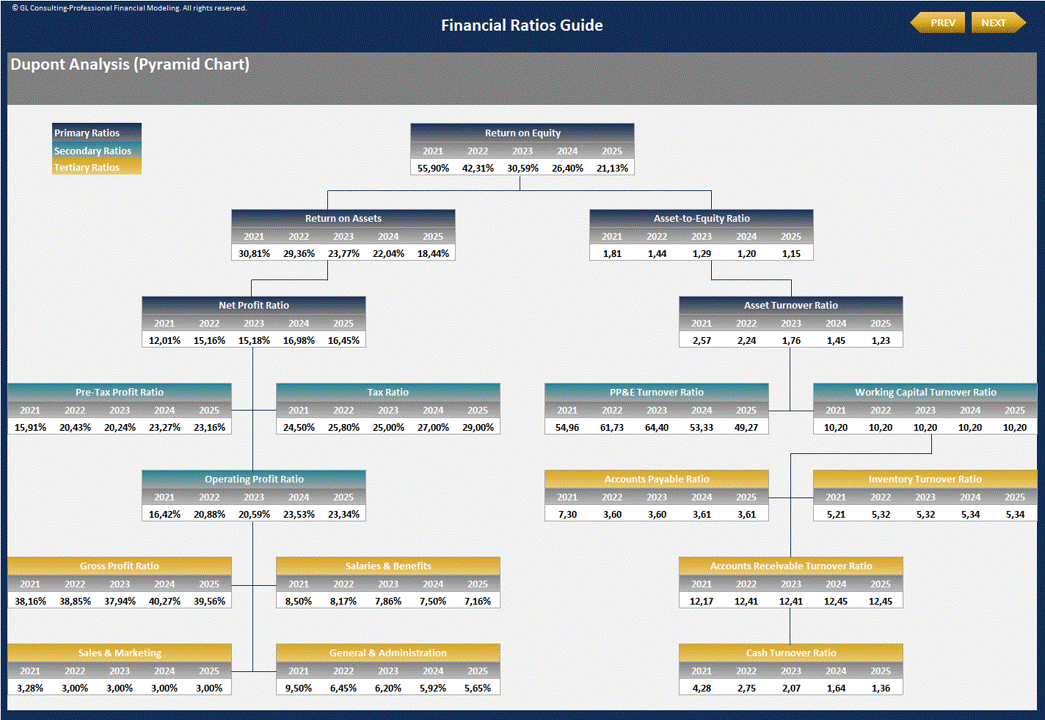
Dupont Analysis (Pyramid Chart): Breakdown illustration of Financial Ratios using Dupont Analysis to evaluate the component parts of a company's return on equity (ROE).
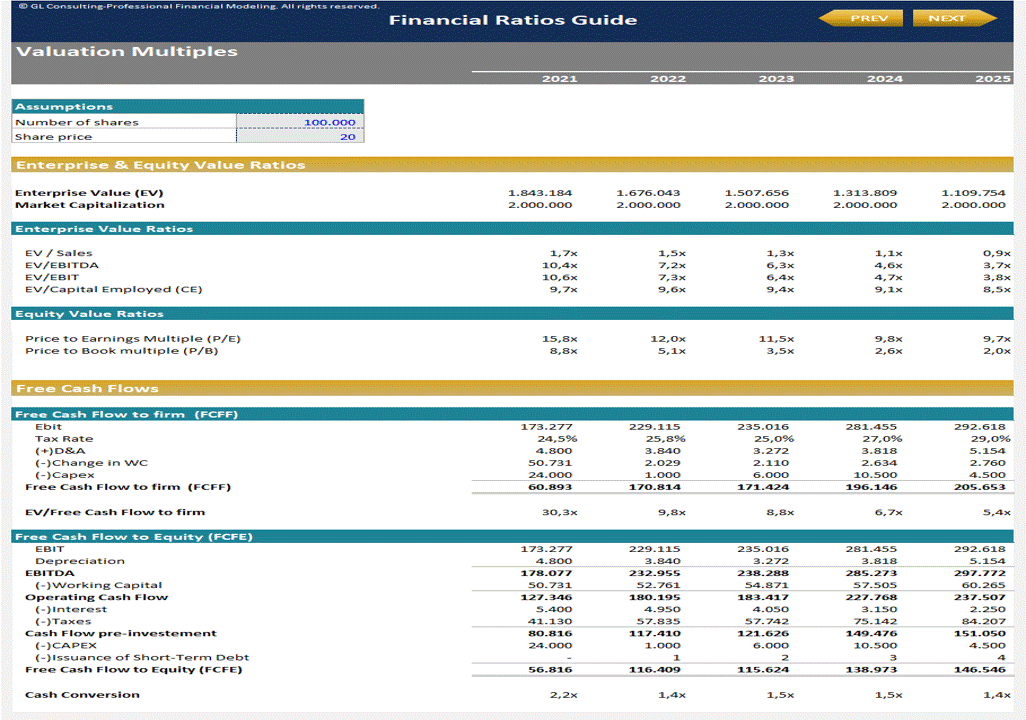
Valuation Multiple Ratios and Free Cash Flows: Analysis of Enterprise and Equity Value Ratios and calculation of company's Free Cash Flows
Charts & Graphs
The template is suitable for any type of industry.
This template goes beyond basic financial analysis by offering a comprehensive breakdown of profitability, efficiency, leverage, and liquidity ratios. It provides a clear, structured approach to understanding a company's financial health, making it an invaluable tool for strategic decision-making. The detailed Dupont Analysis and Pyramid Chart offer a granular view of return on equity components, enabling a deeper dive into performance metrics.
The inclusion of valuation multiples and free cash flow analysis ensures a holistic view of enterprise and equity value. This template is designed to cater to any industry, providing versatility and adaptability. The user-friendly interface and clear instructions make it accessible, even for those less familiar with financial modeling.
Got a question about the product? Email us at support@flevy.com or ask the author directly by using the "Ask the Author a Question" form. If you cannot view the preview above this document description, go here to view the large preview instead.
TOPIC FAQ
What are the main categories of financial ratios and what do they indicate?
Financial ratios commonly group into profitability, efficiency, leverage, and liquidity categories; each set assesses different aspects of performance: profitability for margins and returns, efficiency for asset use, leverage for capital structure risk, and liquidity for short-term solvency. These 4 categories are the basis of the template’s Outputs tab.How does Dupont analysis break down return on equity (ROE)?
Dupont analysis decomposes ROE into component drivers—typically net profit margin, asset turnover, and financial leverage—so you can see whether ROE changes come from margins, efficiency, or leverage; the product presents this as a Pyramid Chart for ROE decomposition.What features should a valuation-focused ratios template include for enterprise and equity valuation?
A valuation-focused template should include a 3-statement financial model to generate free cash flows, calculation of valuation multiple ratios for enterprise and equity value comparison, and outputs that link multiples to cash flow valuation; Flevy’s Ultimate Guide to Financial Ratios specifically includes valuation multiple ratios and free cash flow analysis.How do I use a 3-statement model within a ratios template to generate ratio outputs?
Populate the Inputs tab—enter values into the designated blue input cells on the 3 Statement Financial Model—then the Outputs tab calculates profitability, efficiency, leverage, and liquidity ratios automatically based on those statements, producing standard ratio outputs from your model inputs.Which valuation multiples are typically analyzed to compare enterprise and equity value?
Valuation analysis usually separates enterprise-value based ratios from equity-value based ratios and links those to cash flow measures; the template includes a Valuation Multiple Ratios section and Free Cash Flows analysis to support enterprise and equity value comparisons.How can dashboards and charts improve communication of ratio analysis to stakeholders?
Dashboards and charts consolidate key ratio trends, Dupont decomposition visuals, and valuation metrics into a single view, making it easier to explain drivers and changes; the template includes Charts & Graphs and a highly-sophisticated Dashboard for presentation across industries.What should I check when selecting a financial ratios template on a marketplace like Flevy?
Choose a template that lists terminology and formulas, provides a 3-statement model with clear input cells, automates ratio calculations (profitability/efficiency/leverage/liquidity), includes Dupont decomposition and valuation multiple analysis, and supplies charts or a dashboard—features found in Ultimate Guide to Financial Ratios.How much Excel proficiency is needed to use a financial ratios template effectively?
Templates described as user-friendly with clear instructions typically require basic to intermediate Excel skills to enter inputs and interpret outputs; this product indicates users fill only the blue input cells in the 3 Statement Financial Model and then review calculated ratios.Source: Best Practices in Financial Analysis, Financial Ratio Analysis Excel: Ultimate Guide to Financial Ratios Excel (XLSX) Spreadsheet, Profit Vision
ABOUT THE AUTHOR
Profit Vision provides Consulting & Outsourced Financial Services as well as Financial Planning & Performance analysis to small and mid-size businesses by implementing efficient and effective tools to assist them with start-up business plans or improve their ongoing operations.
Our range of services include Financial & Operational Analysis, Business Planning, Budgeting & Forecasting, Cash Flow
... [read more]
Ask the Author a Question
You must be logged in to contact the author.
This document is available as part of the following discounted bundle(s):
Save %!
All-in-One General Financial Models
This bundle contains 9 total documents. See all the documents to the right.
