Editor's Note: Take a look at our featured best practice, ISO 9001:2015 (QMS) Awareness Training (85-slide PowerPoint presentation). ISO 9001:2015 is the world's most widely adopted standard for Quality Management Systems (QMS), providing a proven framework for organizations to consistently meet customer, regulatory, and business requirements while driving continual improvement. Applicable to organizations of all sizes [read more]
* * * *
Software Quality Assurance (SQA) is a structured discipline aimed at ensuring that software systems deliver on critical attributes like reliability, performance, and maintainability. At its core, SQA is about making Quality measurable and manageable. It embeds objective controls across the development lifecycle to prevent defects, instead of simply detecting them after the fact.
However, quality cannot be improved unless it is first made visible. Visibility does not demand vanity numbers or abstract Key Performance Indicators (KPIs). It requires metrics that answer real questions about actual goals. Most organizations do not fail due to a lack of data. They fail because the data they collect is disconnected from what they are trying to achieve. That’s where the Goal–Question–Metric (GQM) framework steps in.
Quality Needs a Real Strategy
Without a framework like GQM, measurement quickly becomes noise. Dashboards overflow with indicators that signal nothing. Data teams end up optimizing for report generation rather than Performance. Leadership is stuck chasing the wrong signals.
GQM solves this by flipping the software quality measurement paradigm on its head. Don’t start with metrics, start with purpose. GQM enforces a top-down structure where every metric must trace back to a diagnostic question, and every question must trace back to a clearly defined goal. It is not just about gathering data. It is about asking, why are we measuring this in the first place?
The framework was developed in the early 1980s by Victor Basili and David Weiss during their work with NASA and the University of Maryland. At the time, software engineering was producing tons of measurement data with little understanding of how it tied to actual outcomes. GQM emerged as a response to that problem. And decades later, it is still one of the most effective frameworks for organizations that need their metrics to actually mean something.
How GQM is Different
GQM doesn’t exist to help build better dashboards. It helps the leaders make better decisions. It translates fuzzy aspirations into structured, actionable measurements. It aligns product, process, and resource efforts with Strategy. It forces teams to have the right conversations—what are we actually trying to achieve, and what data proves we are getting there?
GQM leverages the following benefits to the organizations:
Goal and Metric Alignment: Every number tracked supports a goal that matters
Traceability and Transparency: Clear paths from Strategy Development to measurement
Evidence-Based Decisions: Numbers backed by purpose, not PowerPoint
Consistency: Standardized metrics across projects and teams
Continuous Improvement: A closed-loop system of feedback and refinement.
The Building Blocks of GQM
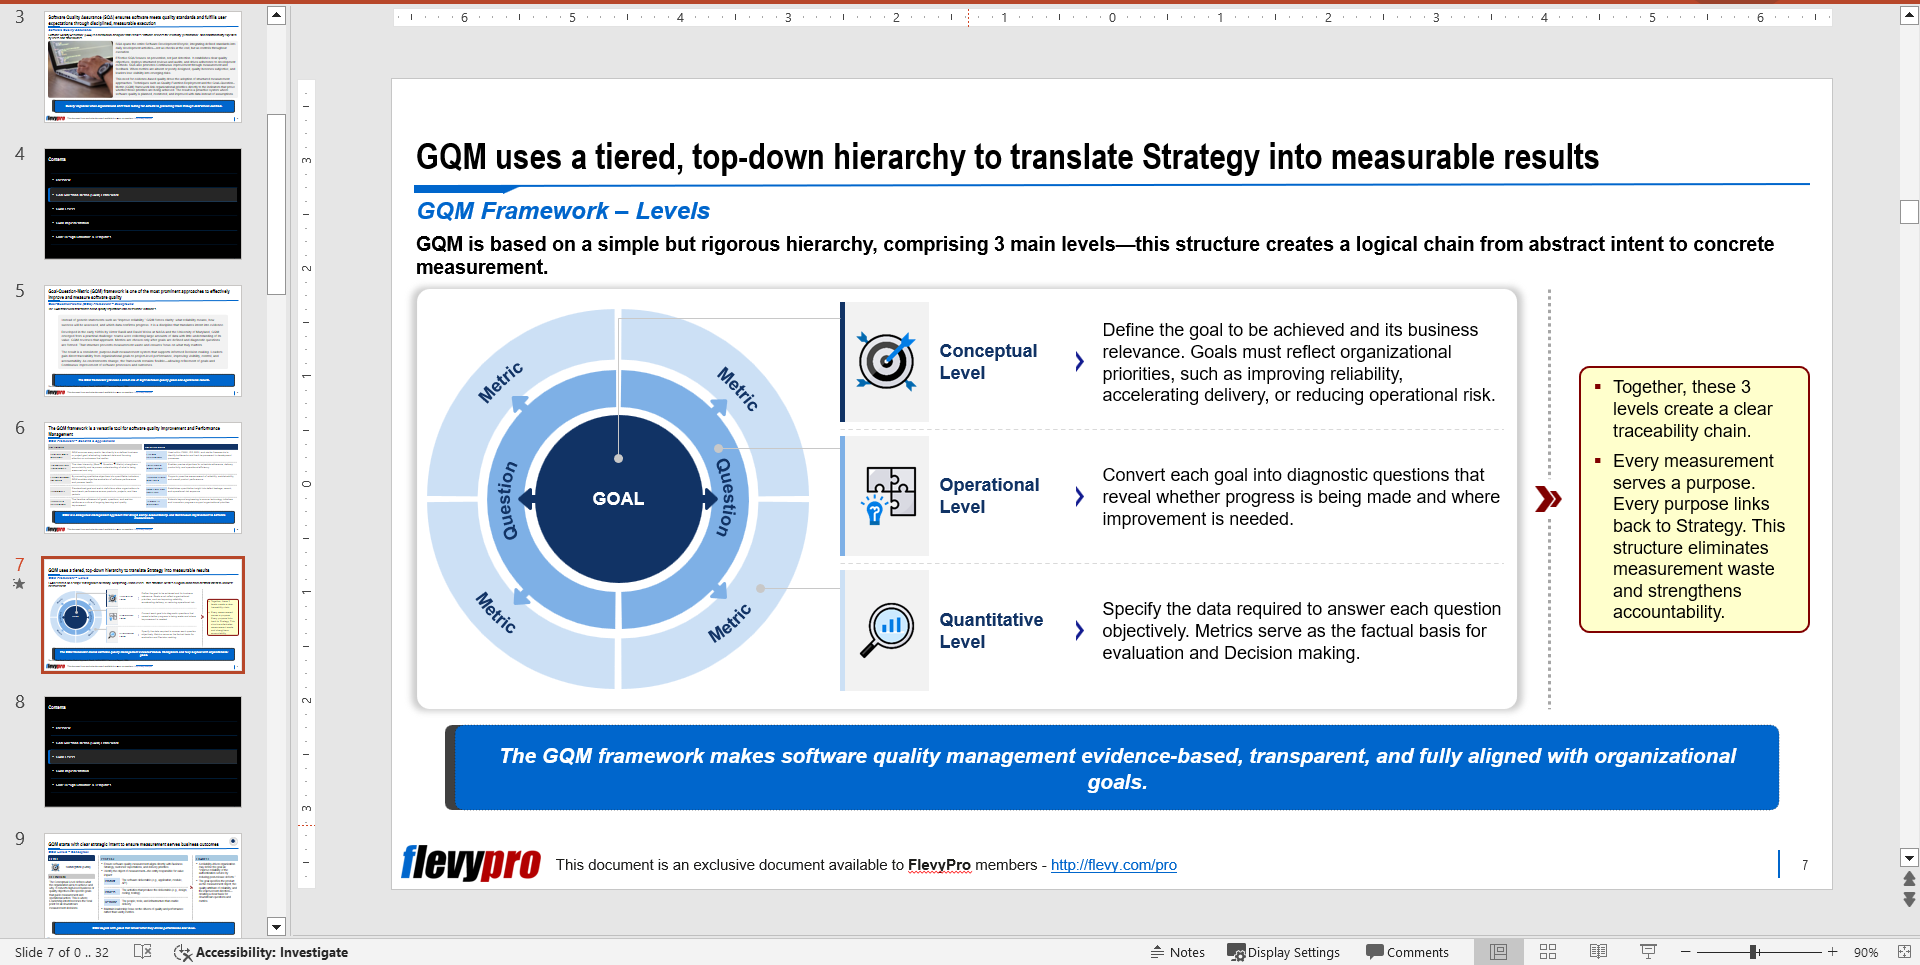
The GQM framework runs on a tiered hierarchy. Each level builds directly off the previous one:
Conceptual (Goal) Level — What is the organization trying to achieve, and why?
Operational (Question) Level — What questions help determine if the goal is being met?
Quantitative (Metric) Level — What data answers those questions objectively?
Let’s get into the details of the first two levels.
Conceptual (Goal) Level
The problem with most goals is that they are vague. “Improve system performance.” “Enhance user satisfaction.” They are essentially slogans without any direction, measurement, or impact.
GQM forces clarity at the conceptual level. It starts with defining what you are trying to achieve, in which part of the organization, for what reason. The object of measurement must be specific—a product (like an authentication service), a process (like code review), or a resource (like a QA team). And the goal must articulate not just the area of focus, but also the direction of change and the intended outcome.
For example: “Improve reliability of the authentication service by reducing post-release defects.” This isn’t just fluff. It names the product, the quality attribute, and the improvement target. It sets a foundation that downstream questions and metrics can actually build on.
Operational (Question) Level
Once the goal is locked in, the next level is about surfacing the right questions. This is where operational clarity kicks in. For every goal, GQM demands a set of diagnostic questions that help reveal performance status and root causes.
Think of these as the working hypotheses of your Quality Strategy. If your goal is to reduce post-release defects, your questions might include:
What proportion of defects escape testing and reach production?
Which components are most prone to failure?
How do incident trends correlate with code changes or deployments?
These questions are critical. They define the scope of measurement and focus attention on the variables that actually move the needle. More importantly, they keep teams from falling into the trap of measuring what is easy instead of what is essential.
Case Study
A major software organization developing network infrastructure products was battling a persistent quality issue—defects leaking into production during critical releases.
They adopted GQM not as a reporting initiative, but as a performance intervention. The goal was simple: reduce defect escape rate during integration testing. But the insight came from how they built around it.
They formulated questions like: Where are the leaks occurring? What categories of defects are bypassing integration checks? Which modules are driving the most post-release incidents?
Then came the metrics: Post-integration defect counts by component, defect distribution by category, pre-release versus post-release defect ratios.
With that structure in place, they built risk-focused dashboards, rebalanced testing investments, and closed visibility gaps. The outcome was not just fewer defects. It was less rework, shorter release cycles, and tighter alignment between development and QA.
FAQs
How is GQM different from traditional KPI dashboards?
Dashboards usually start with metrics. GQM starts with strategic goals and builds downward, ensuring every metric has a reason to exist.
What kind of goals work best with GQM?
Specific, strategic, and measurable goals tied to clear quality or productivity drivers. “Reduce incident resolution time by 20%” works. “Improve experience” doesn’t.
Is GQM only for software engineering?
No. While it is rooted in software quality, GQM can be applied across IT operations, Product Development, and even strategic initiatives where evidence-based tracking is required.
Does GQM require specialized tools?
Nope. You can implement GQM with basic spreadsheets or enterprise analytics platforms. What matters is discipline in goal setting and measurement logic, not tools.
What is the biggest risk when using GQM?
Overcomplexity. If you chase too many goals or measure everything, you will lose focus. GQM works when it is tight, not bloated.
Closing Thoughts
GQM is not a silver bullet. It does not magically turn bad code into great software. What it does is force strategic clarity and operational discipline. It aligns quality conversations with business outcomes and gives Leadership something they rarely get from traditional reporting—insight with context.
It is also brutally honest. If your goals are vague, your questions unclear, or your data garbage, GQM will expose the gap. That’s a good thing, because once you see the gap, you can close it. That’s where improvement starts.
Use the GQM framework if you are tired of noise masquerading as analysis. Use it if your teams debate KPIs but never connect them to outcomes. Use it if your Strategy slides have goals like “delight the customer” but nobody knows what that actually means.
GQM demands simplicity and precision. Both are hard, but if you commit, GQM gives you what every organization really needs—a way to manage quality with eyes wide open.
Take a hard look at your current metrics. Ask yourself: what question is this answering? And does that question serve a goal that actually matters? If not, you know what to do. Burn it down and build something that works.
You can download in-depth presentations on this and hundreds of similar business frameworks from the FlevyPro Library. FlevyPro is trusted and utilized by 1000s of management consultants and corporate executives.
For even more best practices available on Flevy, have a look at our top 100 lists:
Successful companies know it's far cheaper to prevent problems than to fix them--especially after customers notice. Poor quality increases costs and erodes competitive advantage, while good quality reduces costs and strengthens market position. The key question is: How can a company measure [read more]
Readers of This Article Are Interested in These Resources
Total Quality Management (TQM) is a strategic approach that embeds a culture of continuous improvement across an organization. It goes beyond processes and outcomes, fostering a mindset where every function, system, and individual contributes to quality and excellence. By engaging all [read more]
The Baldrige Excellence Framework or Malcolm Baldrige National Quality Award (MBNQA) is the most prestigious award conferred on U.S. organizations in the business, healthcare, education, and nonprofit sectors in recognition of their attainment of world-class standards of performance excellence. [read more]
This course covers discussions on what is new in IATF 16949:2016 Automotive QMS Standard as compared with ISO/TS 16949:2009 along with new version of ISO 9001 (released in September 2015)
This course also gives an overview of new requirements & its interpretations
The course is useful to [read more]
Advanced Product Quality Planning (APQP) 2nd Edition is a structured method of defining and establishing the steps necessary to assure that a product satisfies the customer. It provides a set of detailed requirements to be undertaken at each stage in the APQP system.
APQP is used when a new [read more]
 Software Quality Assurance (SQA) is a structured discipline aimed at ensuring that software systems deliver on critical attributes like reliability, performance, and maintainability. At its core, SQA is about making