Explore our Competitive Analysis PPT, crafted by industry experts, to master competitor positioning and enhance your strategic initiatives with proven methodologies.
This product (Competitive Analysis) is a 40-slide PPT PowerPoint presentation slide deck (PPT), which you can download immediately upon purchase.
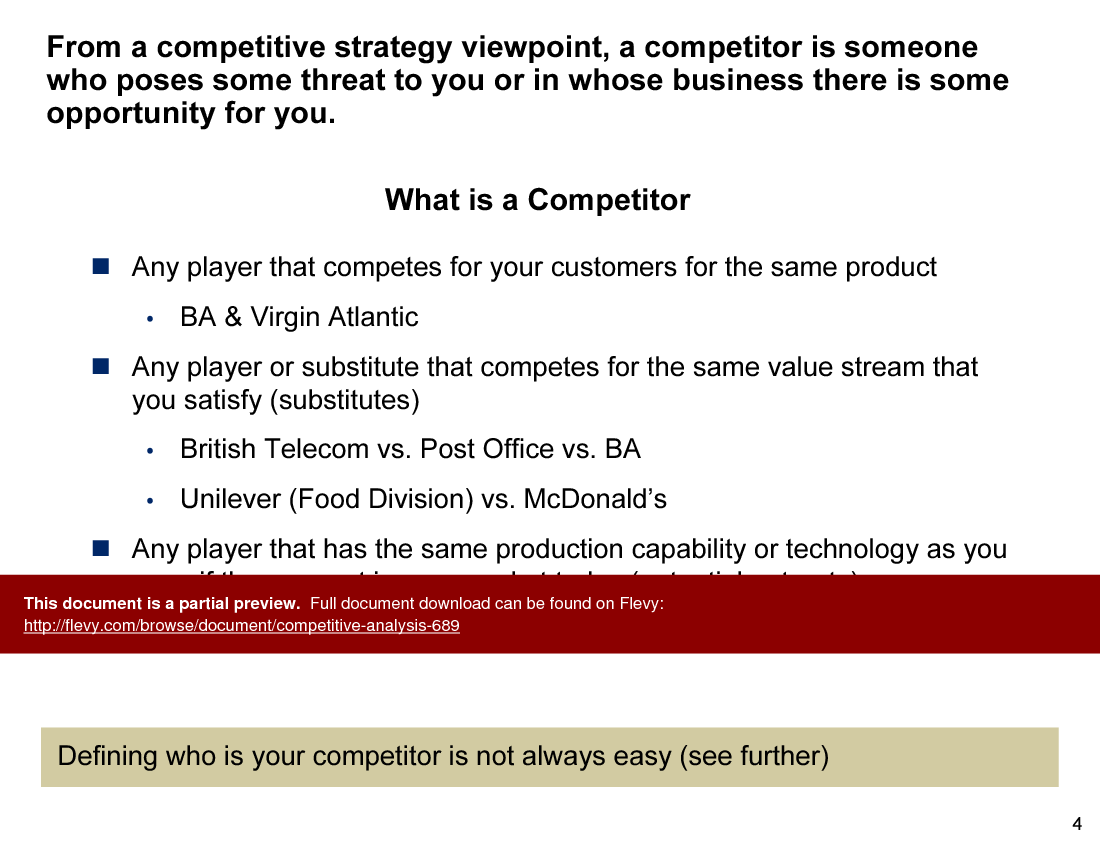
From a competitive strategy viewpoint, a competitor is someone who poses some threat to you or in whose business there is some opportunity for you.
Competitive analysis is...
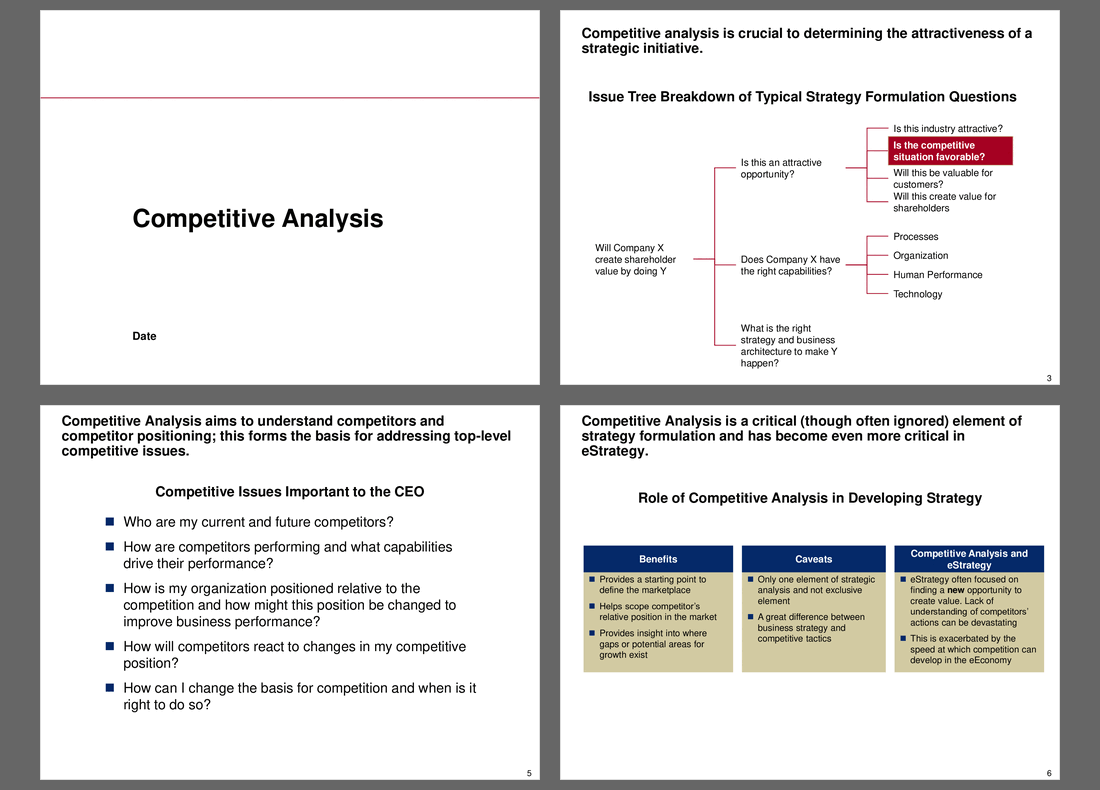
Crucial to determining the attractiveness of a strategic initiative.
Aims to understand competitors and competitor positioning; this forms the basis for addressing top-level competitive issues.
Critical (though often ignored) element of Strategy Formulation and has become even more critical in Online/Digital Strategy.
This document delves into the intricacies of defining competitors, acknowledging that it's not always straightforward. It categorizes competitors into those vying for the same product, substitutes fulfilling the same value stream, and those with comparable production capabilities. Real-world examples like BA vs. Virgin Atlantic and Unilever vs. McDonald's illustrate these distinctions, emphasizing the complexity of competitive landscapes.
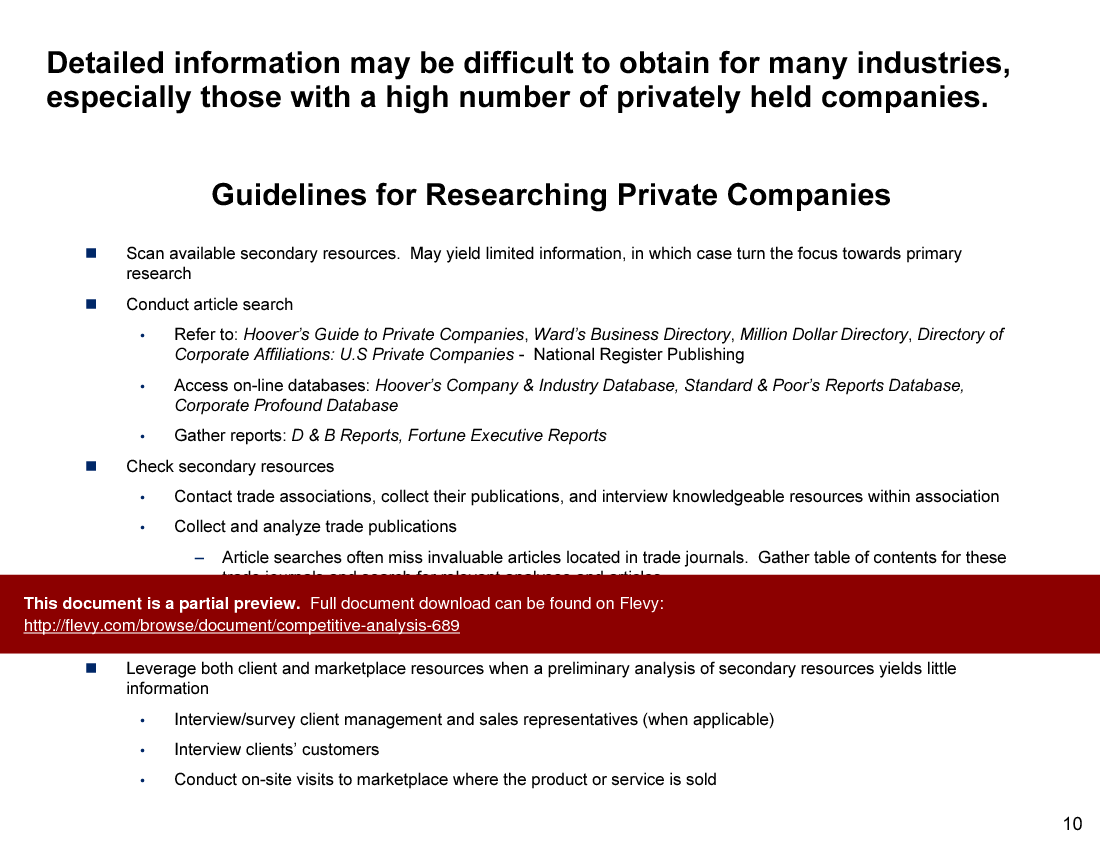
The XYZ Approach to Competitive Analysis offers a structured methodology for dissecting competitive environments. It includes comprehensive guidelines for researching private companies, leveraging both secondary and primary resources. This section is particularly valuable for industries with numerous privately held firms, where data is often scarce. The document outlines key resources like Hoover's Guide and D&B Reports, ensuring thorough and reliable research.
Porter's Five Forces Model is utilized to broaden the competitor set, identifying less obvious players. This model helps in understanding the threats of new entrants, the power of suppliers and buyers, and the intensity of competition. It also highlights the importance of substitutes, which can often be overlooked. This holistic view ensures a robust competitive analysis, providing insights into various market dynamics.
The document also includes a detailed competitor profile checklist, covering aspects from strategic intent to business systems. It emphasizes the need to gather basic and advanced profile information, such as sales growth, market share, and operational efficiencies. This comprehensive approach ensures that all critical facets of competitors are analyzed, providing a solid foundation for strategic decision-making.
Got a question about the product? Email us at support@flevy.com or ask the author directly by using the "Ask the Author a Question" form. If you cannot view the preview above this document description, go here to view the large preview instead.
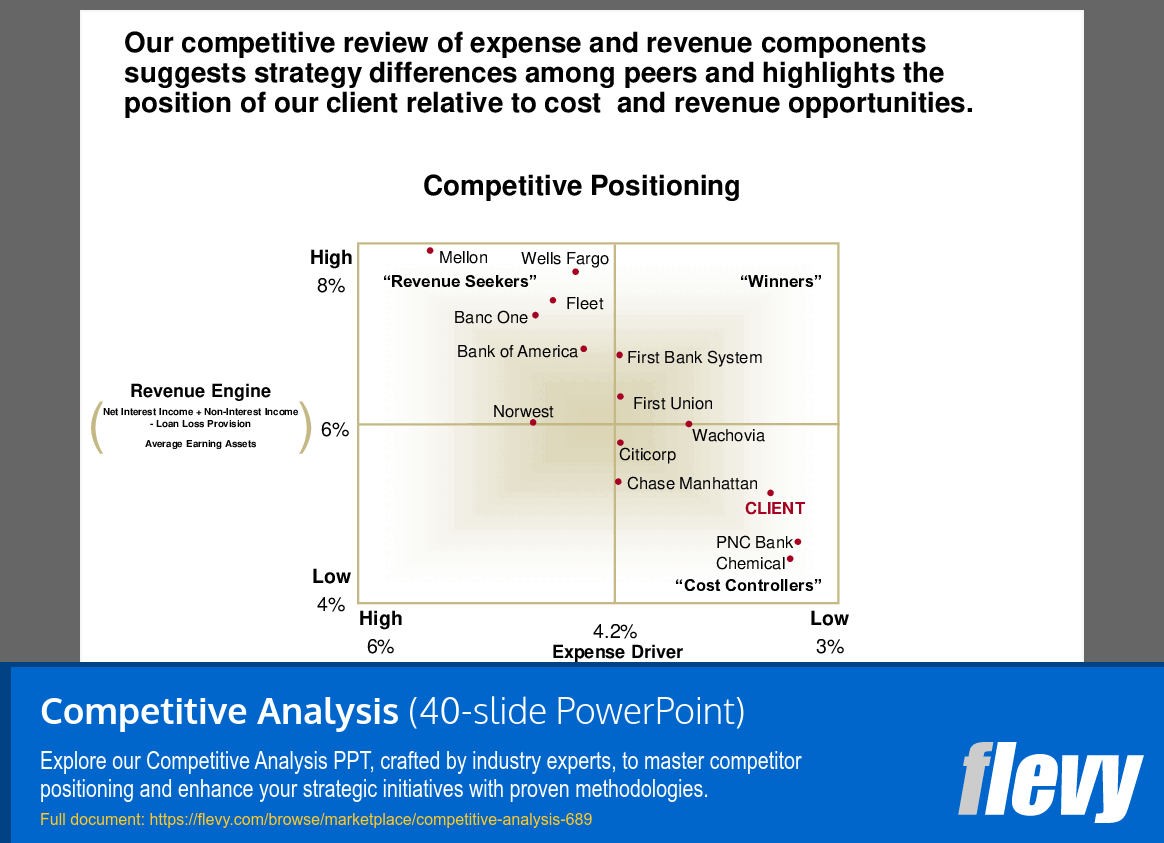
This PPT slide presents a competitive positioning analysis that evaluates various financial institutions based on their expense and revenue strategies. It features a scatter plot with 2 axes: the vertical axis represents the "Revenue Engine," which encompasses net interest income, non-interest income, and loan loss provisions, while the horizontal axis indicates the "Expense Driver," reflecting the percentage of expenses relative to revenue.
The chart categorizes institutions into 4 distinct quadrants: "Revenue Seekers," "Winners," "Cost Controllers," and a lower quadrant that likely represents less effective strategies. The positioning of the client is highlighted prominently, indicating its relative standing among peers. The client is placed in the "Cost Controllers" quadrant, suggesting a focus on managing expenses effectively while potentially sacrificing revenue growth compared to those in the "Winners" category.
Notable competitors such as Mellon and Wells Fargo are positioned as "Revenue Seekers," indicating a strategy that prioritizes revenue generation. Institutions like First Bank System and First Union are categorized as "Winners," suggesting a balanced approach to both revenue and cost management. The analysis implies that while the client excels in cost control, there may be opportunities to enhance revenue generation strategies to improve overall performance.
This slide serves as a valuable tool for understanding the competitive dynamics in the financial sector. It highlights areas where the client can focus its strategic initiatives to either maintain its cost efficiency or explore avenues for revenue enhancement. The insights derived from this positioning can inform decision-making and strategic planning moving forward.
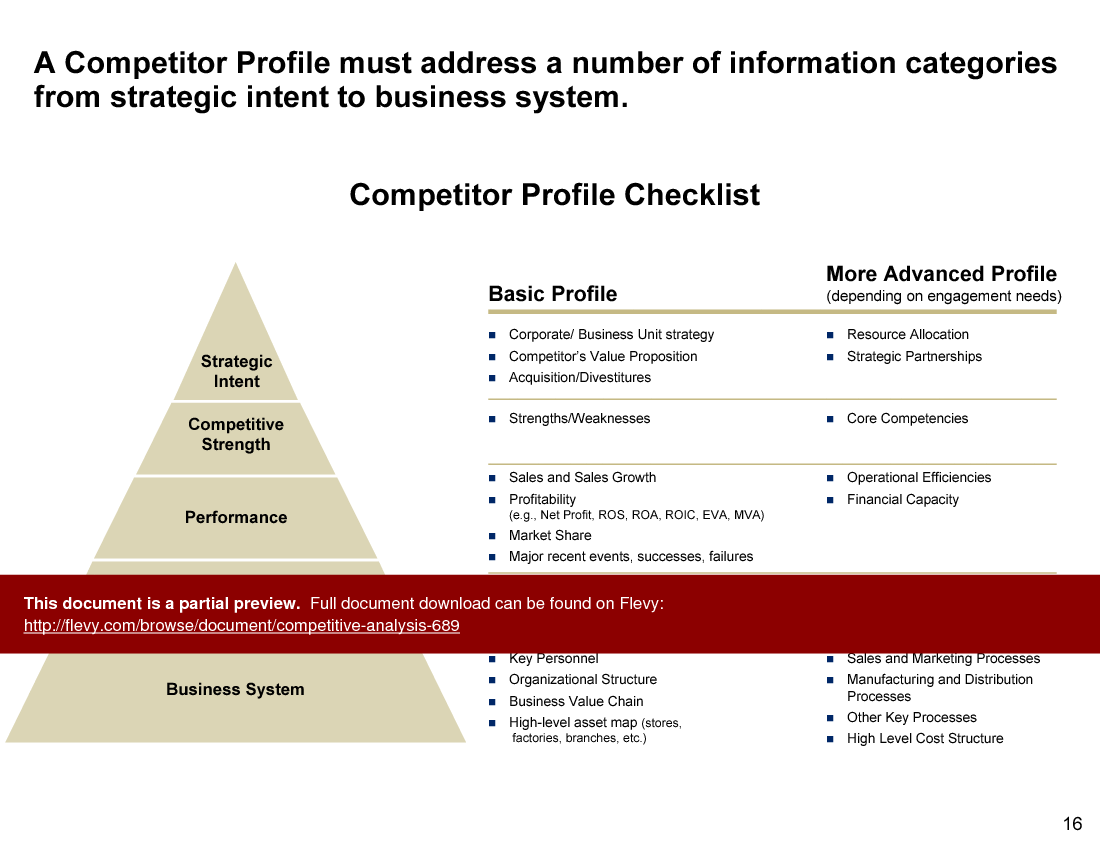
This PPT slide presents a structured approach to developing a comprehensive competitor profile, emphasizing the need to cover various categories from strategic intent to business systems. It employs a pyramid structure, indicating a hierarchy of information that should be gathered. At the top, "Strategic Intent" signifies the overarching goals and motivations of competitors, which is foundational for understanding their market behavior.
Moving down the pyramid, "Competitive Strength" and "Performance" highlight the importance of assessing a competitor's capabilities and operational effectiveness. This includes evaluating their sales growth, profitability metrics, and market share. The slide suggests that understanding these elements is crucial for gauging how a competitor positions itself within the market.
The checklist is divided into 2 sections: Basic Profile and More Advanced Profile. The Basic Profile outlines essential elements such as corporate strategy, value proposition, and strengths/weaknesses. This section serves as a starting point for any competitor analysis. The More Advanced Profile expands on this by incorporating deeper insights like resource allocation and strategic partnerships, which are vital for a nuanced understanding of a competitor's operational framework.
Key metrics such as sales growth, market share, and geographic coverage are also included, indicating that a thorough analysis should not only focus on qualitative aspects, but also on quantitative performance indicators. The slide implies that a well-rounded competitor profile can inform strategic decisions and enhance competitive positioning. This structured approach ensures that all relevant factors are considered, providing a solid foundation for strategic planning.
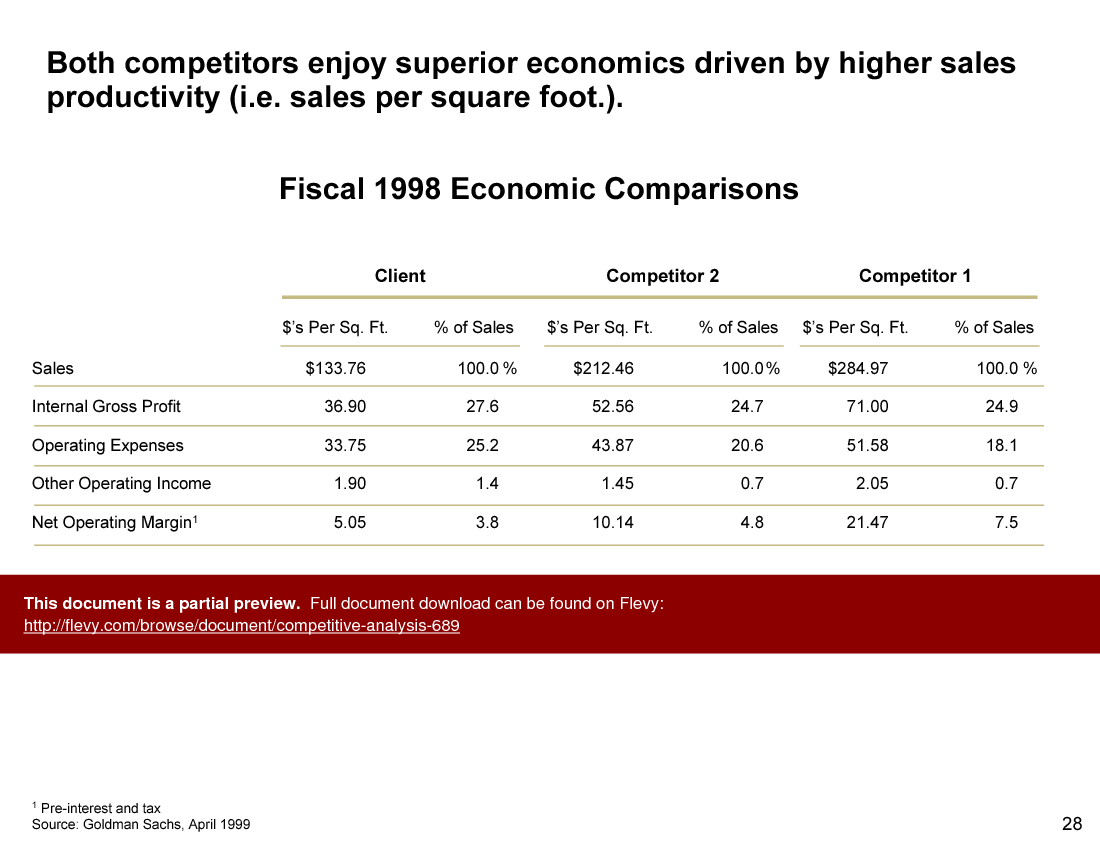
This PPT slide presents a value chain analysis of 2 competitors, focusing on their strengths and weaknesses across 5 key areas: Store Design and Site Selection, Procurement and Logistics, Merchandising, Store Operations and Customer Service, and Advertising.
For Competitor 1, advantages include strategic geographic expansion that leverages logistical benefits and the development of advanced distribution technologies aimed at enhancing product delivery efficiency. However, a significant disadvantage is the rapid expansion that risks damaging its reputation.
Competitor 2 emphasizes a focused regional strategy and prioritizes customer shopping experiences in its store designs, which are notable strengths. They are also in the process of implementing Just-In-Time (JIT) programs to improve distribution and replenishment. On the downside, Competitor 2 faces challenges from a regional player entering multiple markets and lacks sophisticated inventory control systems, which could hinder operational efficiency.
In the merchandising category, Competitor 1 excels with tailored assortments that boost sales in individual stores and maintains a reputation for everyday low pricing. Competitor 2, while having a niche market, struggles with a limited focus on trendy merchandise, which might affect its appeal to a broader customer base.
Both competitors demonstrate strong customer service organizations,, but they differ in advertising effectiveness. Competitor 1 is perceived to have the lowest price among its peers, while Competitor 2 is facing legal challenges related to false advertising claims, which could impact its brand image.
This analysis provides a clear view of where each competitor stands, highlighting areas for potential improvement and strategic focus.
This PPT slide presents a comprehensive overview of a Business System framework, aimed at elucidating the structure and key components of a competitor's operations. It emphasizes critical areas such as manufacturing, distribution, and marketing, which are essential for understanding how a competitor functions within the market.
The manufacturing section highlights the production process, noting that bulk products are primarily produced in a chemical plant, with a focus on enhancing capabilities through investment in state-of-the-art facilities. This suggests a commitment to innovation and efficiency, which is crucial for maintaining operational effectiveness.
In the distribution segment, the slide points out significant sales through wholesalers and distributors, estimating that 40% of U.S. sales were indirect as of 1994. This indicates a reliance on external partners for market penetration, which could be a strategic consideration for assessing competitive positioning.
The U.S. product pipeline is another focal point, detailing ten products in development, including advanced imaging technologies. This showcases the company's proactive approach to product development and market responsiveness.
Value-added services are also discussed, including education, training, and marketing tactics. These services enhance customer engagement and can differentiate the company from its competitors.
The management team is noted as capable, suggesting strong leadership that can drive the organization forward. The slide effectively encapsulates the interconnectedness of various business processes and highlights the importance of each component in the overall strategy. For potential customers, this framework serves as a valuable tool for understanding competitive dynamics and identifying areas for strategic focus.
This PPT slide presents an issue tree that outlines key questions for strategy formulation, emphasizing the importance of competitive analysis in assessing a strategic initiative's viability. The central question, "Is this an attractive opportunity?" branches into 2 primary inquiries: whether the industry is appealing and if the competitive situation is favorable. This structure highlights the necessity of evaluating both market conditions and internal capabilities.
The slide further probes into the value proposition for customers and shareholders, indicating that understanding customer needs and potential shareholder returns is crucial. This dual focus ensures that any strategic move not only aligns with market demands, but also supports financial objectives.
Under the question of capabilities, the slide prompts an evaluation of whether Company X possesses the necessary skills and resources. This is broken down into 4 critical areas: processes, organization, human performance, and technology. Each of these components plays a vital role in determining the company's readiness to seize the identified opportunity.
The overall layout of the slide is designed to guide executives through a systematic approach to strategy development. It encourages a thorough examination of both external market dynamics and internal organizational strengths. By addressing these fundamental questions, executives can make informed decisions that align with their strategic goals. This slide serves as a valuable tool for any organization looking to refine its strategic initiatives and ensure that they are grounded in a comprehensive understanding of both the market and the company's capabilities.
This PPT slide outlines the significance of competitive analysis in strategic development, particularly in the context of eStrategy. It is divided into 3 main sections: Benefits, Caveats, and Competitive Analysis and eStrategy.
In the Benefits section, 3 key points are highlighted. First, competitive analysis serves as a foundational step for defining the marketplace, which is crucial for any organization looking to position itself effectively. Second, it aids in understanding the relative positioning of competitors, allowing firms to identify where they stand in the market. Lastly, it provides insights into potential gaps or areas for growth, which can be vital for strategic planning and resource allocation.
The Caveats section introduces a more cautious perspective. It emphasizes that competitive analysis is just one part of a broader strategic analysis framework and should not be viewed as the sole determinant of strategy. Additionally, it points out the distinction between overarching business strategy and specific competitive tactics, suggesting that a nuanced understanding of both is necessary for effective strategy formulation.
The final section, Competitive Analysis and eStrategy, connects the insights from competitive analysis to the fast-paced digital economy. It notes that eStrategy often focuses on identifying new value creation opportunities. However, a lack of awareness regarding competitors' actions can lead to significant setbacks. This risk is heightened by the rapid evolution of competition in the digital landscape, underscoring the need for timely and informed competitive analysis.
Overall, the slide presents a balanced view of competitive analysis, recognizing its importance while also addressing its limitations in the context of modern strategic development.
This PPT slide presents a comparative analysis of 6 competitors in the healthcare sector, focusing on their overall performance across various metrics. Each competitor is evaluated based on 5 key performance indicators: Membership, Cost Position, Employer Service, Geographic Coverage, Physician Choice, and Hospital Choice.
The visual representation uses a series of filled and partially filled circles to indicate performance levels, with a legend clarifying the criteria for each rating. Competitor 1 stands out as a leader, particularly in Membership and Cost Position, suggesting a strong market presence and effective cost management strategies. Competitor 2 also performs well, exceeding needs in several areas, while Competitor 3 shows a more moderate performance, meeting most needs, but not excelling in any specific category.
Geographic Coverage is another critical metric, with Competitor 4 covering 6 counties, indicating a broader reach compared to others. The Physician Choice metric highlights the number of primary care physicians (PCPs) available, with Competitor 5 offering over 2,000, which could be a significant draw for potential customers seeking extensive healthcare options.
The slide concludes with a Strategic Focus column, outlining each competitor's primary initiatives. Notably, Competitor 1 is focused on Network Rationalization, while others emphasize Membership Growth and Diversification. This information is crucial for stakeholders looking to understand where each competitor is directing their strategic efforts and how that aligns with market demands.
Overall, this slide serves as a valuable tool for assessing the relative strengths and weaknesses of competitors in the healthcare market, enabling informed decision-making for potential customers.
This PPT slide presents a strategic overview of buyer value positioning for a telecommunications client, focusing on 4 key dimensions: Product Performance, Price, Service, and Product Line Breadth. Each dimension is illustrated on a spectrum from low to high, with the client and its competitors positioned accordingly.
In the Product Performance category, the client is positioned closer to the high end, indicating a strong offering compared to its competitors. This suggests an opportunity for the client to leverage its product strengths in marketing and sales strategies. The Price dimension shows the client positioned at a low price point, which may imply a cost-effective strategy that could attract price-sensitive customers. However, this positioning also raises questions about the perceived value and quality of the offering.
Service is another critical area, where the client again finds itself positioned towards the higher end. This suggests that the client has a competitive edge in customer service, which can be a significant differentiator in the telecommunications sector. The Product Line Breadth dimension indicates a specialty focus, suggesting that while the client may not offer a wide range of products, it excels in specific areas. This could be a strength if marketed correctly, appealing to niche markets.
Overall, the slide highlights several positioning opportunities for the client. It emphasizes the importance of aligning product strengths with market needs and suggests that the client could benefit from refining its pricing strategy to enhance perceived value. The visual representation allows for quick assessment of competitive positioning, making it a valuable tool for strategic decision-making.
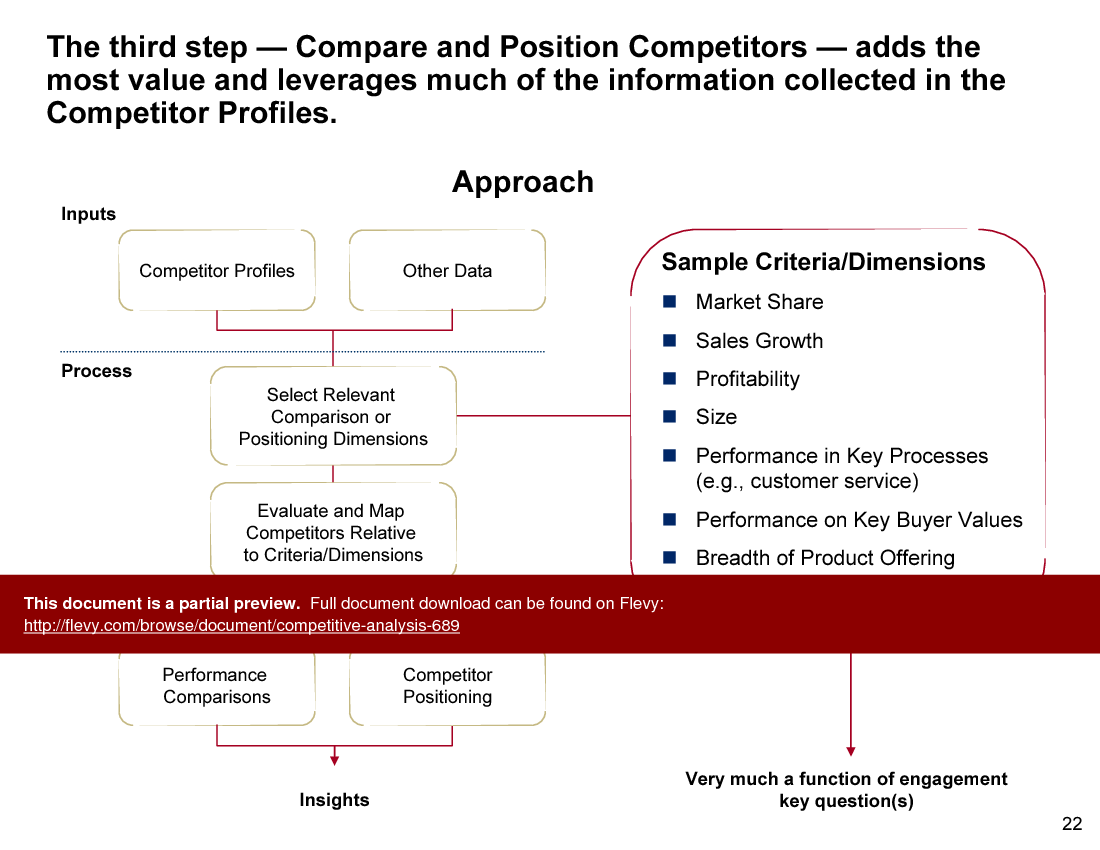
This PPT slide outlines the critical components of a competitor analysis framework, emphasizing the importance of time and resource availability in shaping the analysis's breadth and depth. The structure is divided into 3 main steps: defining the competitor set, profiling competitors, and comparing and positioning competitors. Each step is essential for a comprehensive understanding of the market dynamics.
The sources of information for the analysis are categorized into 2 sections. The first section lists various methods for gathering data, including consulting company rankings, interviewing management, and utilizing investment analyst reports. These methods are designed to provide a foundational understanding of the competitive environment. The second section focuses on specific types of materials that can be leveraged, such as company-provided documents, industry reports, and trade magazines. This dual approach ensures that the analysis is both qualitative and quantitative, drawing from diverse sources to create a well-rounded perspective.
Insights provided at the bottom of the slide highlight the value of interviews with management and recent hires, noting that customers often yield the most relevant information regarding competitor capabilities. Analyst reports are also mentioned as a valuable resource for third-party insights. The slide suggests that annual reports can serve as a source for high-level financial analysis, further enhancing the depth of the competitor analysis.
Overall, the slide serves as a practical guide for executives looking to conduct a thorough competitor analysis, emphasizing that the quality of insights gained is heavily influenced by the methods and resources employed in the process.
This PPT slide focuses on the critical process of defining a competitor set for effective market analysis. It emphasizes the importance of identifying key players and the fastest-growing entities based on either value or volume metrics. Two examples are provided, illustrating market share dynamics over time—specifically, the years 1993 and 1998.
In the upper section, market value shares are depicted, showing how different competitors' shares have shifted between the 2 years. The visual representation indicates percentage changes, highlighting both gains and losses in market share. For instance, Company A shows a significant increase in value share from 1993 to 1998, while other competitors exhibit varying degrees of decline or growth. This visual aids in understanding how market positioning can evolve, which is crucial for strategic planning.
The lower section mirrors this analysis, but focuses on market volume shares. Similar trends are illustrated, with companies experiencing fluctuations in their volume shares over the same period. This dual approach allows for a comprehensive view of the competitive environment, considering both value and volume perspectives.
The right side of the slide lists competitors alongside their respective compound annual growth rates (CAGR) for both value and volume. This data is essential for assessing not just current standings, but also growth trajectories, enabling informed decision-making regarding market entry or expansion strategies.
Overall, this slide serves as a foundational tool for executives looking to understand their competitive positioning and identify strategic opportunities based on market dynamics.
This PPT slide outlines a structured approach to competitive analysis, emphasizing the importance of defining, profiling, and comparing competitors. It begins with 3 starting points: a key question, an issue tree, and a research plan. These elements serve as the foundation for the analysis, ensuring that the focus remains on the most relevant competitors.
The first section, "Define the Relevant Competitor Set," highlights the need to establish an initial competitive set and set screening criteria. This step is crucial as it directs the analysis toward the most pertinent competitors, although it can be challenging to identify new entrants or emerging threats.
Next, the slide discusses the "Profile Competitors" phase. Here, the objective is to summarize competitor performance in a standardized format. This includes understanding each competitor's strategic intent, strengths, weaknesses, and product offerings. A tailored framework based on specific information and client needs is suggested to enhance the profiling process.
The final section, "Compare and Position Competitors," focuses on evaluating competitors along common criteria such as capabilities and customer attributes. This comparison aims to identify potential threats and opportunities, providing a clear view of where each competitor stands in relation to one another.
The "Next Step" section indicates that insights gained from this analysis will be instrumental in shaping overall strategy. This structured approach not only clarifies the competitive environment, but also aids in strategic decision-making, making it a valuable tool for any organization looking to refine its market positioning. Overall, the slide presents a methodical framework that can lead to more informed strategic choices.
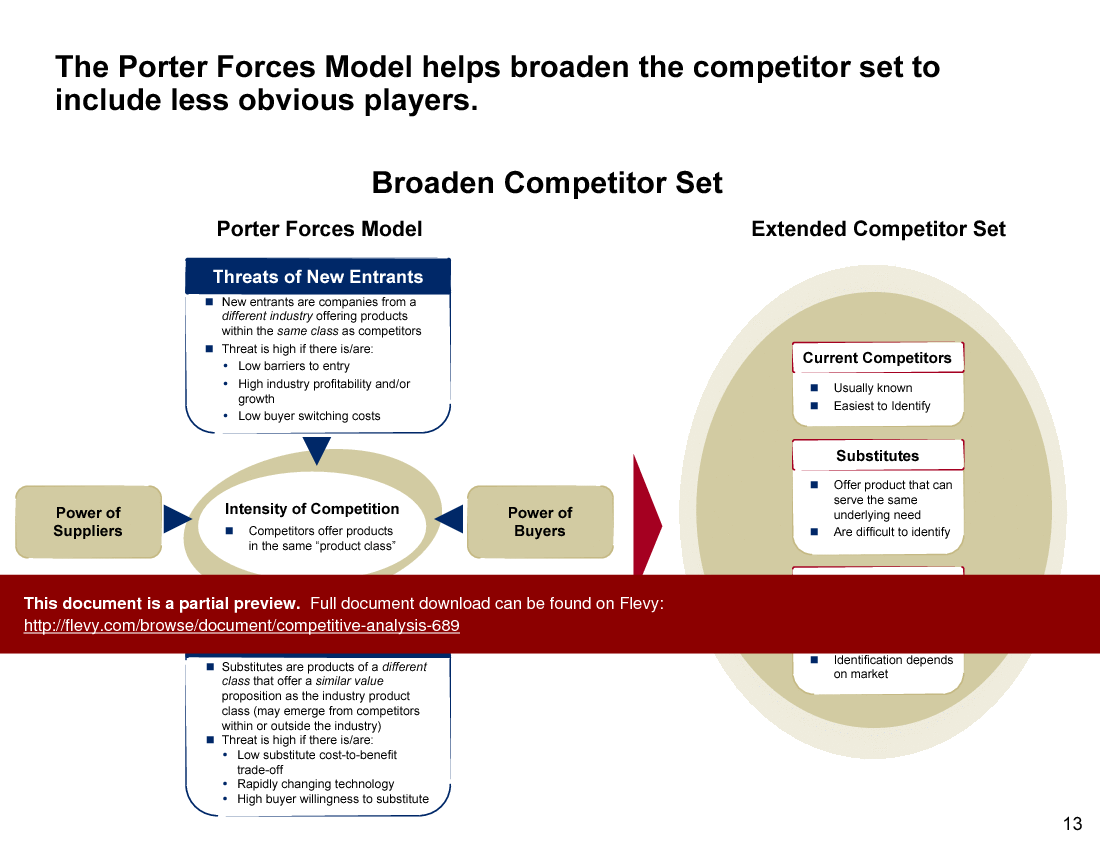
This PPT slide presents the Porter Forces Model, emphasizing its role in expanding the understanding of the competitive environment. It highlights the importance of identifying not just direct competitors, but also less obvious players that can impact market dynamics. The model categorizes competitors into distinct groups: current competitors, substitutes, and new entrants.
The section on "Threats of New Entrants" indicates that these are companies from different industries that offer products within the same class as existing competitors. The slide notes that the threat level is influenced by factors such as low barriers to entry, high industry profitability, and low buyer switching costs. This suggests that organizations must remain vigilant about potential new players that could disrupt market stability.
The "Intensity of Competition" section points out that competitors provide products within the same product class, which can lead to heightened rivalry. Understanding this intensity is crucial for strategic positioning and resource allocation.
The slide also addresses the "Threat of Substitutes," which refers to products from different classes that fulfill similar needs. These substitutes can be challenging to identify, making it essential for businesses to broaden their analysis beyond traditional competitors.
The right side of the slide introduces the "Extended Competitor Set," which includes current competitors, substitutes, and new entrants. Each category is briefly described, emphasizing that current competitors are typically the easiest to identify, while substitutes can serve the same underlying need, but are often overlooked. New entrants can emerge quickly, and their identification may depend on various market factors.
Overall, this slide serves as a valuable tool for understanding the broader competitive landscape, encouraging organizations to think beyond their immediate rivals.
Explore our Competitive Analysis PPT, crafted by industry experts, to master competitor positioning and enhance your strategic initiatives with proven methodologies.
Since 2012, we have provided best practices to over 10,000 businesses and organizations of all sizes, from startups and small businesses to the Fortune 100, in over 130 countries.
Read Customer Testimonials
"My FlevyPro subscription provides me with the most popular frameworks and decks in demand in today’s market. They not only augment my existing consulting and coaching offerings and delivery, but also keep me abreast of the latest trends, inspire new products and service offerings for my practice, and educate me
in a fraction of the time and money of other solutions. I strongly recommend FlevyPro to any consultant serious about success.
"
– Bill Branson, Founder at Strategic Business Architects
"Flevy.com has proven to be an invaluable resource library to our Independent Management Consultancy, supporting and enabling us to better serve our enterprise clients.
The value derived from our [FlevyPro] subscription in terms of the business it has helped to gain far exceeds the investment made, making a subscription a no-brainer for any growing consultancy – or in-house strategy team."
– Dean Carlton, Chief Transformation Officer, Global Village Transformations Pty Ltd.
"FlevyPro has been a brilliant resource for me, as an independent growth consultant, to access a vast knowledge bank of presentations to support my work with clients. In terms of RoI, the value I received from the very first presentation I downloaded paid for my subscription many times over! The
quality of the decks available allows me to punch way above my weight – it's like having the resources of a Big 4 consultancy at your fingertips at a microscopic fraction of the overhead.
"
– Roderick Cameron, Founding Partner at SGFE Ltd
"Flevy is now a part of my business routine. I visit Flevy at least 3 times each month.
Flevy has become my preferred learning source, because what it provides is practical, current, and useful in this era where the business world is being rewritten.
many challenges and there is the need to make the right decisions in a short time, with so much scattered information, we are fortunate to have Flevy. Flevy investigates, selects, and puts at our disposal the best of the best to help us be successful in our work.
"
– Omar Hernán Montes Parra, CEO at Quantum SFE
"One of the great discoveries that I have made for my business is the Flevy library of training materials.
As a Lean Transformation Expert, I am always making presentations to clients on a variety of topics: Training, Transformation, Total Productive Maintenance, Culture, Coaching, Tools, Leadership Behavior, etc. Flevy
It is well worth the money to purchase these presentations. Sure, I have the knowledge and information to make my point. It is another thing to create a presentation that captures what I want to say. Flevy has saved me countless hours of preparation time that is much better spent with implementation that will actually save money for my clients.
"
– Ed Kemmerling, Senior Lean Transformation Expert at PMG
"I like your product. I'm frequently designing PowerPoint presentations for my company and your product has given me so many great ideas on the use of charts, layouts, tools, and frameworks. I really think the templates are a valuable asset to the job."
– Roberto Fuentes Martinez, Senior Executive Director at Technology Transformation Advisory
"I have found Flevy to be an amazing resource and library of useful presentations for lean sigma, change management and so many other topics. This has reduced the time I need to spend on preparing for my performance consultation. The library is easily accessible and updates are regularly provided. A wealth of great information."
– Cynthia Howard RN, PhD, Executive Coach at Ei Leadership
"As an Independent Management Consultant, I find Flevy to add great value as a source of best practices, templates and information on new trends. Flevy has matured and the quality and quantity of the library is excellent. Lastly the price charged is reasonable, creating a win-win value for
the customer, Flevy and the various authors. This is truly a service that benefits the consulting industry and associated clients. Thanks for providing this service.
"
– Jim Schoen, Principal at FRC Group
Save with Bundles
This document is available as part of the following discounted bundle(s):
Download our free compilation of 50+ Strategy & Transformation slides and templates. Frameworks include McKinsey 7-S, Balanced Scorecard, Disruptive Innovation, BCG Curve, and many more.