Editor's Note: Take a look at our featured best practice, Comprehensive Guide to Financial Statement Analysis (89-slide PowerPoint presentation). This document provides a detailed step-by-step guide on how to analyse financial statements. Designed for anyone who wants to understand how to review financial data and interpret the findings, the document is split into the following sections:
Introduction to financial statements
1. Income [read more]
* * * *
In any economy, the role played by the Consumer / FMCG (fast-moving consumer goods) sector cannot be overemphasized. These products are required for daily sustenance and therefore have stable demand and deep penetration, across developed and emerging markets.
As opposed to pure-play consumer/ FMCG products, Consumer Discretionary Services (CDS) reflect consumer spending which is largely discretionary in nature. These are the services which help improve consumers’ quality of living. While expenditure on FMCGs is a necessity for most, the same cannot be said about Consumer Discretionary Services. As disposable incomes grow, we believe expenditure on Consumer Discretionary Services may corner a growing share of the consumer’s wallet, going ahead, vis-à-vis expenditure on FMCGs. Penetration of CDS in India may improve substantially in future.
Rising expenditure on Consumer Discretionary Services could translate into higher revenues and profits for companies belonging to the sector, which could potentially drive price performance of Consumer Discretionary Services stocks, going ahead.
BQiT Consumer Discretionary Services Index
We constructed a ‘Consumer Discretionary Services’ Index, which captures the trend in the free-float market cap of a basket of stocks within the space, belonging to the following segments:
Multiplexes
QSR/Food Delivery
Travel and Leisure
Cable/DTH/Internet Providers
Theme Parks
Fitness Services
Skincare and Beauty Services
Gaming and Entertainment
Objective
The objective of constructing the BQiT Consumer Discretionary Services Index, is to ascertain investor appetite for this basket of stocks, as captured by the performance of the Index, in absolute terms, as well as relative to comparable and broad-market indexes.
Sectors such as banking, telcos and education are excluded from the Index, since these are considered essential services and not discretionary.
Index Constituents
For the Index, we selected the following 12 stocks, covering the gamut of Consumer Discretionary Services, on the basis of criteria of business model, brands, national presence, management capabilities, revenue size, balance sheet and market capitalization:
PVR Ltd.
Inox Leisure Ltd.
Jubilant FoodWorks Ltd.
Westlife Development Ltd.
Thomas Cook India Ltd.
Cox & Kings Ltd.
Dish TV India Ltd.
Hathway Cable & Datacom Ltd.
Wonderla Holidays Ltd.
Talwalkars Better Value Fitness Ltd.
Kaya Ltd.
Delta Corp Ltd.
All of these companies were profit making in FY16, except Thomas Cook India Ltd. and Hathway Cable & Datacom Ltd.
However, we would like to clarity that merely by including them in our Index, we are not recommending any of these stocks.
Also, free-float market cap is not the same as stock price returns, where the free float has changed significantly. For instance, stock price of PVR Ltd. grew by 51.1% during the above period, while its free-float market cap grew by 78.9%, due to increase in price and free float.
Methodology
The Index is based on the free-float methodology, and computed using daily values, for the last 2 years, i.e. for the period July 7, 2014 to July 5, 2016. We have also compared the BQiT CDS Index with Nifty India Consumption Index, the Nifty FMCG Index and the Nifty 50 Index, for the same period.
Quarterly free-float data has been considered. Issue of capital has been incorporated into free float market cap from the date of issue. Dividends have not been considered.
Nifty India Consumption Index comprises of companies in the FCMG, hospitals, pharmaceuticals, paints, automobiles, apparel, telecom, media and energy segments in both product and service categories. This index does not differentiate between product and services businesses.
In contrast, the BQiT CDS Index focuses exclusively on Services businesses.
The only stock common to both indexes, is Jubilant FoodWorks Ltd.
Observations
The BQiT CDS Index has performed in line with the Nifty India Consumption Index and the Nifty FMCG Index, over the 2-year period. Particularly, the performance of the BQiT CDS Index was spectacular in the first 13-odd months, i.e., during the period July 2014-August 2015.
However, the Index underperformed the Nifty India Consumption Index, the Nifty FMCG Index and the Nifty 50 Index over the last 12 months, giving negative returns. Index heavyweights PVR (+70.7%), Thomas Cook India (+64.8%) and Inox Leisure (+39.0%) supported the Index performance over the last 12 months.
The overall underperformance of the BQiT CDS Index over the last 12 months is largely attributable to the underperformance of other Index-heavyweights Jubilant FoodWorks (-36.0%), Hathway Cable & Datacom (-34.0%), Cox & Kings (-31.9%) and Westlife Development (-18.2%), over the last 12 months.
Valuations
Typically, service businesses command a valuation premium over product businesses. Going ahead, based on financial performance, these companies could fetch better valuations vs. FMCG companies.
Likely Spin-offs
Such valuation premium, commanded by service businesses over product businesses, is the primary reason why CDS businesses could be carved out from product-focused businesses and spun off into separate entities. Kaya Ltd., formerly Marico Kaya Enterprises Ltd., which was spun off from Marico Ltd. and listed as an independent entity, is a key example.
Conclusion
Over the last 2 years, the BQiT CDS Index has outperformed the Nifty FMCG Index. However, over the last 12 months, investors seem to have preferred FMCG stocks over CDS stocks, judging by the sector’s underperformance relative to the Nifty FMCG index. Financial Overview Sector Aggregates (RsCr)
Full Market Cap
49,823
Gross Block
12,818
Free float Market Cap
22,645
Long-term Debt
6,965
Sales FY16
19,419
Debt-equity ratio
0.73
EBITDA FY16
3,738
P/e FY16
81.3
PAT FY16
612
P/c FY16
21.6
RoE
6.4%
P/b FY16
5.2
EBITDA margin
19.2%
P/s FY16
2.6
Note
Consolidated financials considered.
Comments on Financials
Sector PAT is impacted by the losses reported by Thomas Cook India Ltd. and Hathway Cable & Datacom Ltd., leading to high p/e multiple for the sector.
The sector reported a very low RoE of 6.4% in FY16. The debt-equity ratio is high at 0.73x. The fixed assets turn stands at a low 1.5x, which indicates asset-heavy business models.
We believe these ratios do not do justice to the robust business models and potential of the companies within the sector. A significant improvement in these ratios is essential to retain investor interest in these stocks.
Index Constituents Overview
Name of Sector / Company
Total No. of Shares Cr
Free Float Shares Cr
Price Rs
Full Market Cap RsCr
Free Float Mkt Cap RsCr
Weight in Index
Movie Exhibition
PVR Ltd.
4.67
3.47
1003
4,683
3,478
15.4%
Inox Leisure Ltd.
9.65
4.92
247
2,383
1,215
5.4%
QSR/Food Delivery
Jubilant FoodWorks Ltd.
6.58
3.38
1233
8,114
4,165
18.4%
Westlife Development Ltd.
15.56
5.88
249
3,865
1,462
6.5%
Travel and Leisure
Thomas Cook India Ltd.
36.59
11.77
223
8,150
2,622
11.6%
Cox & Kings Ltd.
16.93
8.62
173
2,927
1,491
6.6%
Cable/DTH/Internet Providers
Dish TV India Ltd.
106.59
37.90
99
10,515
3,739
16.5%
Hathway Cable & Datacom Ltd.
83.05
46.94
34
2,836
1,603
7.1%
Theme Parks
Wonderla Holidays Ltd.
5.65
1.64
399
2,254
654
2.9%
Fitness Services
Talwalkars Better Value Fitness Ltd.
2.97
1.84
237
703
436
1.9%
Skincare and Beauty Services
Kaya Ltd.
1.29
0.51
886
1,143
449
2.0%
Gaming and Entertainment
Delta Corp Ltd.
23.07
13.64
98
2,251
1,331
5.9%
TOTAL
49,823
22,645
100.0%
What Next?
Investor appetite for companies belonging to CDS segments has been strong in the past.
A few CDS companies have raised private equity funding over the last few years. We believe companies belonging to CDS segments such as spas and salons, food delivery, facilities management, etc. could go public.
A number of CDS companies such as VLCC Health Care Ltd. (Beauty and Fitness), Jawed Habib Hair & Beauty Ltd. (beauty salons), have already filed DRHPs for their IPO. Companies like Richfeel Health and Beauty Pvt. Ltd. (hair care) could seek further PE funding and eventually go public. This is an indicative list only, and not an exhaustive list.
Annexure Chart
BQiT CDS Index: Market Cap Weights
Disclaimer
This blog article is for educational purpose only, and not meant to be investment advice, or a recommendation or solicitation to buy, or sell, the securities named herein. It is based primarily on information publicly available, including company websites, published financial results, annual reports, analyst presentations, media reports, etc.
The author does not claim accuracy of his opinions and estimates as contained in this article. While the author has taken reasonable care to avoid errors or misstatements of facts, he does not accept responsibility for errors, if any, in this article.
In any case, the author will not be liable for losses, if any, arising from the use of this article.
This document explains the financial statement analysis process. Most slides are instructional and covered topics include the financial statement analysis process, financial ratios analysis, accounting information (assumptions, principles, policies, procedures), and others.
Financial [read more]
Do You Want to Implement Business Best Practices?
You can download in-depth presentations on Financial Analysis and 100s of management topics from the FlevyPro Library. FlevyPro is trusted and utilized by 1000s of management consultants and corporate executives.
For even more best practices available on Flevy, have a look at our top 100 lists:
These best practices are of the same as those leveraged by top-tier management consulting firms, like McKinsey, BCG, Bain, and Accenture. Improve the growth and efficiency of your organization by utilizing these best practice frameworks, templates, and tools. Most were developed by seasoned executives and consultants with over 20+ years of experience.
Readers of This Article Are Interested in These Resources
Evaluating Financial Ratios (or Financial Comparables) is a crucial method for evaluating the financial and competitive health of a company relative to its competitive peers. This document provides an overview to Financial Analysis, as well as deep dive into 20 widely used Financial [read more]
User friendly and easy customizable guide to the world of Financial Ratios and Valuation Multiples.
A must have Financial tool for anyone performing Financial Modeling and Financial Analysis.
The template is a detailed guide of Financial Ratios and their application on Financial Statements and [read more]
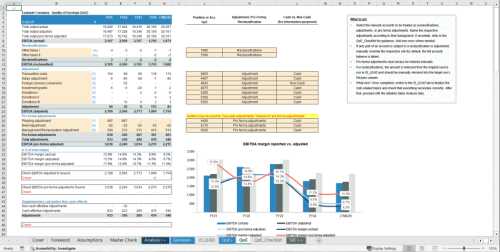
Purpose of the tool
This Excel-based Quality of Earnings (QoE) Model provides a structured framework to analyse the underlying earnings quality of a business by reconciling reported financials to adjusted and pro-forma results. It enables you to capture and classify reclassifications, [read more]
Curated by McKinsey-trained Executives
PART I: THE EVOLVING ROLE OF THE CFO
1. The Strategic Imperative of the Modern CFO
• 1.1 The CFO as a Corporate Strategist
• 1.2 Navigating the C-Suite: Board and CEO Collaboration
• 1.3 CFO vs. Controller vs. Treasurer: Distinctions and [read more]
 In any economy, the role played by the Consumer / FMCG (fast-moving consumer goods) sector cannot be overemphasized. These products are required for daily sustenance and therefore have stable demand and deep penetration, across developed and emerging markets.