Editor's Note: Take a look at our featured best practice, Comprehensive Guide to Financial Statement Analysis (89-slide PowerPoint presentation). This document provides a detailed step-by-step guide on how to analyse financial statements. Designed for anyone who wants to understand how to review financial data and interpret the findings, the document is split into the following sections:
Introduction to financial statements
1. Income [read more]
* * * *
These two stocks have been the market favorites for the last few years, and have generated returns far in excess of the market. We decided to analyze why Eicher Motors may have outperformed Page Industries, when many similarities exist between the two companies.
We are not commenting on the future financial performance or target price of the two companies.
Background
Eicher Motors Ltd. and Page Industries Ltd. operate in totally diverse industries. Eicher Motors Ltd. operates in the automobile sector and is a leading manufacturer of commercial vehicles (trucks and buses), motorcycles and personal utility vehicles. Page Industries Ltd. is an apparel manufacturer and the India master franchisee of Jockey International of the U.S.
In other words, while Eicher Motors Ltd. is primarily into B2B, Page Industries Ltd. is only into B2C.
We review how the businesses of the two have evolved over the last few years.
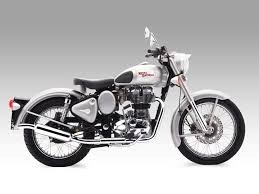
Eicher Motors Ltd.: Royal Enfield – the Game Changer
We note that the share of Royal Enfield motorcycles in the company’s sales grew aggressively over the last 5 years. The motorcycle business has proven to be the game-changer for the company’s financial performance and valuations. Manufacturing capacity has been raised 9x since 2010.
Royal Enfield Sales Data
2011
2012
2013
2014
2015
Gross Sales (incl. excise) RsCr
662.85
1,073.65
1,763.06
3,074.41
N.A.
Sales Volume
74,626
113,432
178,121
302,592
452,759
Volume Growth y-o-y
41.9%
52.0%
57.0%
69.9%
49.6%
Average Sales Realisation Rs
88,823
94,651
98,981
101,602
N.A.
% of Company Sales
10.8%
15.3%
23.7%
32.9%
N.A.
Company Gross Sales RsCr
6,130.29
6,995.04
7,433.29
9,351.74
N.A.
Royal Enfield sales volumes grew 7.6x, at 53.8% CAGR, during FY10-15. Royal Enfield enjoyed industry best EBIT margin of 25.2% in CY15. The manufacturing capacity is to be ramped up from 0.6mn units p.a., to 0.62mn p.a. during 2016, and further to 0.9mn by 2018. 1 new product is to be launched by end-2017.
We expect the share of Royal Enfield motorcycles to move up, within the company’s consolidated sales, going ahead.
Page Industries: Riding the Consumerism Boom, on the back of Rising Share of Organized Sector
Page Industries has also been ramping capacities up over the last few years, and its Jockey brand has become a force to reckon with, in the innerwear market. It is riding on the consumption boom and fast growing market for ladies’ innerwear in India. The rising share of unorganized sector in the innerwear market is a key positive for Page Industries, which is already a leading player in the segment.
What Do These Two Diverse Companies Have in Common?
We note that there are a few similarities between the two companies, such as:
Strong brands, backed by wide distribution network
Strong management teams
Track record of aggressive revenue growth
Consistently growing post-tax profit
Strong RoE
High dividend payout
Strong balance sheets, with near-zero leverage
No bonus issues or stock splits
We carried out a Comparison between the two and tabulated the same along a few criteria as contained later in this article.
Conclusion: Royal Enfield has been the Game Changer for Eicher Motors Ltd.
Based on our analysis as contained in this article, we conclude that investors seem to have clearly favored Eicher Motors Ltd. over Page Industries Ltd, in terms of stock price returns.
The one single reason we can think of which led to outperformance of Eicher Motors, is the 7.6x sales volume growth in Royal Enfield motorcycles since 2010, particularly after the launch of the Royal Enfield ‘Classic’.
In contrast, the innerwear segment in which Page Industries operates, remains competitive, with most leading global players already present in the Indian innerwear market.
Eicher Motors’s outperformance vis-à-vis Page Industries is significant in the backdrop of higher liquidity (trading volumes) enjoyed by the former, that too, in spite of slightly lower free-float and institutional ownership, than the latter. However, a much larger number of FIIs and MFs have invested in Eicher Motors than in Page Industries. Retail ownership is also higher in case of Eicher Motors Ltd.
The Road Ahead: Businesses Remain Robust; Investors Could Benefit from a Stock Split
Eicher Motors will likely continue to ride on the success of Royal Enfield motorcycles, by raising the manufacturing capacities. While the motorcycle market in India shrunk in 2015, the share of the premium segment, in which Royal Enfield has a strong presence, is in fact growing. This bodes well for the company.
Page Industries too will continue to grow by increasing manufacturing capacities. It entered the niche swimwear segment by tying up with the Speedo brand a few years ago.
As stated above, neither company has made any issue of bonus shares or split the stock. Both stocks have become “high-priced” stocks since the last 4-5 years, materially hampering liquidity. We believe investors could benefit, if the companies were to split the stock into face value of Rs5 or Rs2 per share.
Revenue and Profit Track Record
(Figures in RsCr unless stated otherwise)
Eicher Motors
Page Industries
Sales CY15 / FY15
11,924
1,543
Sales FY16 YTD
1,348
5-year Sales CAGR
22.1%
35.4%
EBITDA CY15 / FY15
1,807
319
EBITDA FY16 YTD
286
5-year EBITDA CAGR
38.1%
37.9%
PAT CY15 / FY15
943
196
PAT FY16 YTD
175
5-year PAT CAGR
37.9%
37.7%
3-year Average EBITDA margin
12.8%
20.8%
Effective Average Tax Rate (last 3 years)
27.1%
33.1%
RoE CY15 / FY15
27.3%
42.9%
Dividend Payout ratio CY14 / FY15
26.4%
48.9%
Note: Eicher Motors has been in existence much before Page Industries. While Eicher Motors was incorporated in 1959, Page Industries was incorporated in 1994. Besides, the nature of the business partly explains the higher revenue size of Eicher Motors. The higher revenue CAGR of Page Industries can be attributed to smaller base. In spite of lower revenue CAGR, Eicher Motors’s EBITDA and PAT CAGR is almost the same as of Page Industries.
Balance Sheet Numbers
(Figures in RsCr unless stated otherwise)
Eicher Motors
Page Industries
Paid-up Equity Share Capital
27.15
11.15
Reserves
3,429
445
Gross Block
3,255
214
Debt
0
30.85
Cash
569
6.79
EV
50,752
11,044
Debt-Equity ratio (x)
0.00
0.07
Note: Eicher Motors is in the automobile industry and has an asset-heavy business model. Its gross block (consolidated financials) is significantly higher than that of Page Industries. However, so is its market capitalization.
Cash Flow from Operations
(Figures in RsCr)
Eicher Motors
Page Industries
CY12 / FY13
496.02
87.14
CY13 / FY14
716.20
74.01
CY14 / FY15
1047.47
167.00
Note: Eicher Motors generates much higher CFO than Page Industries in relation to revenue size.
Stock Data
(Figures in Rs unless stated otherwise)
Eicher Motors
Page Industries
Face Value
10
10
Price (Feb-29-2016)
18,900
9,880
No. of Shares Cr
2.715
1.115
Free Float Shares Cr
1.225
0.547
Market Cap RsCr
51,321
11,020
Free Float Market Cap RsCr
23,154
5,400
Per Share Metrics
(Figures in Rs)
Eicher Motors
Page Industries
EPS TTM
347
199
CEPS TTM
474
219
Book value
1,273
409
Dividend per Share
50
72
Valuations
Eicher Motors
Page Industries
P/e (ttm)
54.4
49.5
P/c (ttm)
39.9
45.1
P/b (ttm)
14.8
24.1
P/s (ttm)
4.3
7.1
EV/EBITDA
28.1
34.6
Dividend Yield
0.3%
0.7%
EV RsCr
50,752
11,044
Note: These valuations do not constitute advice to buy or sell the stocks discussed.
Stock Ownership Pattern
Eicher Motors
Page Industries
Promoter Stake
54.9%
51.0%
Free Float
45.1%
49.0%
FII Holding
26.6%
34.3%
DII Holding
4.9%
5.4%
Retail Holding
13.6%
9.3%
No. of FII Investors
483
122
No. of MF Investors
200
40
No. of Retail Investors
66,053
27,475
Note: Eicher Motors has a much higher absolute number free float shares, than Page Industries. It also has much higher number of FII, MF and retail investors, vis-à-vis Page Industries.
Trading Volumes and Stock Returns
Eicher Motors
Page Industries
Avg. Daily Volumes (NSE) Last 12 mths
78,800
12,100
Avg. Daily Turnover (NSE) Last 12 mths
141.3
16.5
Avg. Deliverable Volumes (NSE) Last 12 mths
49%
54%
Daily Volume as % of Free Float
0.6%
0.2%
Daily Volume as % of Retail Holdings
2.1%
1.2%
3-year Returns
582%
196%
Returns since Page Industries Listing
6184%
3535%
Beta
0.35
0.45
Note: Higher trading volumes for Eicher Motors can be attributed to higher number of free float shares and retail investors. Eicher Motors’s trading volumes are higher in relation to its free float and retails holdings too. Both stocks enjoy comfortably high deliverable volumes, highlighting high share of delivery-based buying.
We computed returns for both stocks since the listing of Page Industries on March 16, 2007. Eicher Motors has given far superior returns, not just vis-à-vis NSE Nifty 50, but vis-à-vis Page Industries Ltd. too, over the last 3 years, and since listing of Page industries.
Notes
Consolidated figures have been considered for Eicher Motors Ltd.
Eicher Motors used to follow the calendar year as its financial year. However, it will revert to the financial year and hence its current financial year will have 15 months, ending on March 31, 2016. The company’s FY15 figures in above tables should be considered as CY15, and so on.
Balance sheet figures are as at December 31, 2015 for Eicher Motors Ltd. and as at September 30, 2015 for Page Industries Ltd.
Beta computed for the period March 16, 2007, to February 29, 2016. Beta is relative to NSE Nifty 50 for Eicher Motors, and to Nifty Midcap 100 for Page Industries.
Stock ownership patterns as at December 31, 2015.
Relative Stock Price Performance over Last 3 Years
Eicher Motors has squarely beaten not just the Nifty 50 index, but also Page Industries over the last 3 years.
Disclaimer
This blog article is for educational purpose only, and not meant to be investment advice, or a recommendation or solicitation to buy, or sell, the securities named herein. It is based primarily on information publicly available, including company websites, published financial results, annual reports, analyst presentations, media reports, etc.
The author does not claim accuracy of his opinions and estimates as contained in this article. While the author has taken reasonable care to avoid errors or misstatements of facts, he does not accept responsibility for errors, if any, in this article.
In any case, the author will not be liable for losses, if any, arising from the use of this article.
This document explains the financial statement analysis process. Most slides are instructional and covered topics include the financial statement analysis process, financial ratios analysis, accounting information (assumptions, principles, policies, procedures), and others.
Financial [read more]
Do You Want to Implement Business Best Practices?
You can download in-depth presentations on Financial Analysis and 100s of management topics from the FlevyPro Library. FlevyPro is trusted and utilized by 1000s of management consultants and corporate executives.
For even more best practices available on Flevy, have a look at our top 100 lists:
These best practices are of the same as those leveraged by top-tier management consulting firms, like McKinsey, BCG, Bain, and Accenture. Improve the growth and efficiency of your organization by utilizing these best practice frameworks, templates, and tools. Most were developed by seasoned executives and consultants with over 20+ years of experience.
Readers of This Article Are Interested in These Resources
User friendly and easy customizable guide to the world of Financial Ratios and Valuation Multiples.
A must have Financial tool for anyone performing Financial Modeling and Financial Analysis.
The template is a detailed guide of Financial Ratios and their application on Financial Statements and [read more]
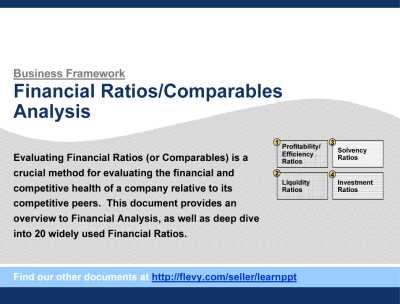
Evaluating Financial Ratios (or Financial Comparables) is a crucial method for evaluating the financial and competitive health of a company relative to its competitive peers. This document provides an overview to Financial Analysis, as well as deep dive into 20 widely used Financial [read more]
Curated by McKinsey-trained Executives
The presentation follows the headline-body-bumper slide format used by global consulting firms.
Master Financial Statement Analysis with our Comprehensive Toolkit
In the dynamic world of finance, making informed decisions is paramount. Whether you're [read more]
Ratios in isolation are meaningless. A company's ratios must be examined over time and/or against its competitors? ratios. Ratio analysis is an art as well as a science.
Ratio analysis requires keen judgment.
- Which ratios are most important in a given situation?
- What items should be [read more]
 These two stocks have been the market favorites for the last few years, and have generated returns far in excess of the market. We decided to analyze why Eicher Motors may have outperformed Page Industries, when many similarities exist between the two companies.