
Security Monitoring Business Financial Model Dashboard – Excel XLSX
Excel (XLSX)
VIDEO DEMO
INTEGRATED FINANCIAL MODEL EXCEL DESCRIPTION
Recent update: Added interconnected financial statements (monthly and annual), dynamic capitalization table, capex with depreciation logic, and better global control tab assumptions.
A security monitoring service is fairly close to traditional software-as-a-service (SaaS) or product-as-a-service (PaaS) methodology. It differs a little from both though and requires a specifically tailored financial model that is nuanced enough to capture the logical structures required to build a proper bottom-up financial forecast for such an industry.
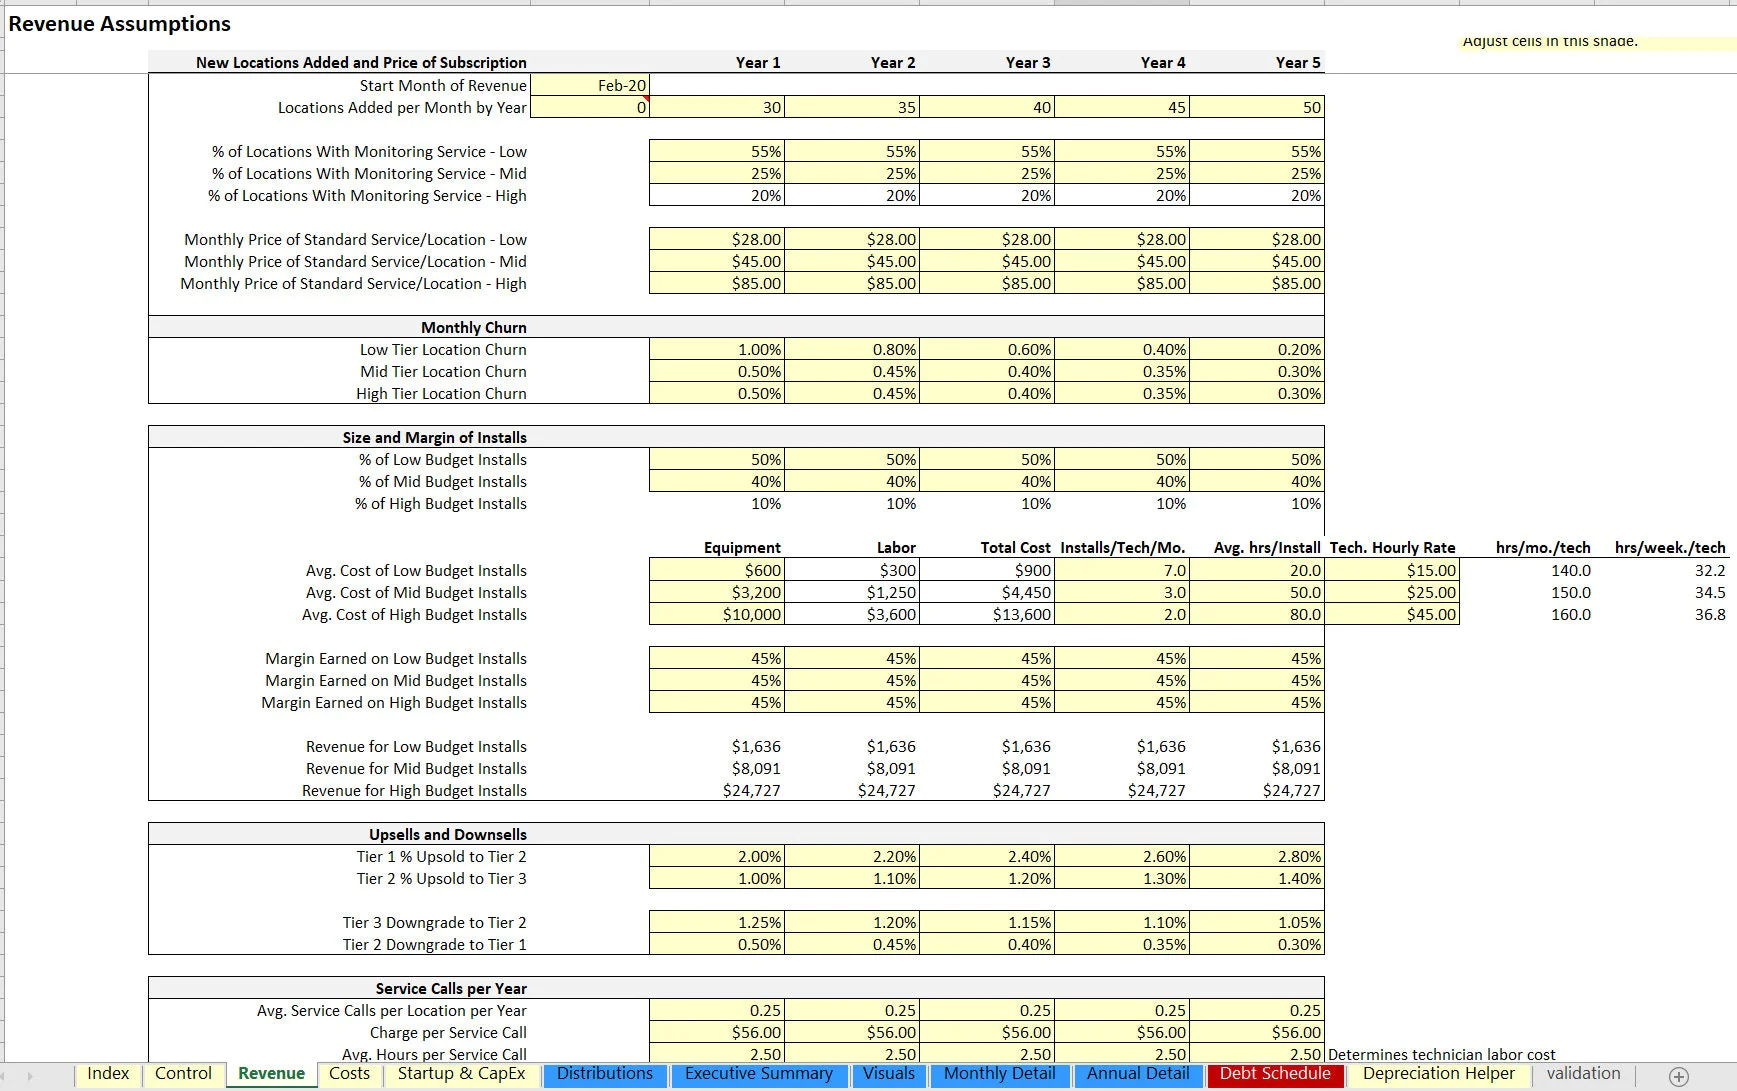
The main revenue and variable costs of this type of operation (and what the assumptions are driven based on) include:
• Installing equipment at some profit margin (company buys equipment from vendors and sells it to customers at some markup)
• Customer pays company a security monitoring fee per month so that the installed equipment monitors and does its job
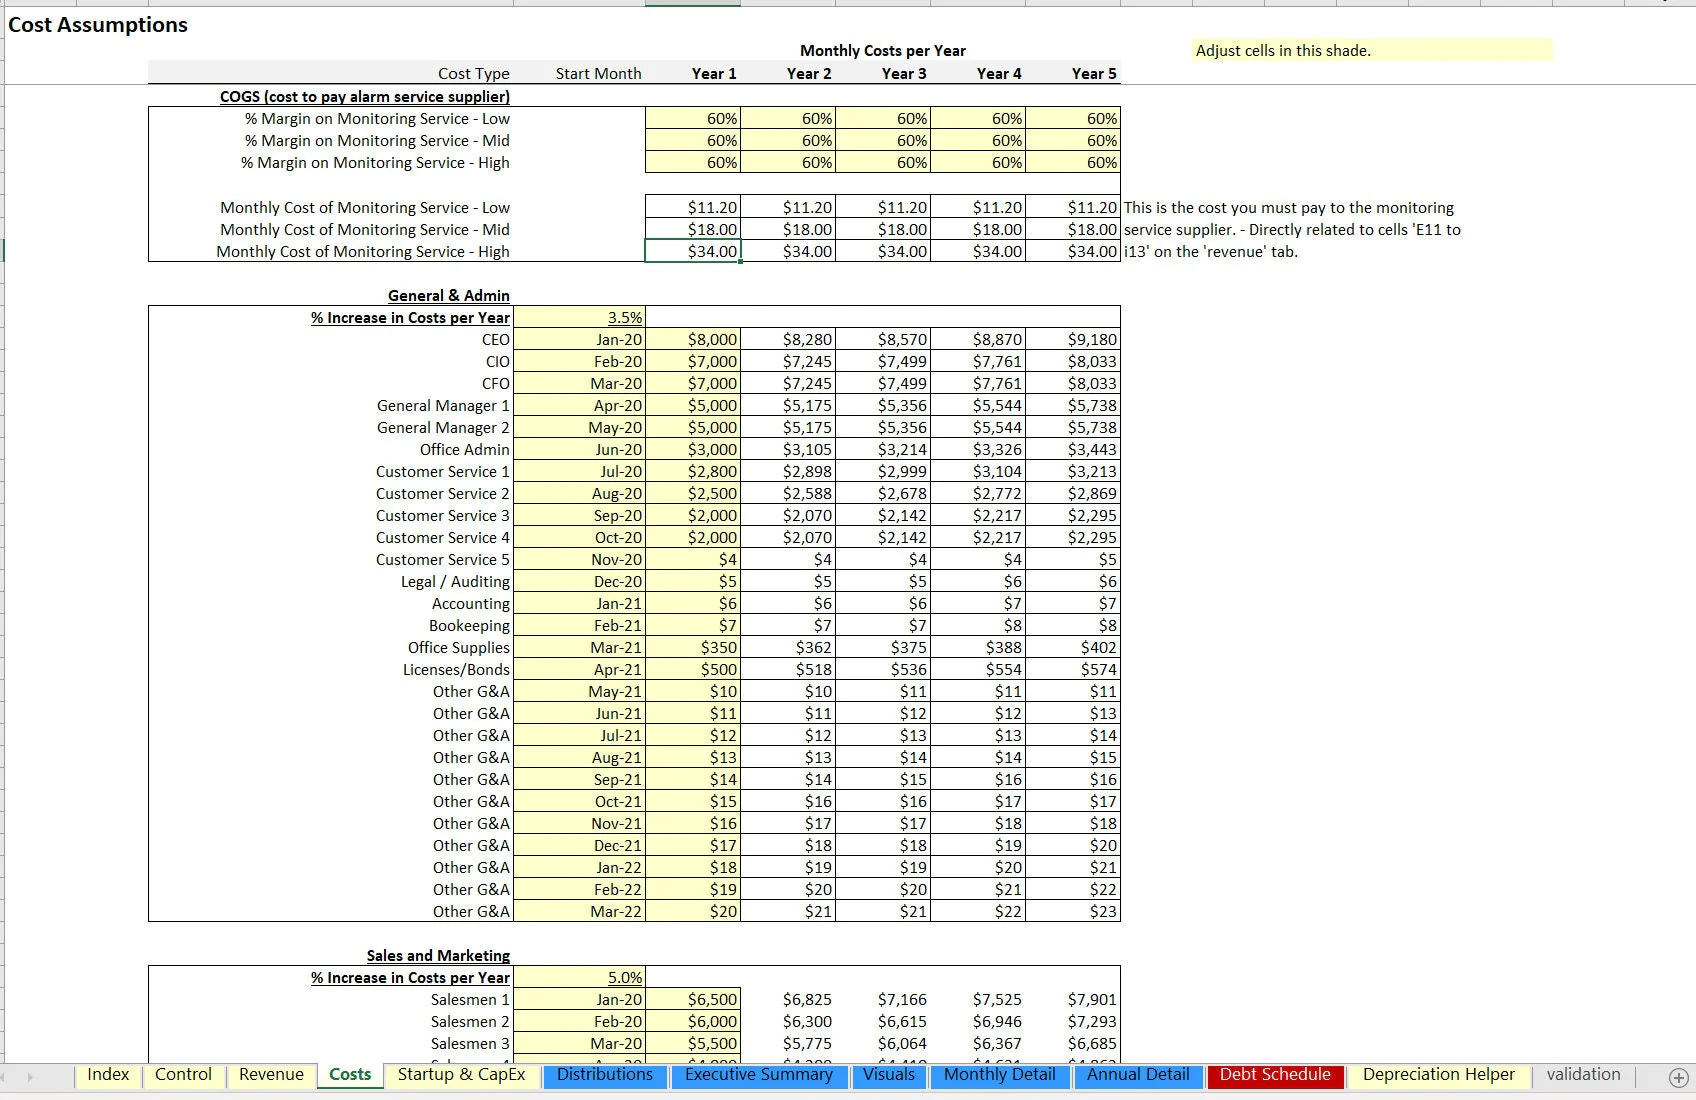
• Company pays a 3rd party vendor for the costs to supply the monitoring service (this is similar to a SaaS company paying a hosting provider)
• Customers can move between pricing tiers based on defined assumptions
The basis for how this model works around the above involves up to three pricing tiers and three types of locations. The number of locations added per month can vary in each year and the percentage of locations added that fall into each pricing tier is defined. The equipment costs / margins and monitoring costs are also configurable based on each tier.
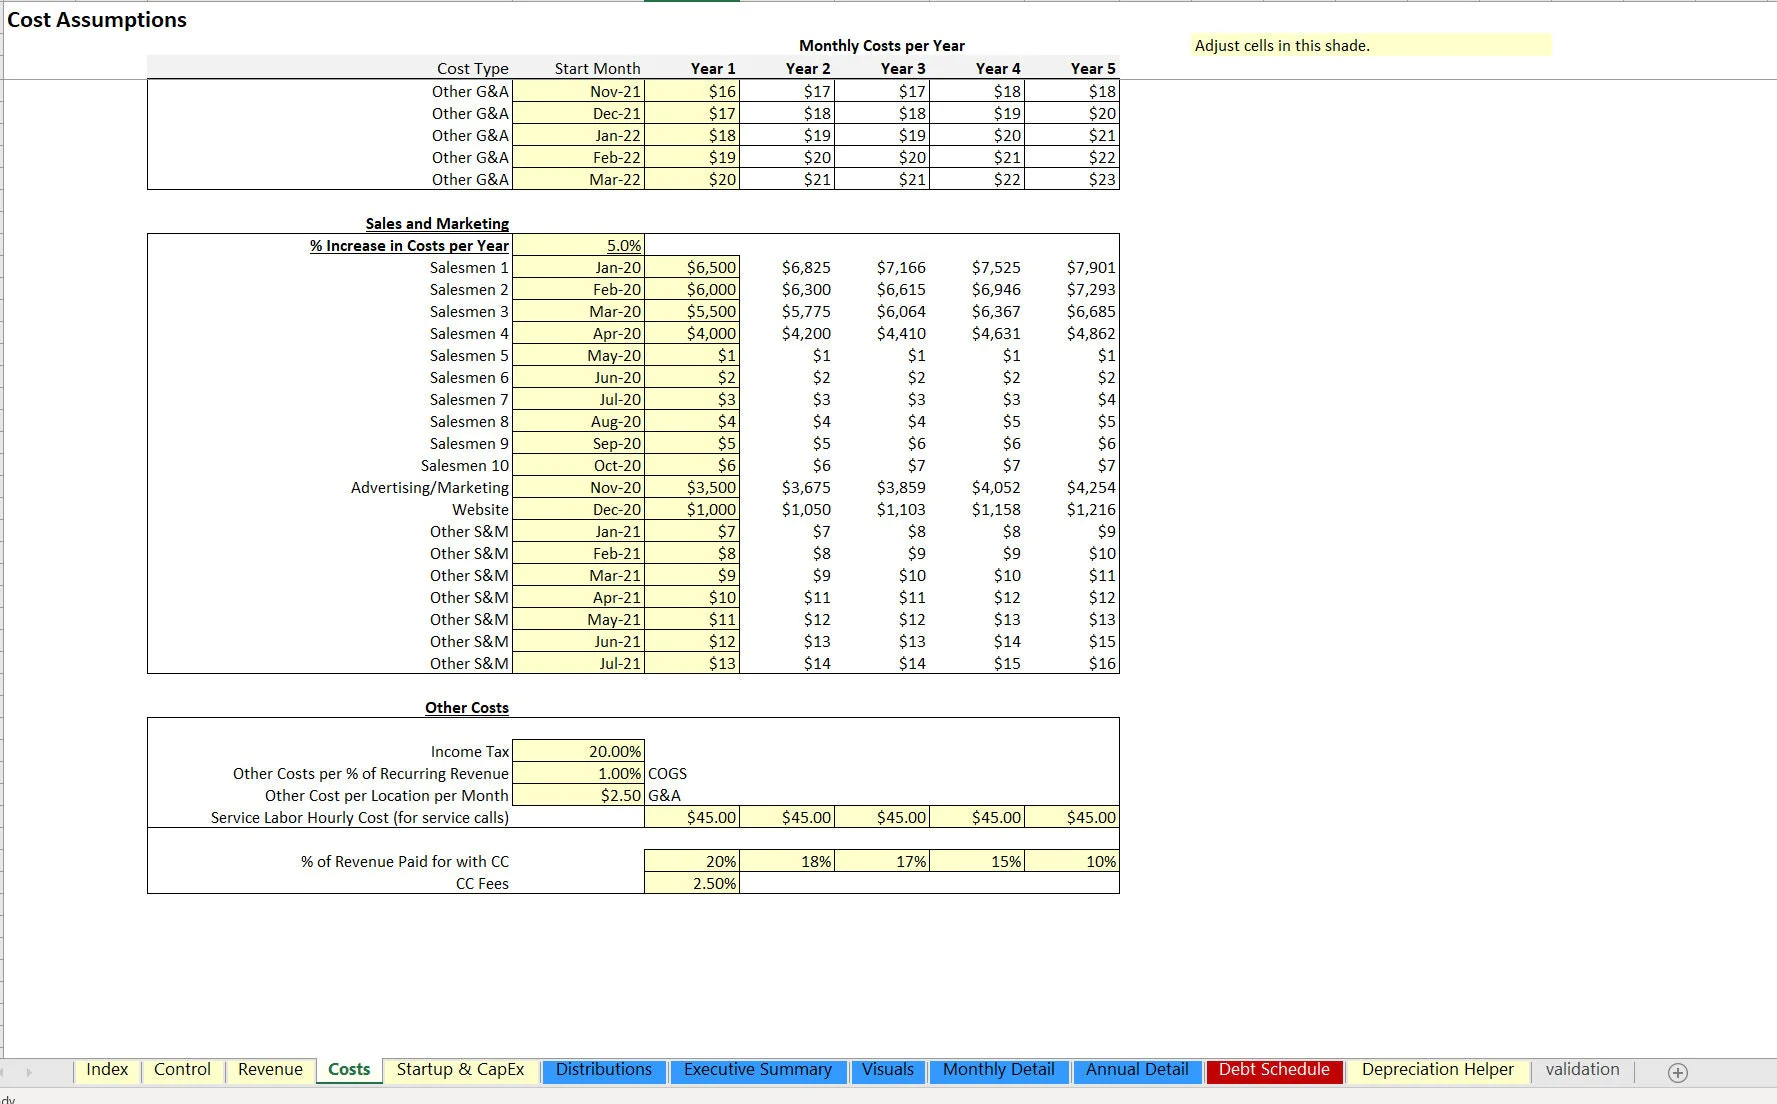
There is logic for fixed cost data entry and these costs grow at a defined annual rate. Each has their own start month configuration. There are other cost assumptions as a catch-all defined as a direct percentage of revenue as well as a corporate income tax rate.
Another aspect of security monitoring service companies is service labor. This is configurable based on the cost per hour and the amount charged to customers per the same period for service calls. Starting inventory can be configured for how much is prepaid for up front (this is to account for a few months before operations get rolling and allows the resulting effect on cash flow to be seen.
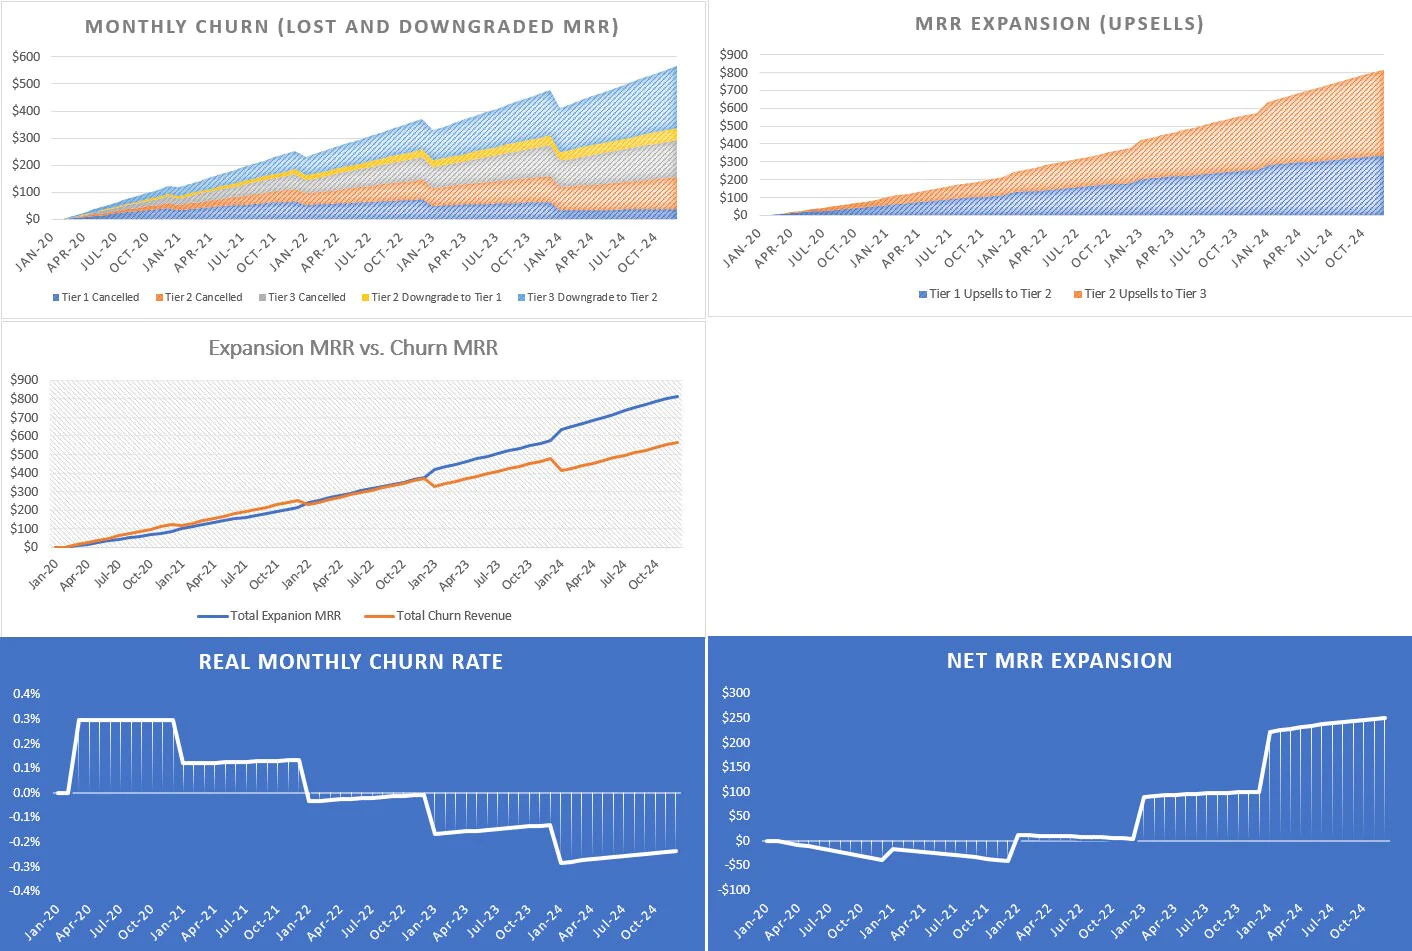
Because of the similarities this industry has to PaaS/SaaS, metrics like CaC, CaC payback, CLTV (customer lifetime value), and negative churn can all be tracked and measured. The idea of negative churn can be seen if the number of existing customers that upgrade results in a greater monthly recurring revenue amount compared to the amount of recurring revenue churned from lost customers and downgraded customers.
Final output results include:
• Monthly and Annual P&L Detail that shows every aspect of the assumptions on a continuous 5-year timeline.
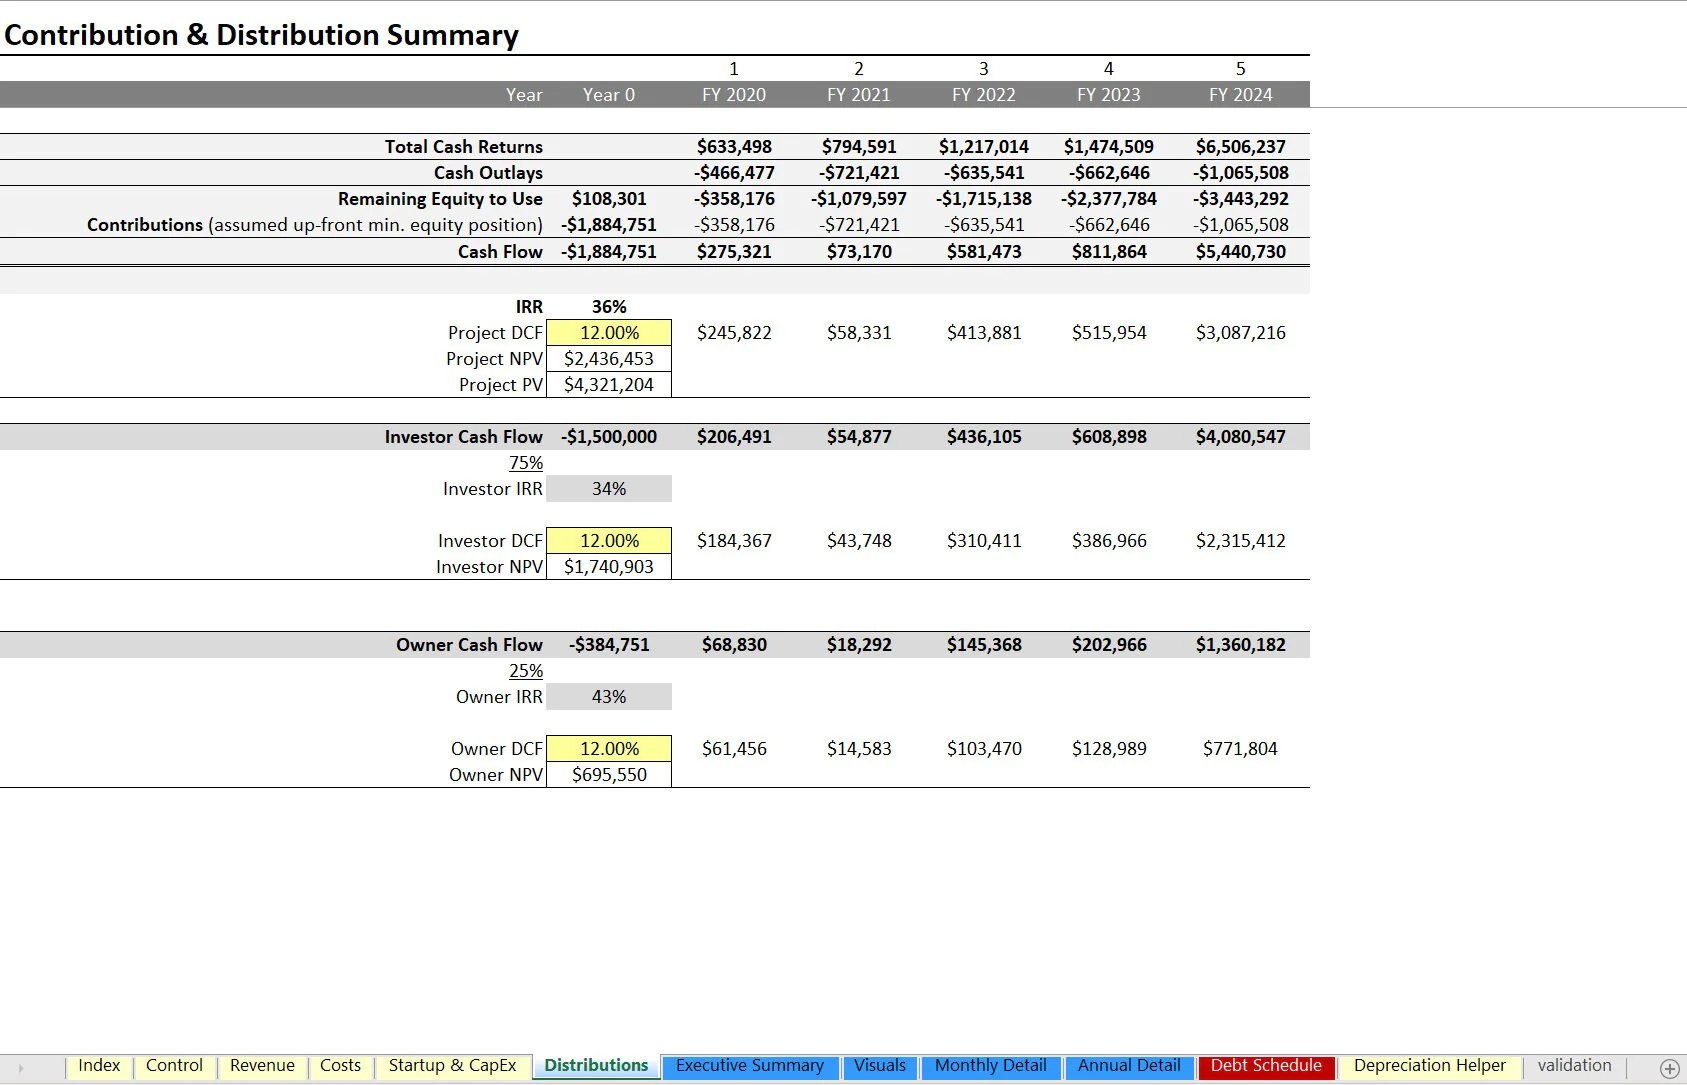
• DCF Analysis and contribution / distribution summary for the project as a whole and the investor pool (if applicable) and owner pool
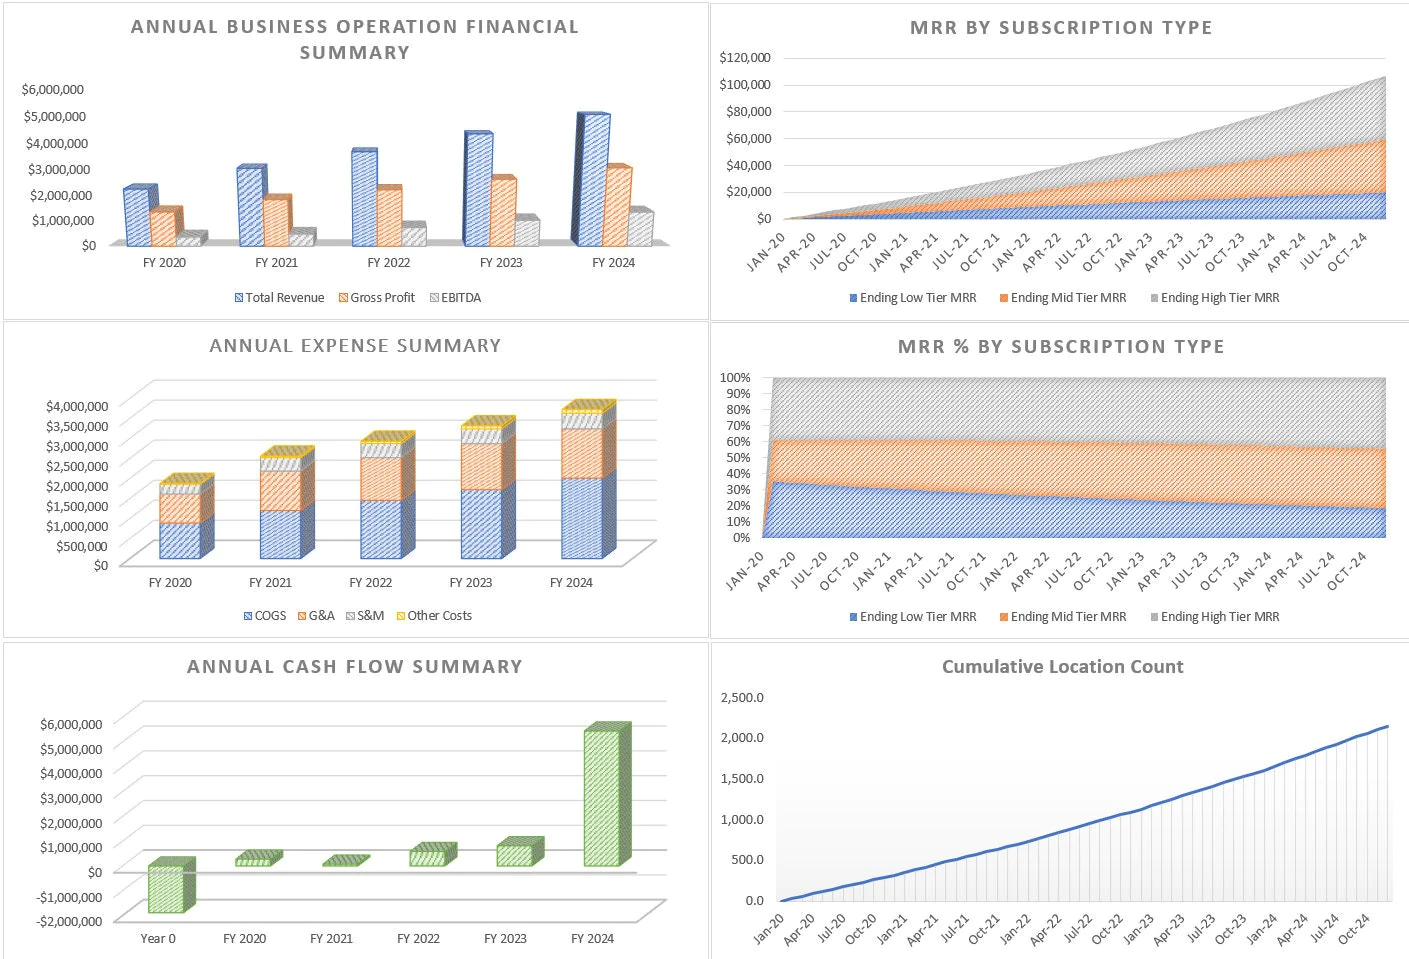
• Annual Executive Summary that displays high level financial line items and cash flow as well as IRR, ROI, equity multiple and a visual
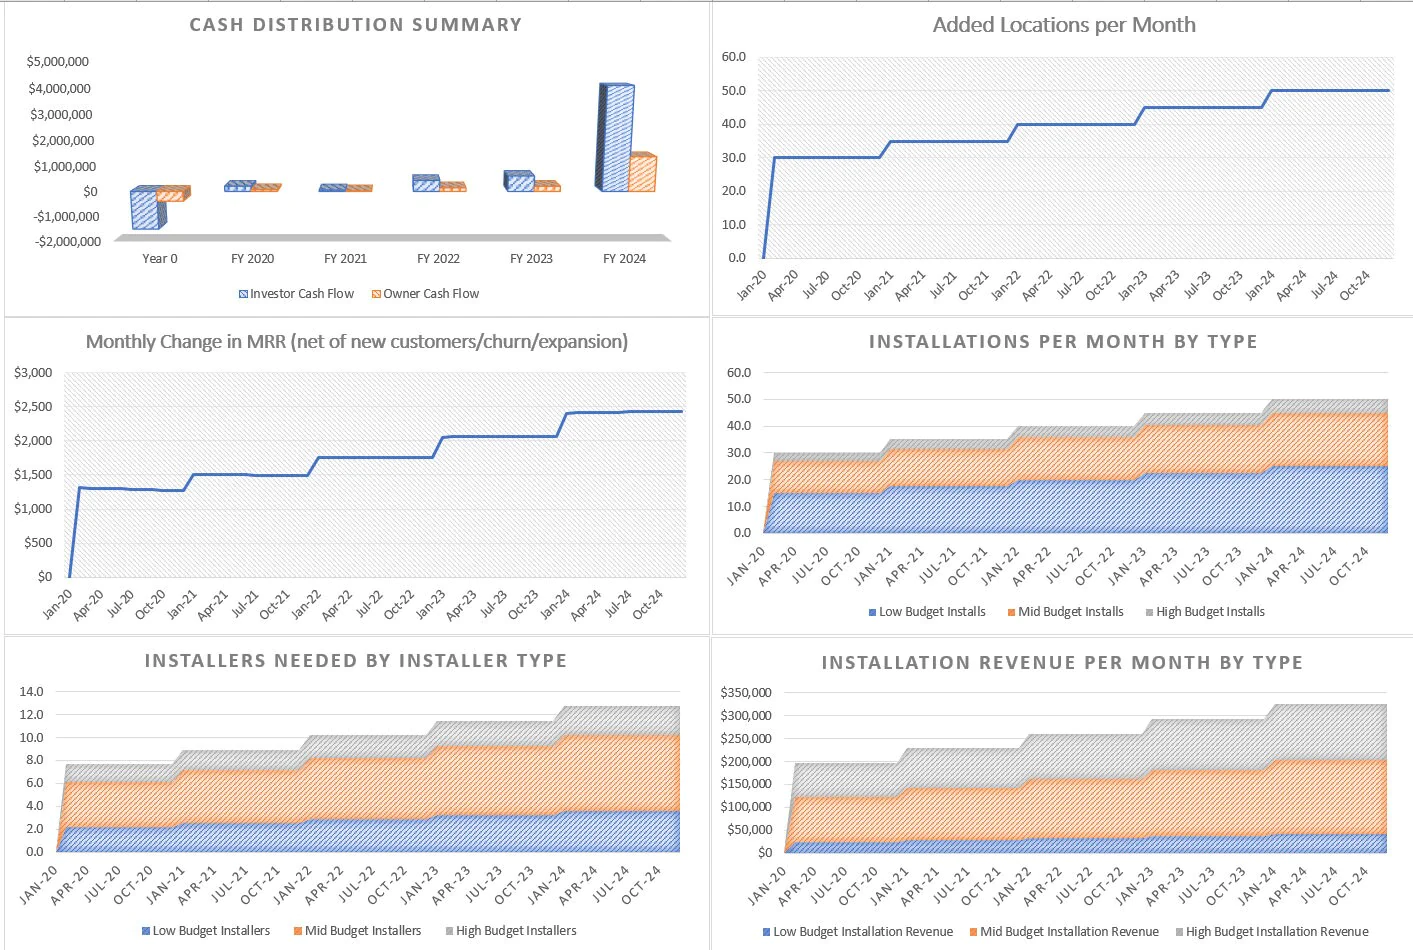
• 21 visualizations that focus on financial forecasting as well as KPI (key performance metrics)
• Monthly and annual financial statements
There is the option for terminal value based on a multiple of annualized revenue in the exit month. Upon exit, all revenue and expenses stop and any debt balance reduces from the terminal value.
One of the key outputs of the model is the minimum equity required and that is based on the aggregation of all assumptions and the timing therein. This means startup costs and any burn that may happen until there is regular positive operating income.
Got a question about the product? Email us at support@flevy.com or ask the author directly by using the "Ask the Author a Question" form. If you cannot view the preview above this document description, go here to view the large preview instead.
Source: Best Practices in Integrated Financial Model Excel: Security Monitoring Business Financial Model Excel (XLSX) Spreadsheet, Jason Varner | SmartHelping
ABOUT THE AUTHOR
I graduated in 2011 with a Bachelor's degree in Accounting and began my career as a financial analyst at a small chain of auto repair shops. After gaining valuable experience, I launched my own practice specializing in real estate underwriting, later expanding into general business modeling.
I honed my spreadsheet modeling expertise by completing over 400 projects on Upwork with a 100% success
... [read more]
Ask the Author a Question
You must be logged in to contact the author.
