

2-Sided Listing Marketplace Financial Model – Excel XLSX
Excel (XLSX)
VIDEO DEMO
MARKETPLACE EXCEL DESCRIPTION
Recently updated with a fully integrated 3-statement model and improved global assumption layout.
This is a general unit economics-based 5-year financial model that is designed to be a broad set of logical assumptions to derive potential revenues and expenses of the startup and operations / exit of a network or marketplace. Think eBay.
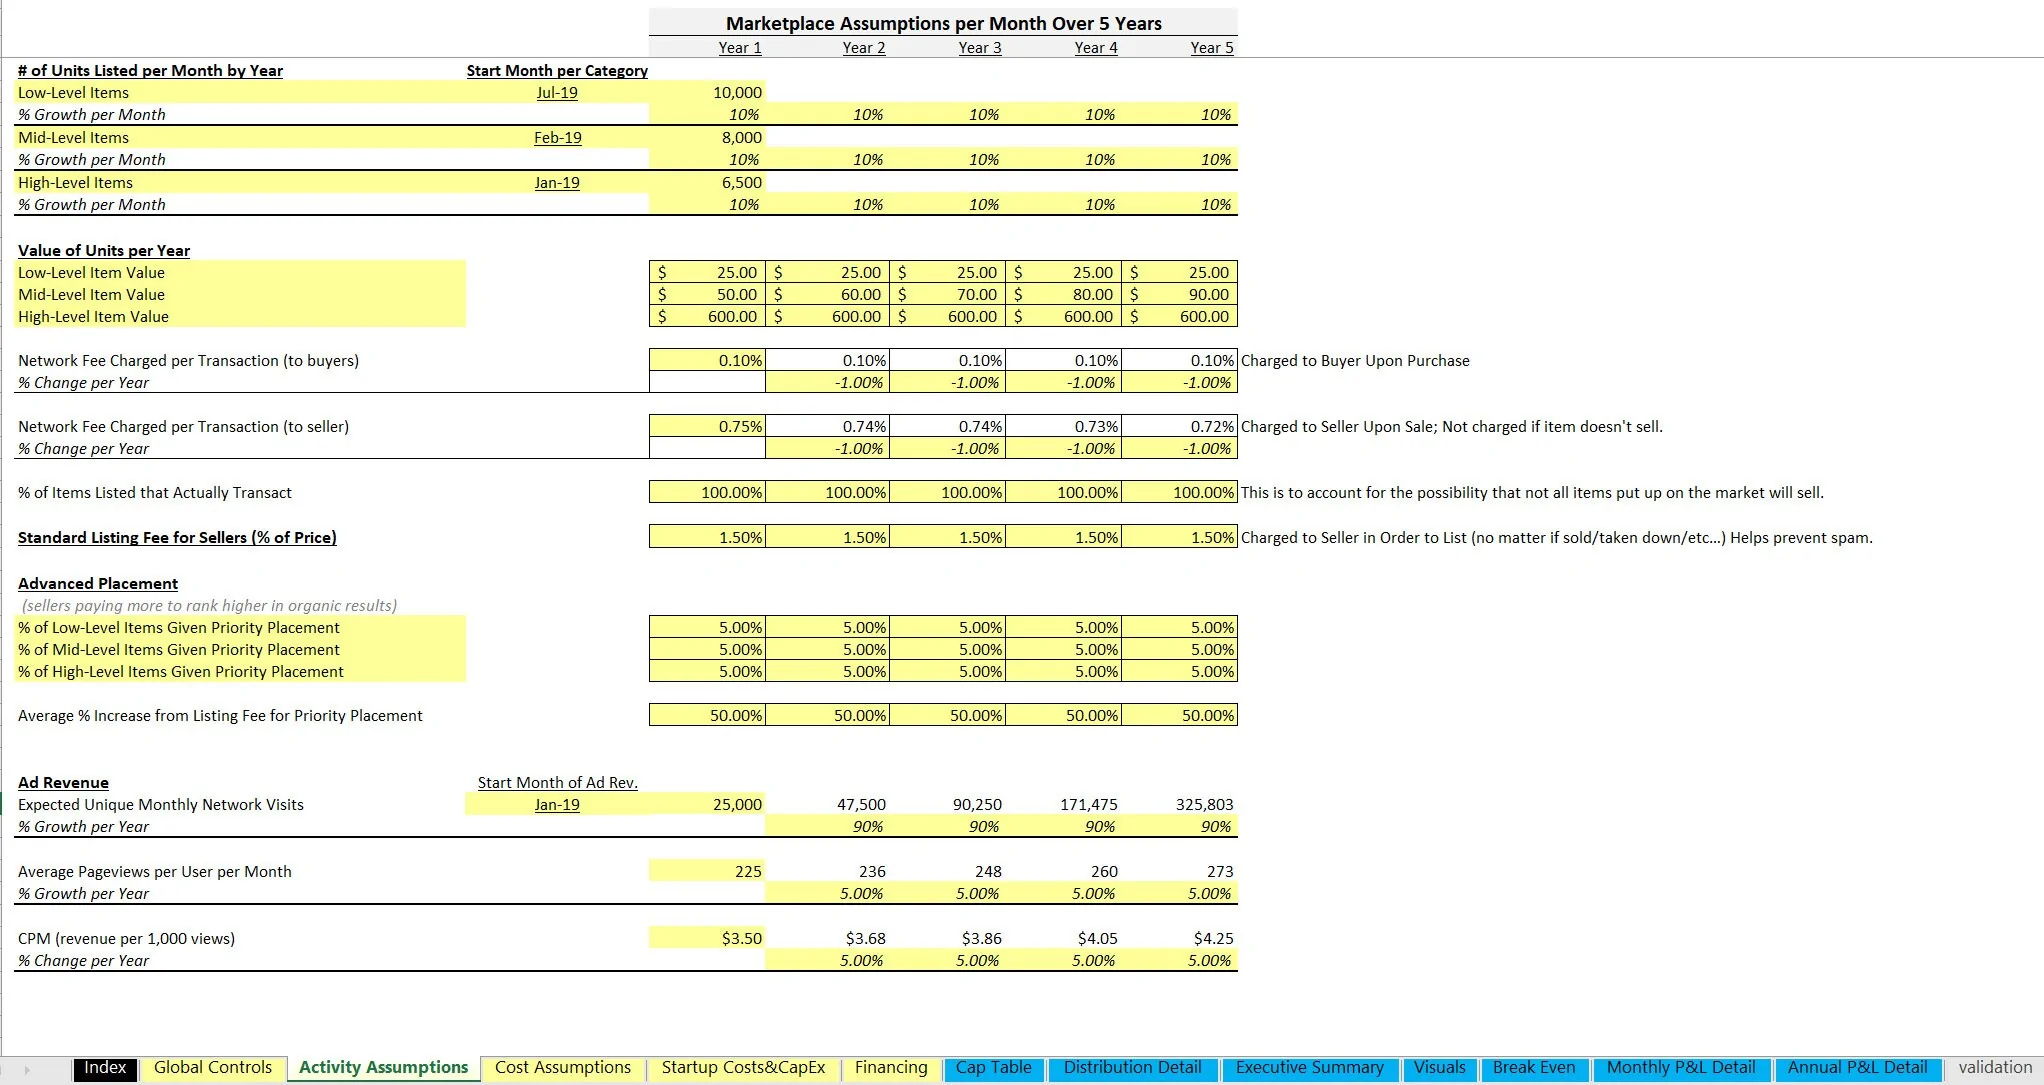
At the simplest level, the model lets the user define a few key assumptions regarding three types of transactions, of which the network platform will take fees from. The following can be defined for each type of transaction:
• Start month of activity
• Starting transactions in start month
• Monthly percentage increase in transactions (configurable over 5 years)
• Average value per transaction
To earn revenue, the network platform can configure a few different fees that are based on transaction volumes.
These feeds include:
• Network fee charged to buyer per transaction (percentage of listing amount)
• Network fee charged per transaction to seller (percentage of listing amount)
• Percentage of items listed that successfully transact
• Listing fee (percentage of total price / value of item being listed)
There are some arbitrary slots to account for other revenue streams such as advanced placement of items. This is done by defining a percentage for each of the three transaction categories that drives the number of listed items that are advanced placements. It is configurable over each of the 5 years per transaction type.
Additionally, another revenue stream that can be configured is ad revenue. This would be for a network that places ads on the platform and earns some ad revenue therein. This is driven by the number of unique monthly visitors, the average pageviews per user per month, and the average revenue per 1,000 views.
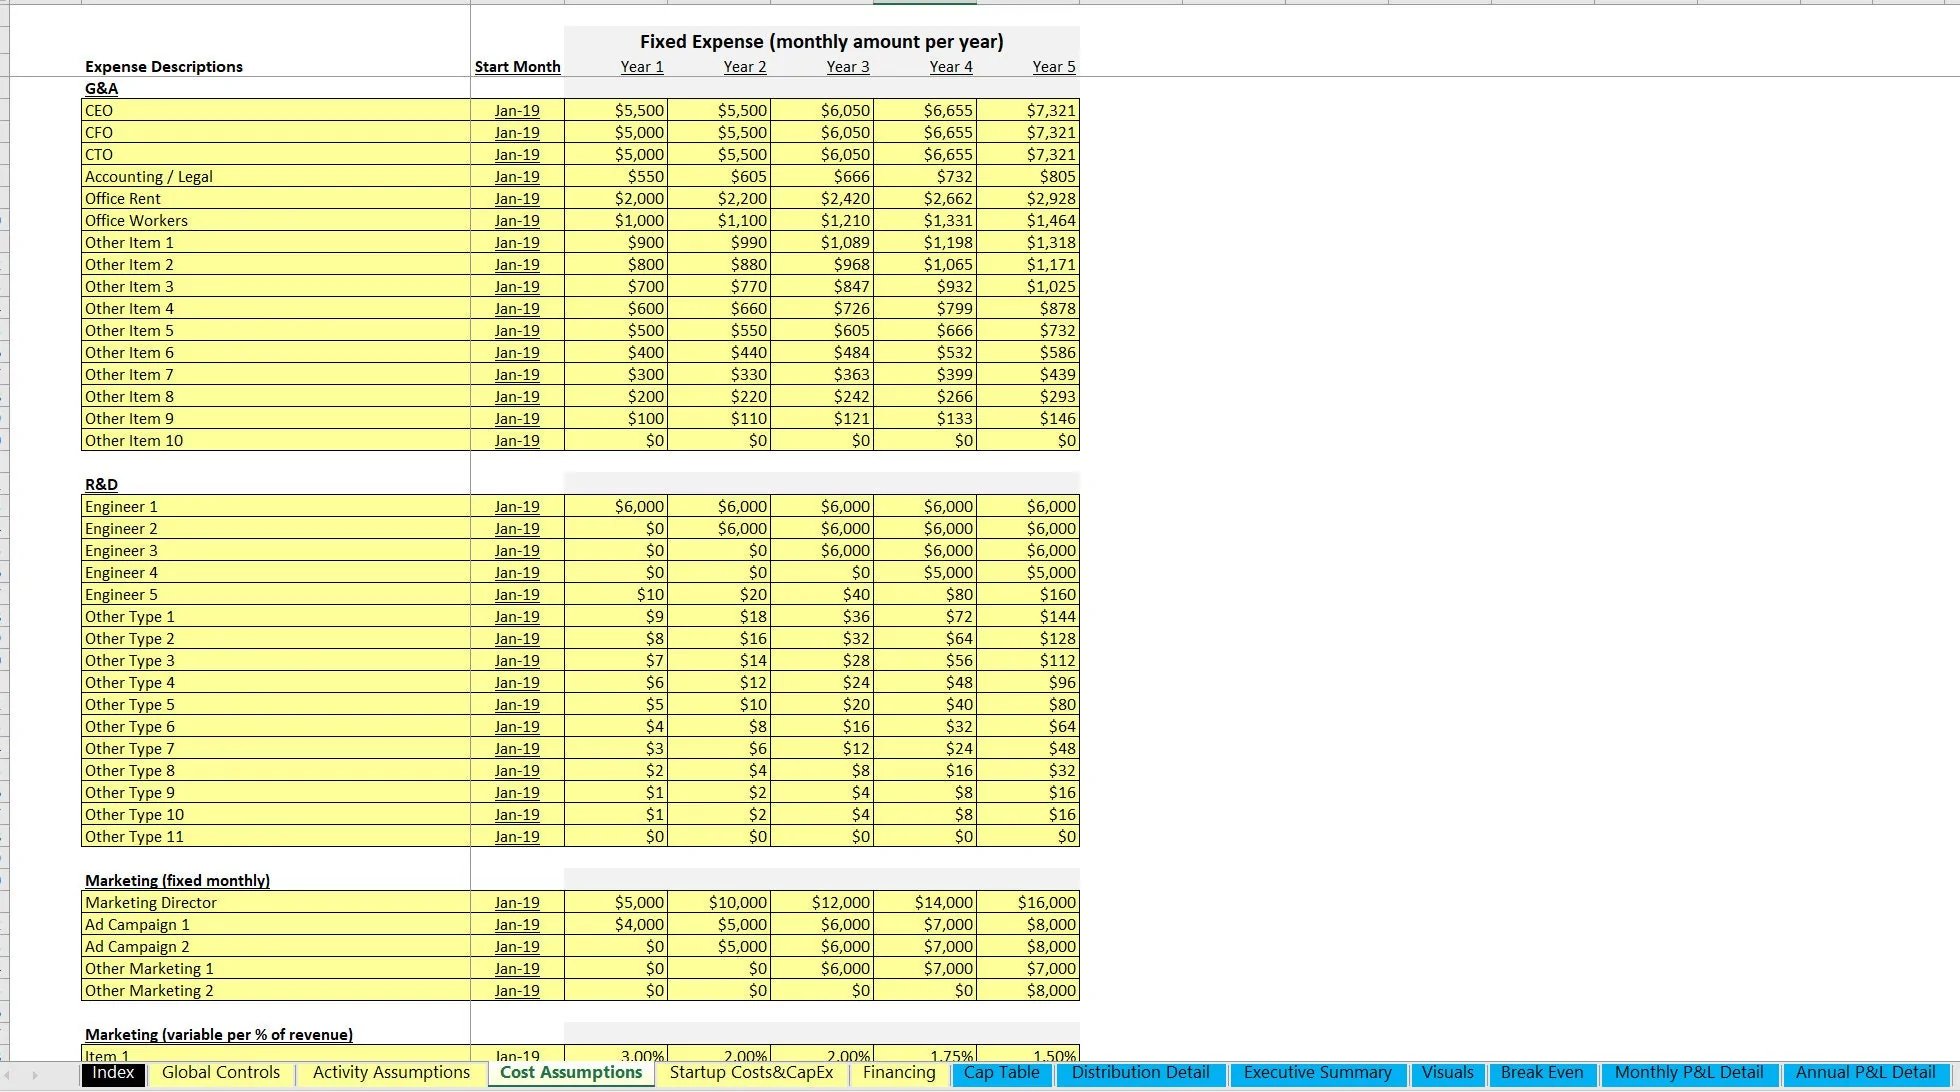
Cost of goods sold can be defined in up to 5 slots and in two different modules. The first lets the user define a start month for the expense, a monthly amount of the expense, and that can be changed in each year per slot.
Also, there is a module for COGS as a direct percentage of revenue. There are also two other modules for fixed and variable marketing costs. Operating expenses are defined based on up to 27 slots between G&A and R&D. Each slot lets the user define the cost item description, start month, and fixed monthly cost (adjustable per year). There is also configurations for initial one-time startup costs and capex as well as any startup funding paid via a traditional debt.
As far as a cap table, this model lets the user define up to six investment funding rounds. In each round the following can be defined:
• Month funding received
• Investment amount
• Valuation at funding (and the resulting percentage ownership therein)
The remaining equity requirement (if there is any requirement left) falls to the owners. Also, any remaining profit shares after all investment rounds are entered will flow to the owners.
Each investment round will have its own DCF Analysis, IRR, total cash returned, and ROI.
More reports include:
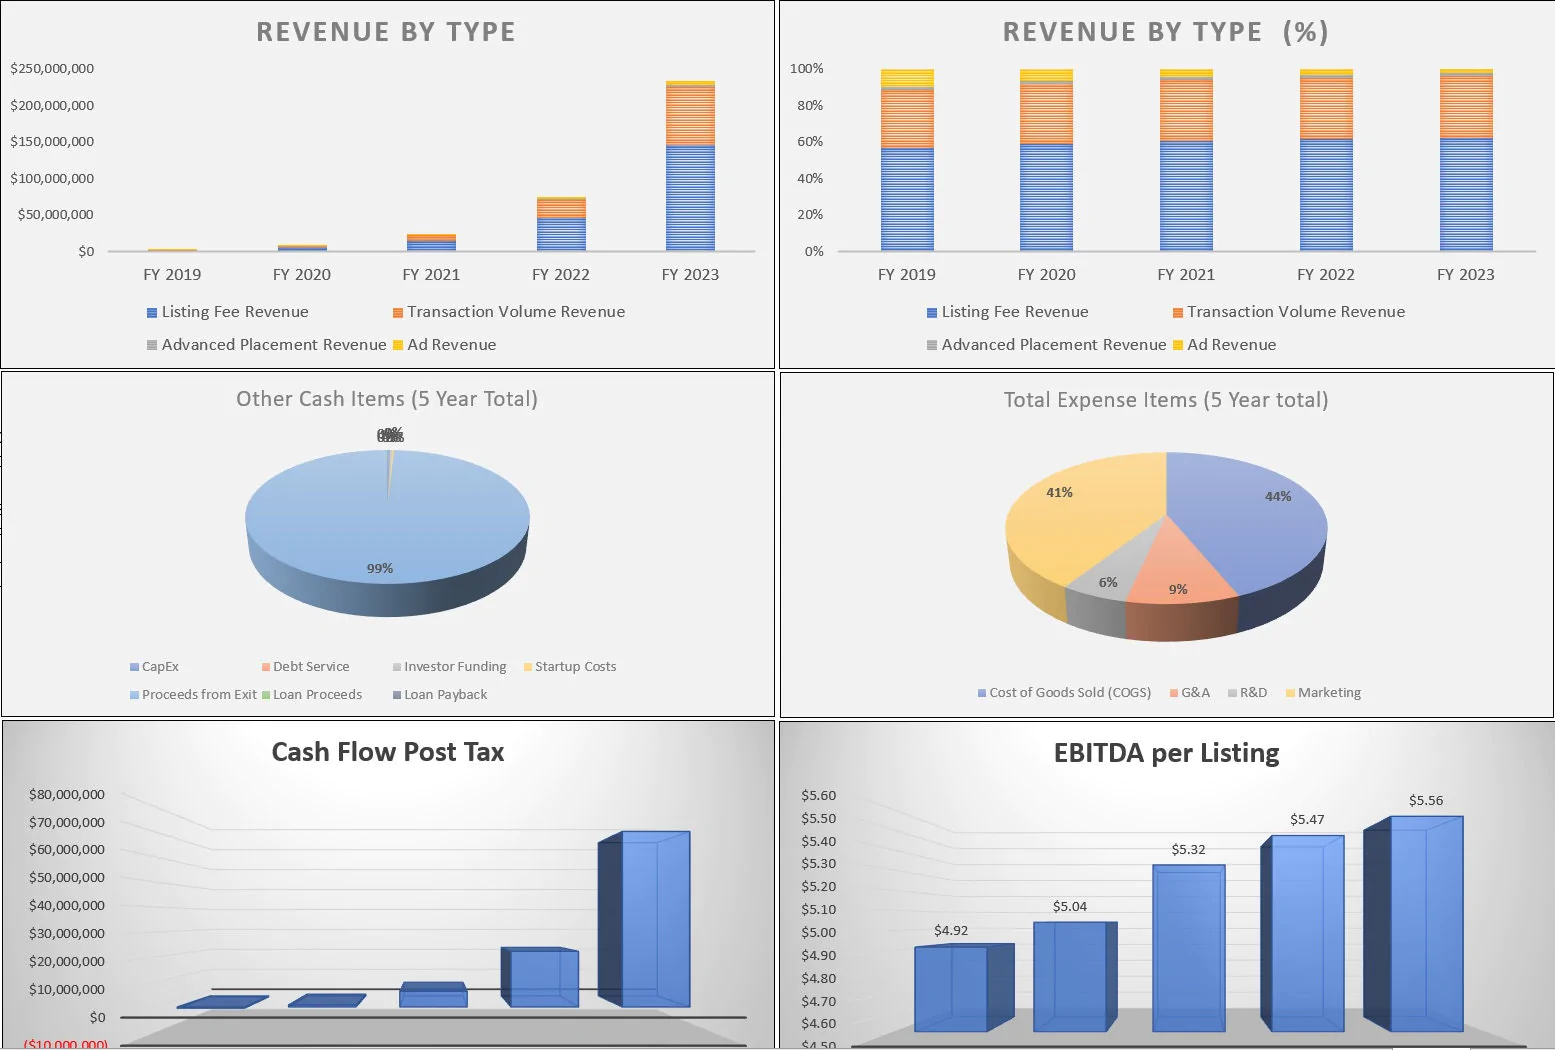
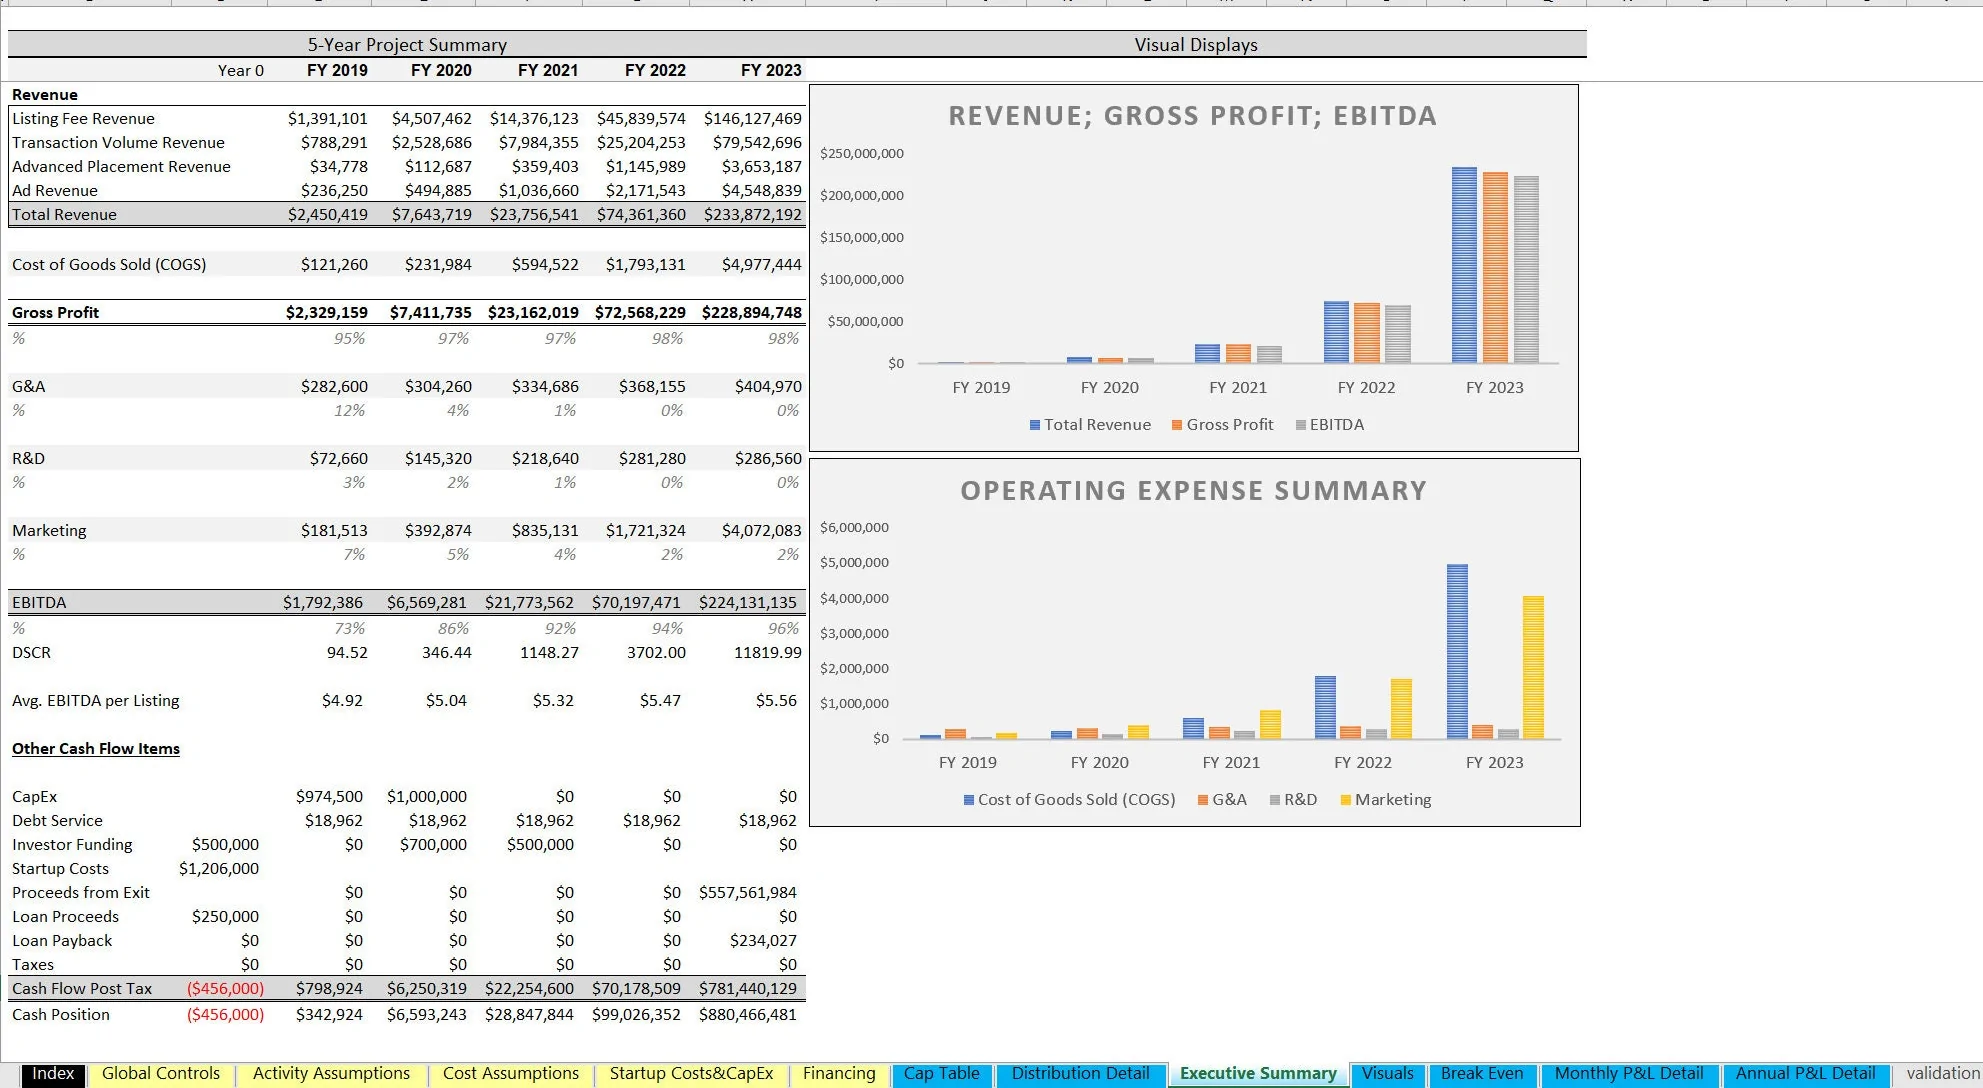
• Annual executive summary (revenue items, COGS, OpEx, EBITDA, Cash Flow, and visuals)
• Break even analysis (per year based on fixed / variable expenses)
• Monthly and annual pro forma detail (shows how all revenue and expenses are generated / network stats / volumes by transaction category / more.
• Over 11 unique visualizations Instructional video included in the file.
Got a question about the product? Email us at support@flevy.com or ask the author directly by using the "Ask the Author a Question" form. If you cannot view the preview above this document description, go here to view the large preview instead.
Source: Best Practices in Marketplace, Integrated Financial Model Excel: 2-Sided Listing Marketplace Financial Model Excel (XLSX) Spreadsheet, Jason Varner | SmartHelping
ABOUT THE AUTHOR
I graduated in 2011 with a Bachelor's degree in Accounting and began my career as a financial analyst at a small chain of auto repair shops. After gaining valuable experience, I launched my own practice specializing in real estate underwriting, later expanding into general business modeling.
I honed my spreadsheet modeling expertise by completing over 400 projects on Upwork with a 100% success
... [read more]
Ask the Author a Question
You must be logged in to contact the author.
