
SaaS Customer Pricing Simulator: Optimization Template – Excel XLSX
Excel (XLSX)
VIDEO DEMO
SAAS EXCEL DESCRIPTION
Any SaaS operator will be asking their finance team, revenue director, or CFO what to price the product at. There is a lot of nuance and a lot of factors that go into informing a subscription price. This model will help.
This is a general use SaaS analysis tool that has enough configurable inputs to fit regular month-to-month SaaS business or enterprise SaaS organizations. This can handle any term lengths for customers as well.
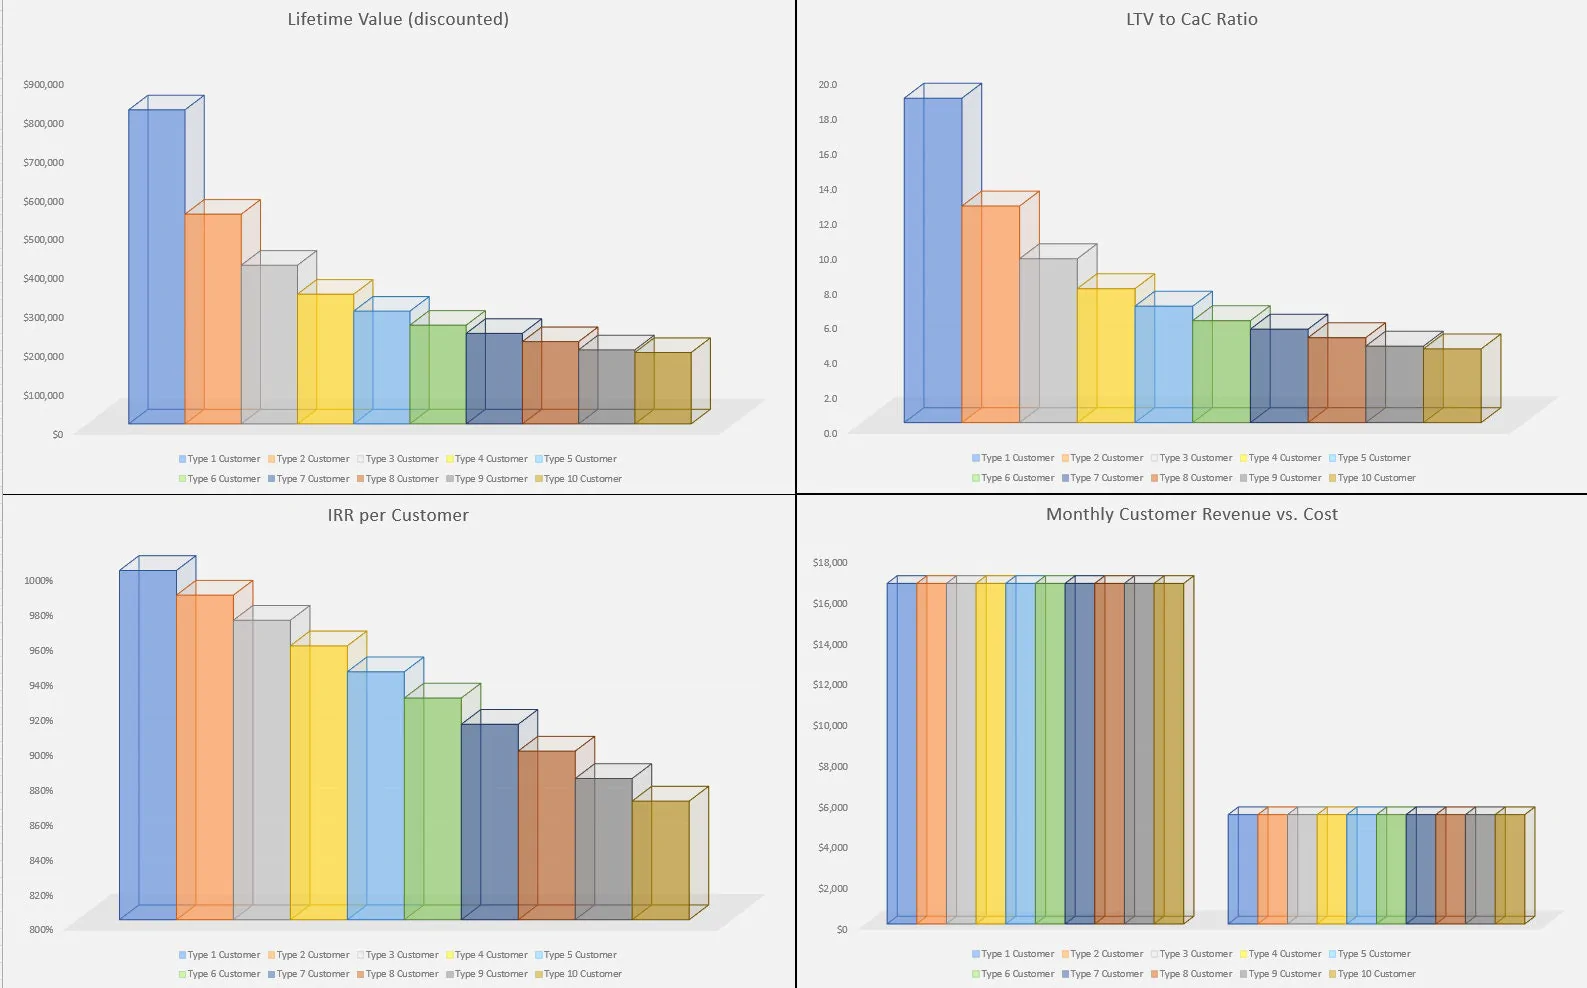
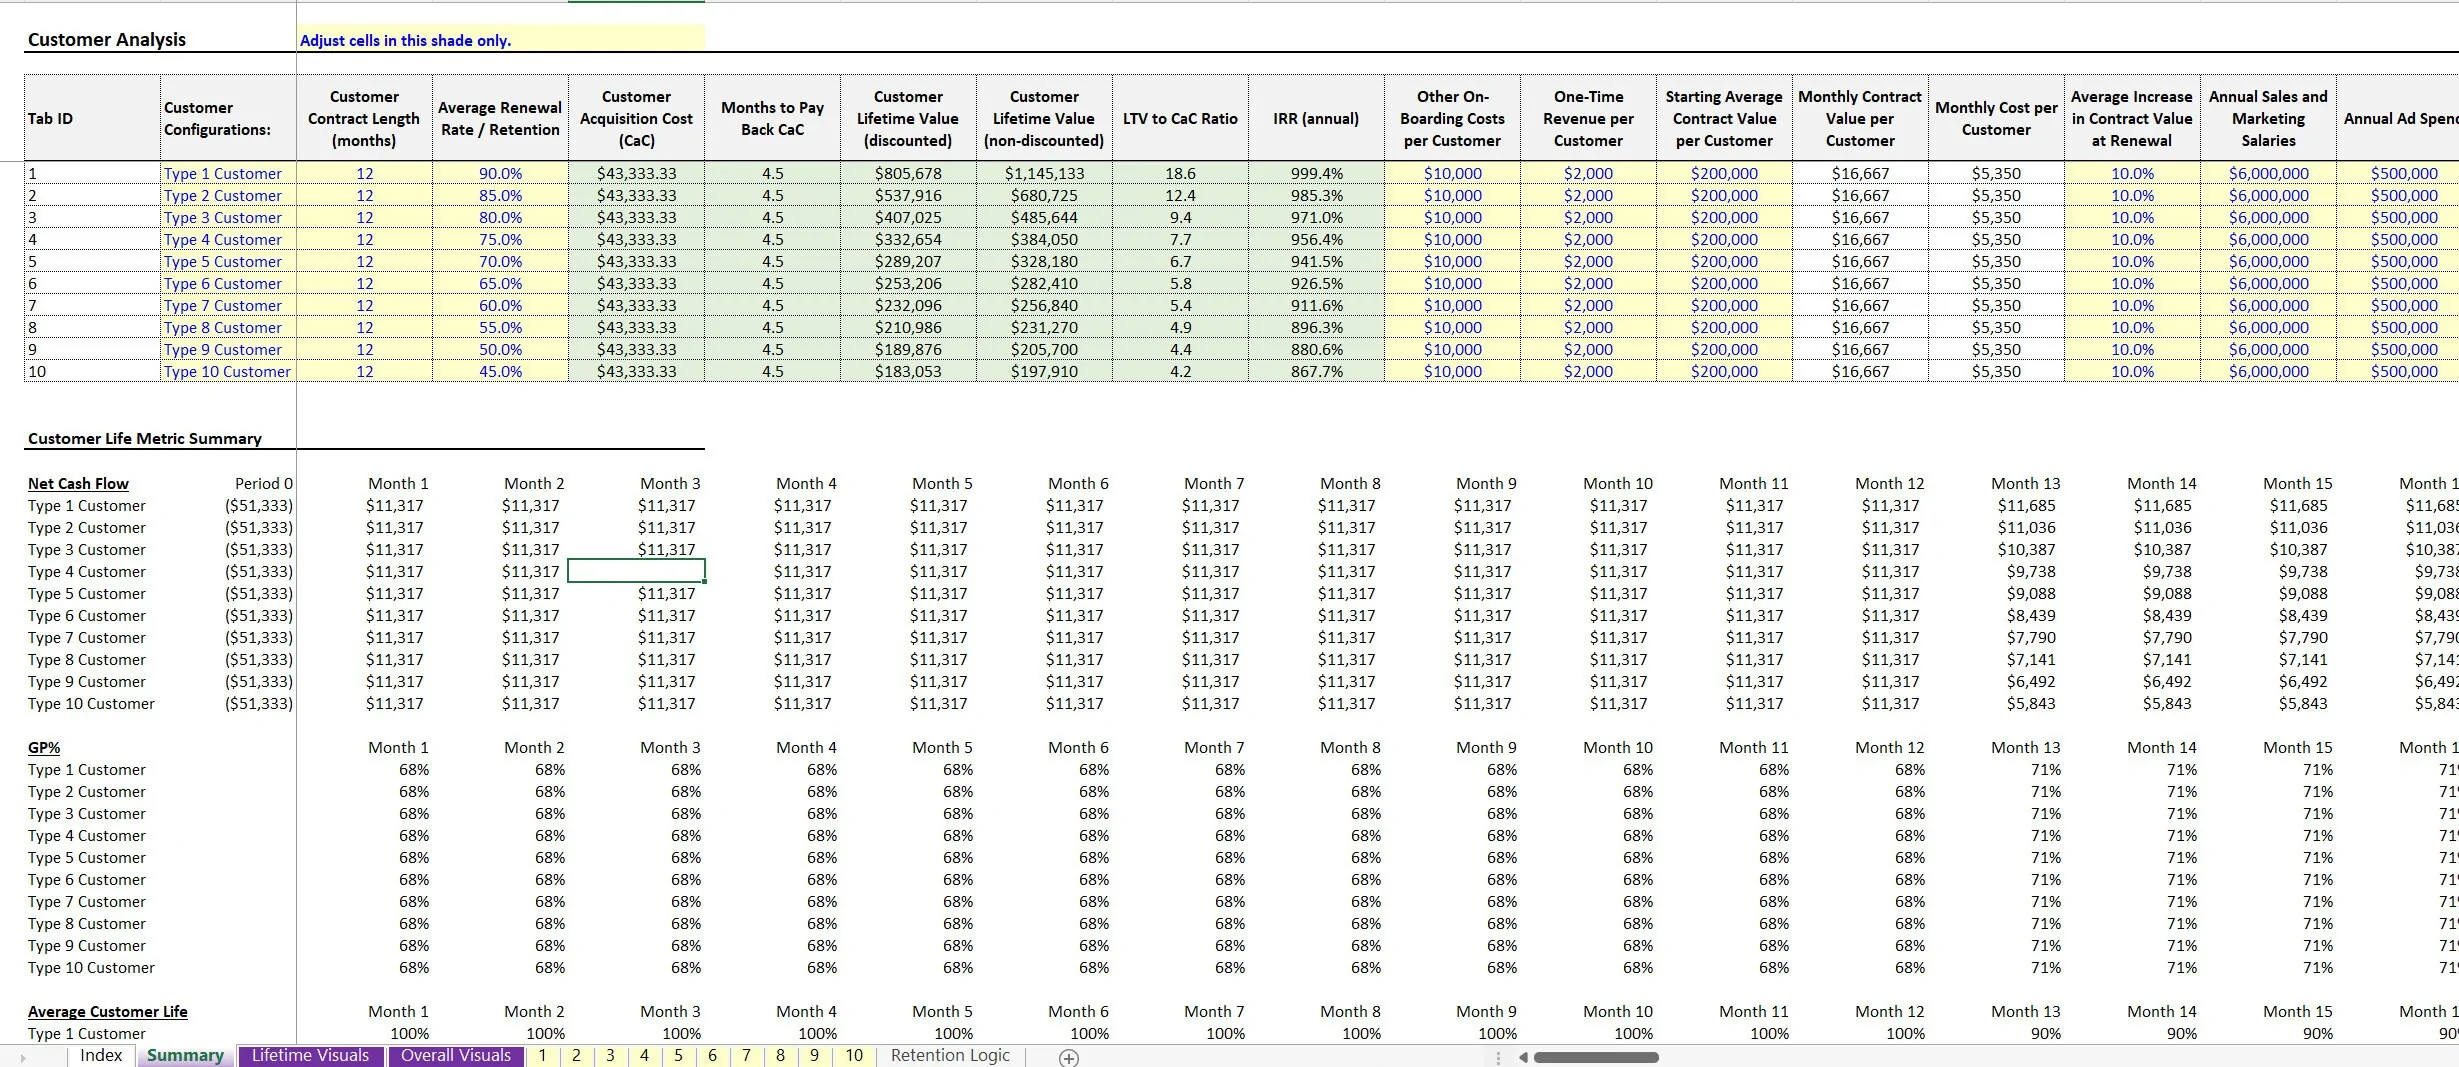
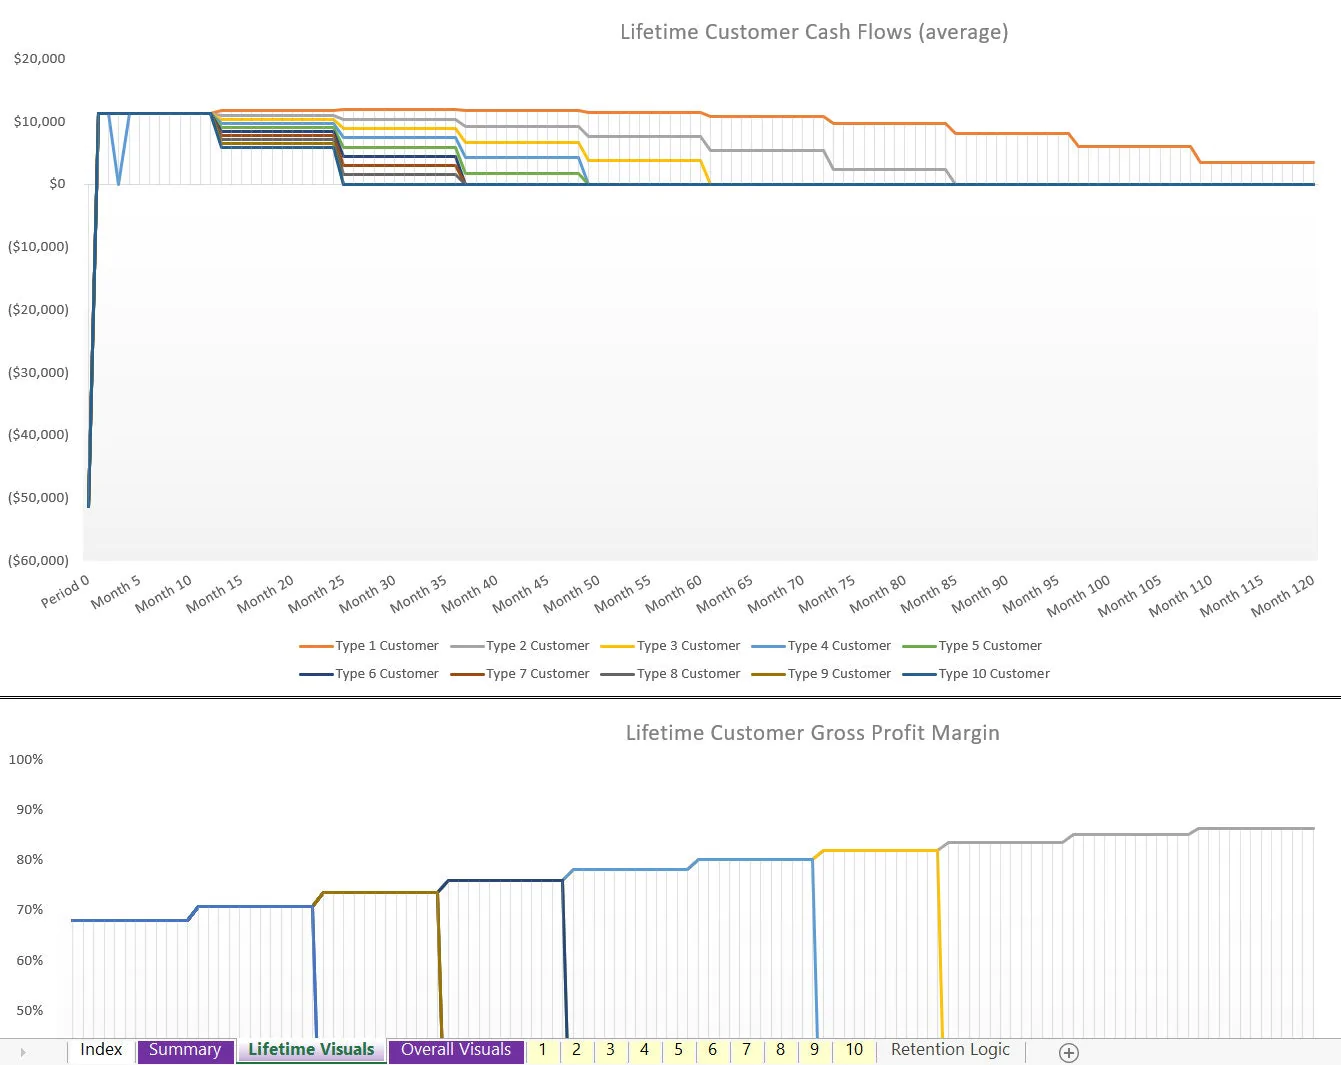
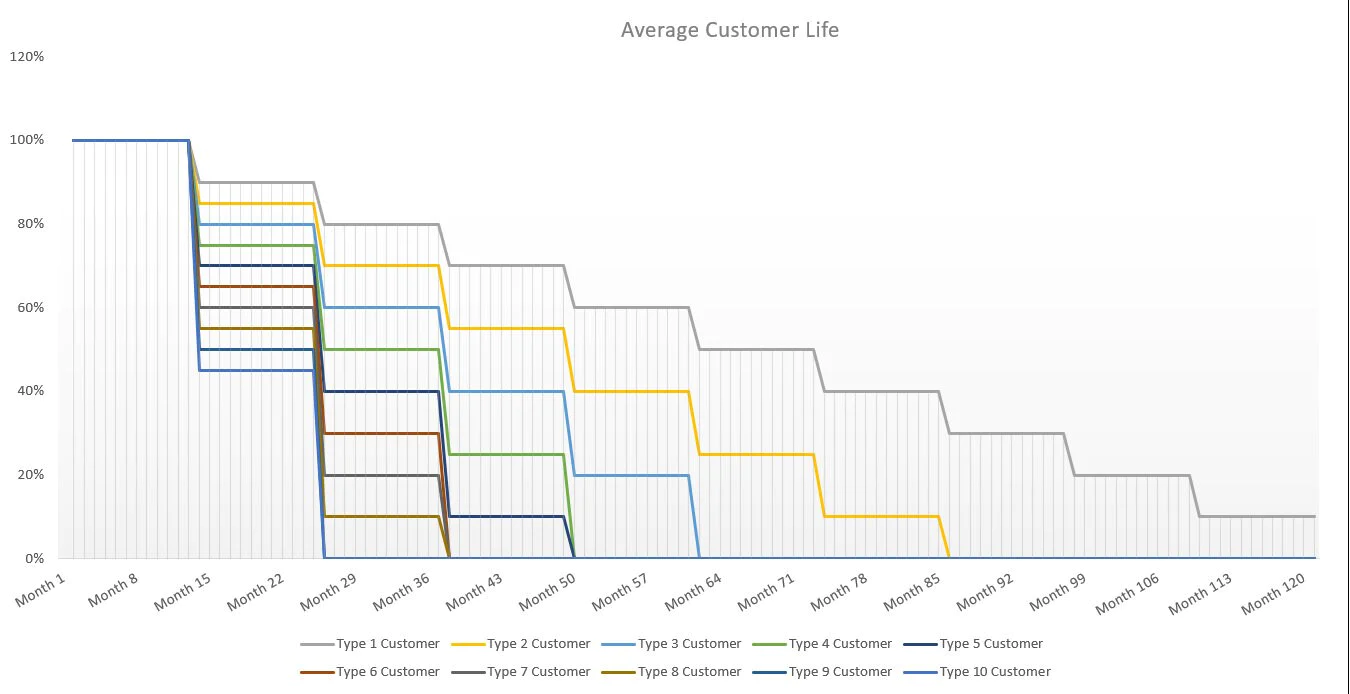
It is very good at showing gross profit per customer over time as well as total customer lifetime cash flows. The purpose is to configure up to 10 ideal customers based on inputs like Contract value, contract retention, average value per contract, contract length (months), customer acquisition cost, improvement on contract value at renewal, on-going service costs, one time setup fees and costs in order to show valuable metrics about an ideal customer.
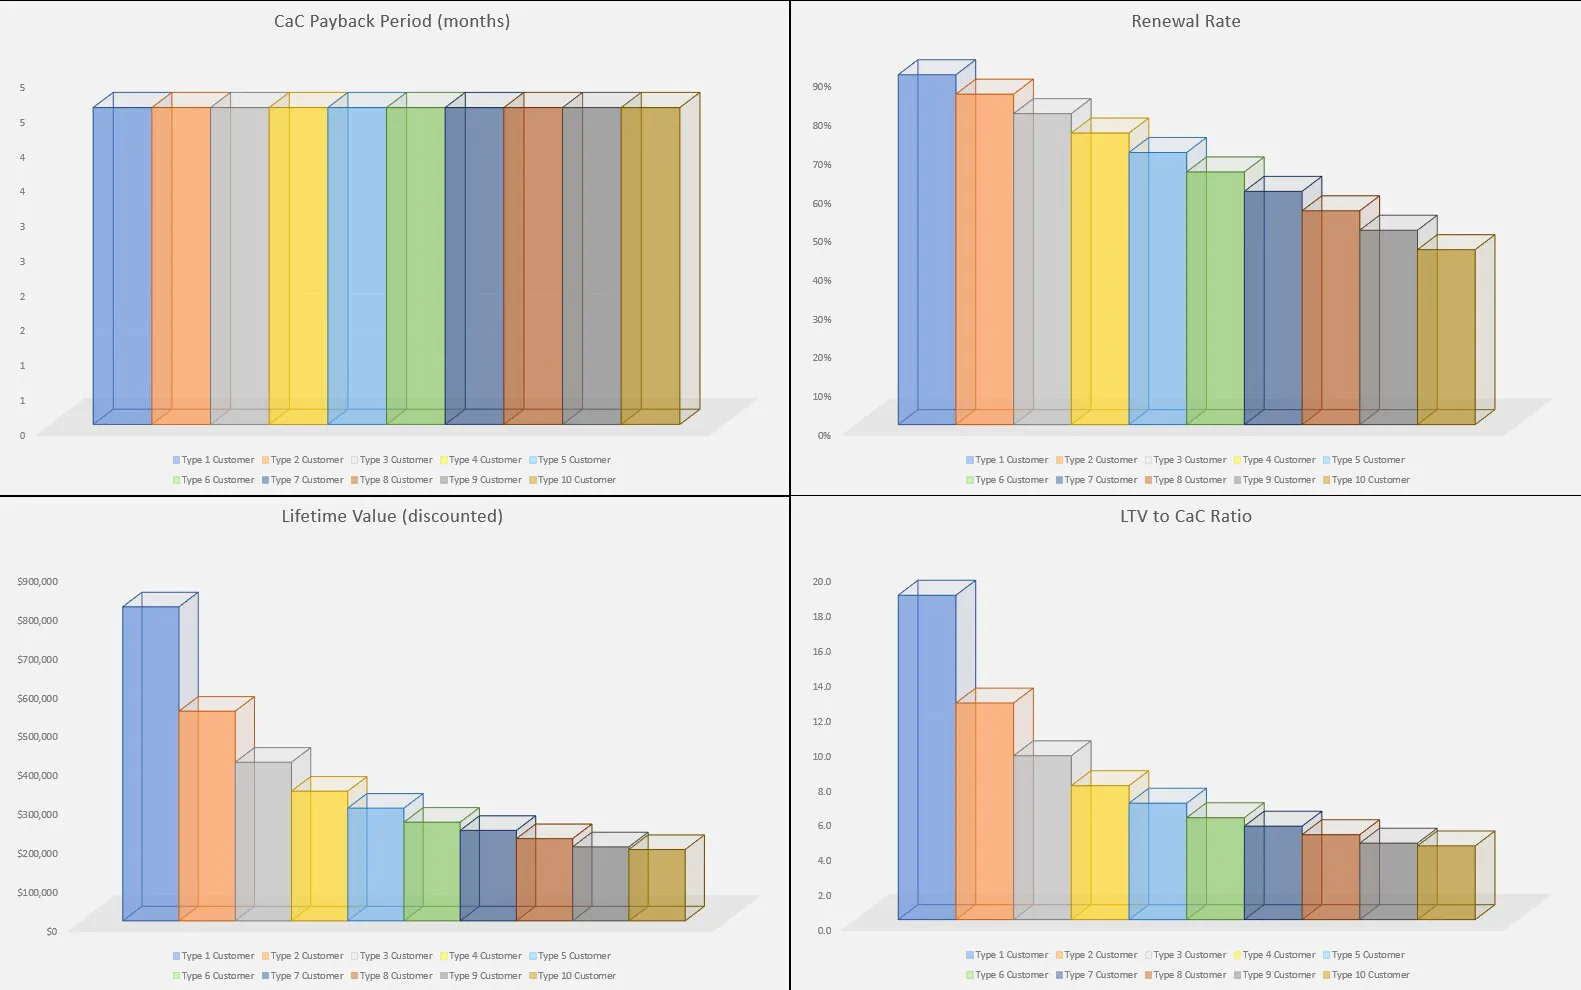
This tool is great for sensitivity analysis as well if you want to isolate one of the above variables and keep all the rest the same and see what that does to customer lifetime value, CaC payback, LTV to CaC ratio, and IRR.
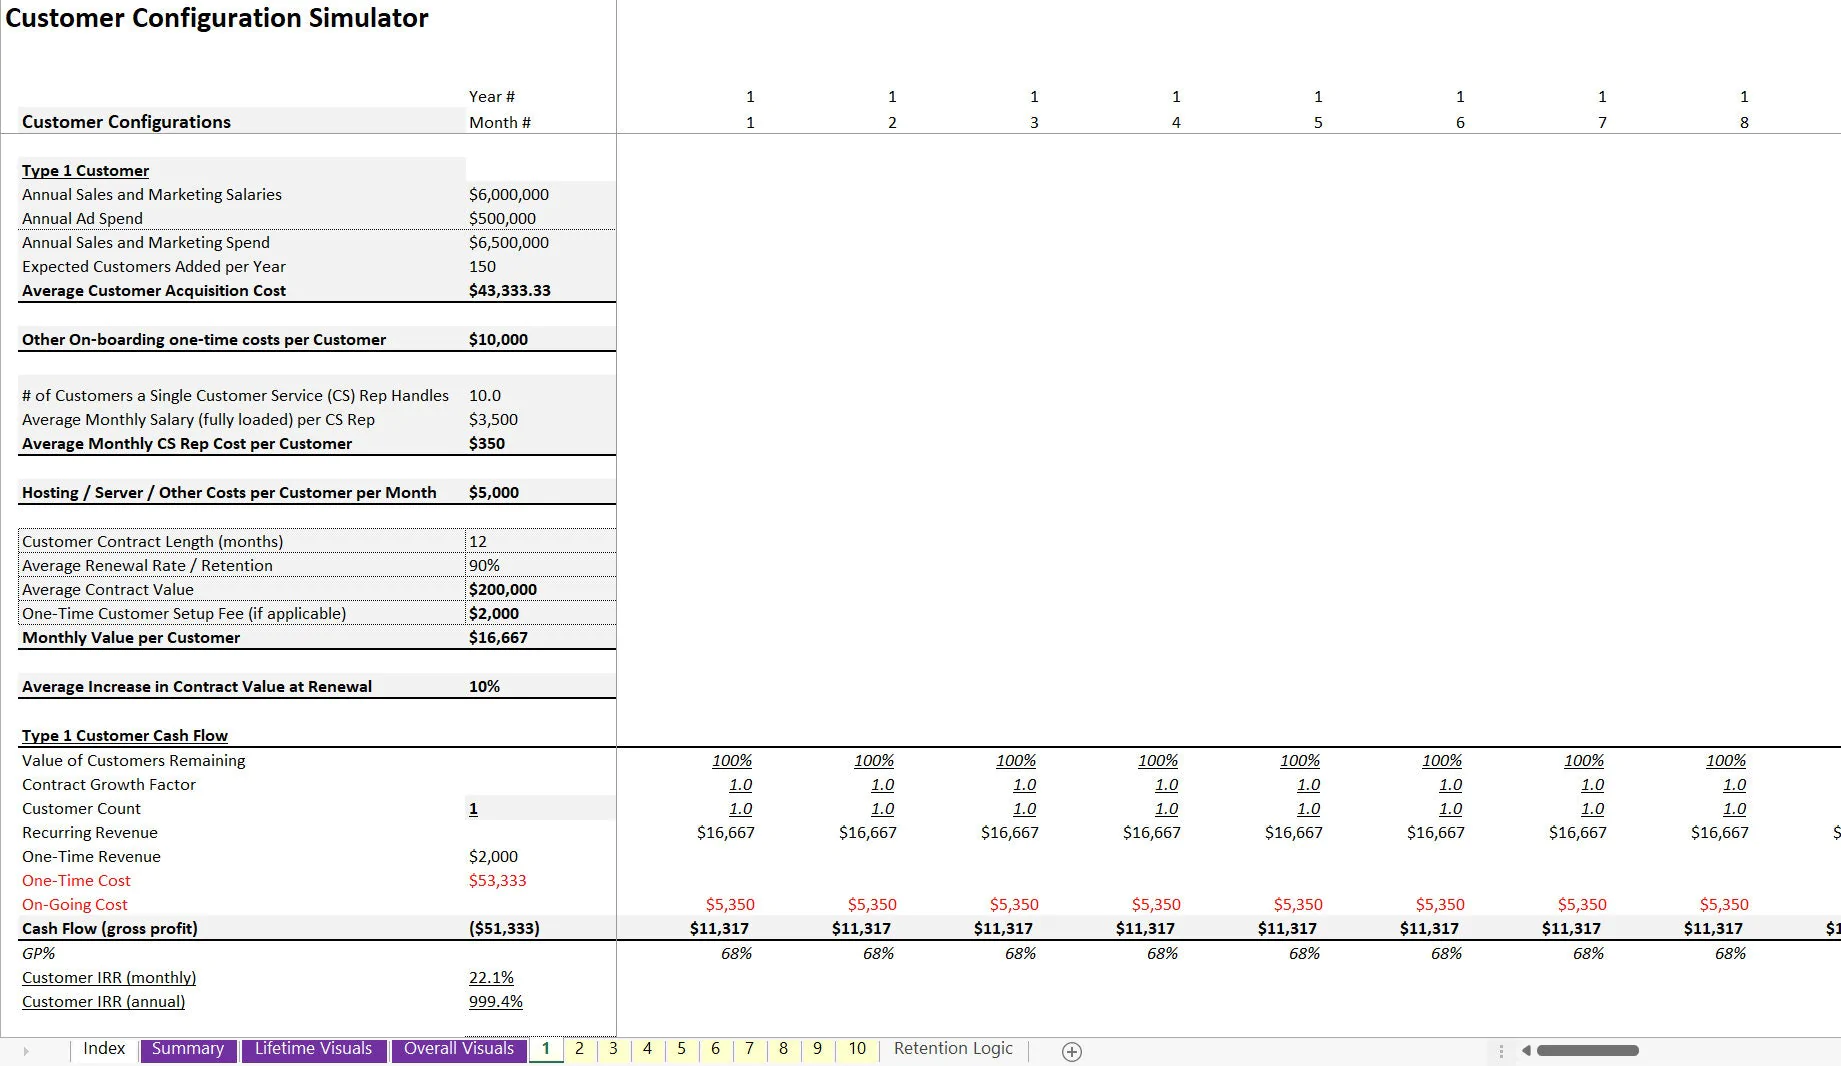
Yes, IRR was built into this (monthly and annual) and this can be done because each customer can be distilled down to net cost to acquire and future cash flows per the retention / contract period.
Based on this, you can simply run an IRR calc. And that becomes a good metric to compare various customer configurations by. Initial acquisition costs and on-going costs to service each contracted are broken down into more bottom-up assumptions for more accurate calculations.
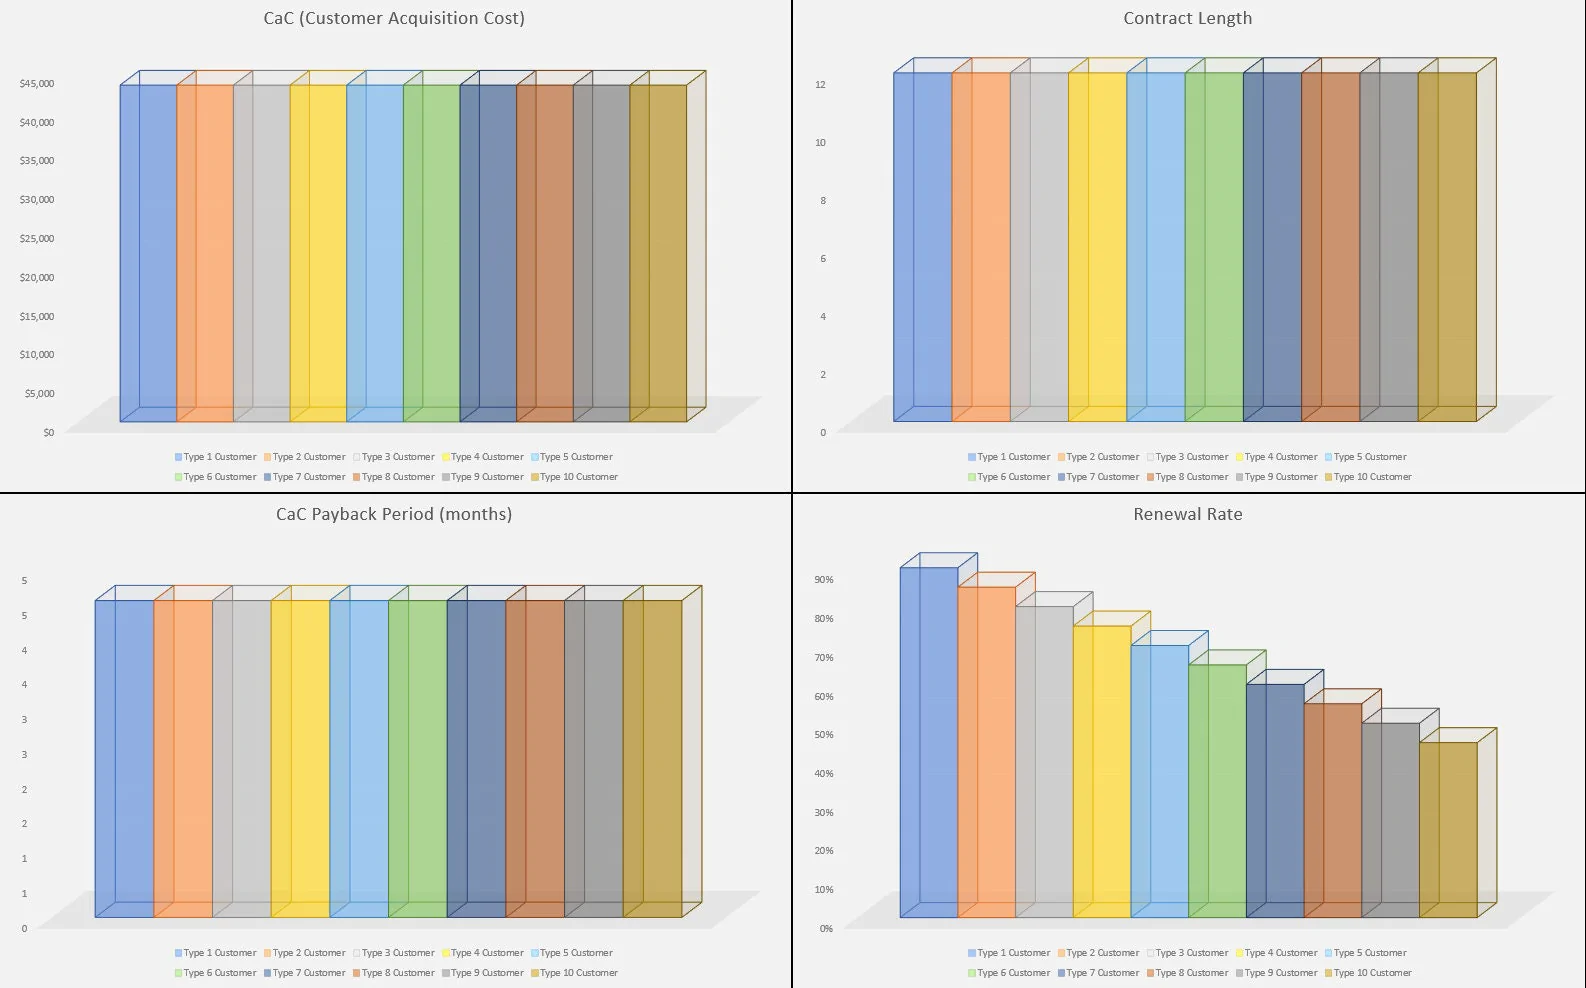
For example, you can define things like ad spend in period, sales and marketing spend in period, and measure that against expected customers added in period to get the CaC. Awesome visuals will show the final key metric outputs per customer type (up to 10). Video Instructions included (link in file)
This simulator empowers you to visualize and analyze the financial dynamics of various customer types, making it easier to pinpoint the most lucrative segments. With detailed metrics on customer lifetime value, payback periods, and renewal rates, you can make data-driven pricing decisions that align with your strategic goals.
Got a question about the product? Email us at support@flevy.com or ask the author directly by using the "Ask the Author a Question" form. If you cannot view the preview above this document description, go here to view the large preview instead.
TOPIC FAQ
What unit-economics metrics should I track when setting SaaS prices?
Key metrics include customer lifetime value (LTV), customer acquisition cost (CAC), CAC payback period, LTV:CAC ratio, gross profit per customer, and internal rate of return (IRR). These metrics together show profitability and capital recovery timing, including IRR calculated on a monthly and annual basis.How do you calculate LTV for subscription customers?
LTV is modeled from contract value, retention rates, contract length (in months), expected renewal improvement, ongoing service costs, and one-time setup fees, then aggregated as future customer cash flows. The template supports these inputs and computes total lifetime cash flows by contract length in months.How can I derive CAC and CAC payback from marketing and sales spend?
Define period ad spend and sales & marketing spend alongside expected customers acquired in that period to compute CAC. CAC payback is then calculated by comparing acquisition cost to gross profit generated over time per customer using the model’s cash-flow timeline and profit breakdown.What should I look for when choosing a SaaS pricing simulation template?
Prioritize templates that accept configurable inputs for contract value, retention, contract length, CAC drivers, and service costs; can model multiple customer profiles; provide sensitivity analysis; and include cash-flow metrics like LTV and IRR. The SaaS Customer Pricing Simulator: Optimization Template includes these features and video instructions.What level of financial expertise is required to use a SaaS pricing model?
Users should understand contract terms, retention dynamics, acquisition spend allocation, and cash-flow discounting. The template is general-use for SaaS finance teams and includes video instructions to guide input mapping and metric interpretation via built-in calculations and visual outputs (link in file).How do I compare enterprise and SMB customer economics using a model?
Create separate customer profiles with different contract values, retention, contract lengths, CAC, and service costs, then compare outputs such as LTV, CAC payback, LTV:CAC ratio, and IRR across profiles. The template supports up to 10 distinct customer types for side-by-side comparison.Can sensitivity analysis show the impact of improving renewal rates or contract values?
Yes; by isolating one variable (for example, renewal uplift or retention) while holding others constant, you can observe changes in LTV, CAC payback, LTV:CAC ratio, and IRR. The SaaS Customer Pricing Simulator: Optimization Template is built to run those sensitivity scenarios across customer configurations.How do I judge the cost versus value of buying a pricing template instead of building one in-house?
Consider whether your team needs pre-built cash-flow logic, visuals, and IRR calculations versus custom modeling time. A purchased template can provide bottom-up acquisition and servicing assumptions, visual outputs, and built-in monthly/annual IRR and sensitivity analysis to reduce model build time.Source: Best Practices in SaaS, Integrated Financial Model Excel: SaaS Customer Pricing Simulator: Optimization Template Excel (XLSX) Spreadsheet, Jason Varner | SmartHelping
ABOUT THE AUTHOR
I graduated in 2011 with a Bachelor's degree in Accounting and began my career as a financial analyst at a small chain of auto repair shops. After gaining valuable experience, I launched my own practice specializing in real estate underwriting, later expanding into general business modeling.
I honed my spreadsheet modeling expertise by completing over 400 projects on Upwork with a 100% success
... [read more]
Ask the Author a Question
You must be logged in to contact the author.
This document is available as part of the following discounted bundle(s):
Save %!
Subscription-based Financial Models
This bundle contains 28 total documents. See all the documents to the right.
