

Web or Mobile App SaaS Startup Model with Sensitivity Driver – Excel XLSX
Excel (XLSX)
VIDEO DEMO
SAAS EXCEL DESCRIPTION
Recent Updates: Added Financial Statements (fully integrated Income Statement, Balance Sheet, and Cash Flow Statement as well as a cap table and logic for capex/depreciation.
This 5-year startup SaaS financial model is granular in its revenue generation / customer acquisition and flow, pricing, churn, and expense assumptions. It would fit a general SaaS business as well as a mobile app or any month-to-month recurring revenue pricing structure, including freemium (with an on-going free pool).
A free customer pool is also accounted for in the logic prior to a flow to up to five pricing tiers. Up to five key variables have sensitivity logic tied to them. Each sensitivity is a 15% move away from the base assumption (Worst, Bad, Base, Better Excellent). This makes it easy to change a given assumption and see how it ripples through the model.
Assumptions with sensitivity drivers include:
• Traffic Growth Rate
• Conversion (traffic to free)
• Conversion (free to paid)
• Churn rate (all tiers)
• Price (all tiers)
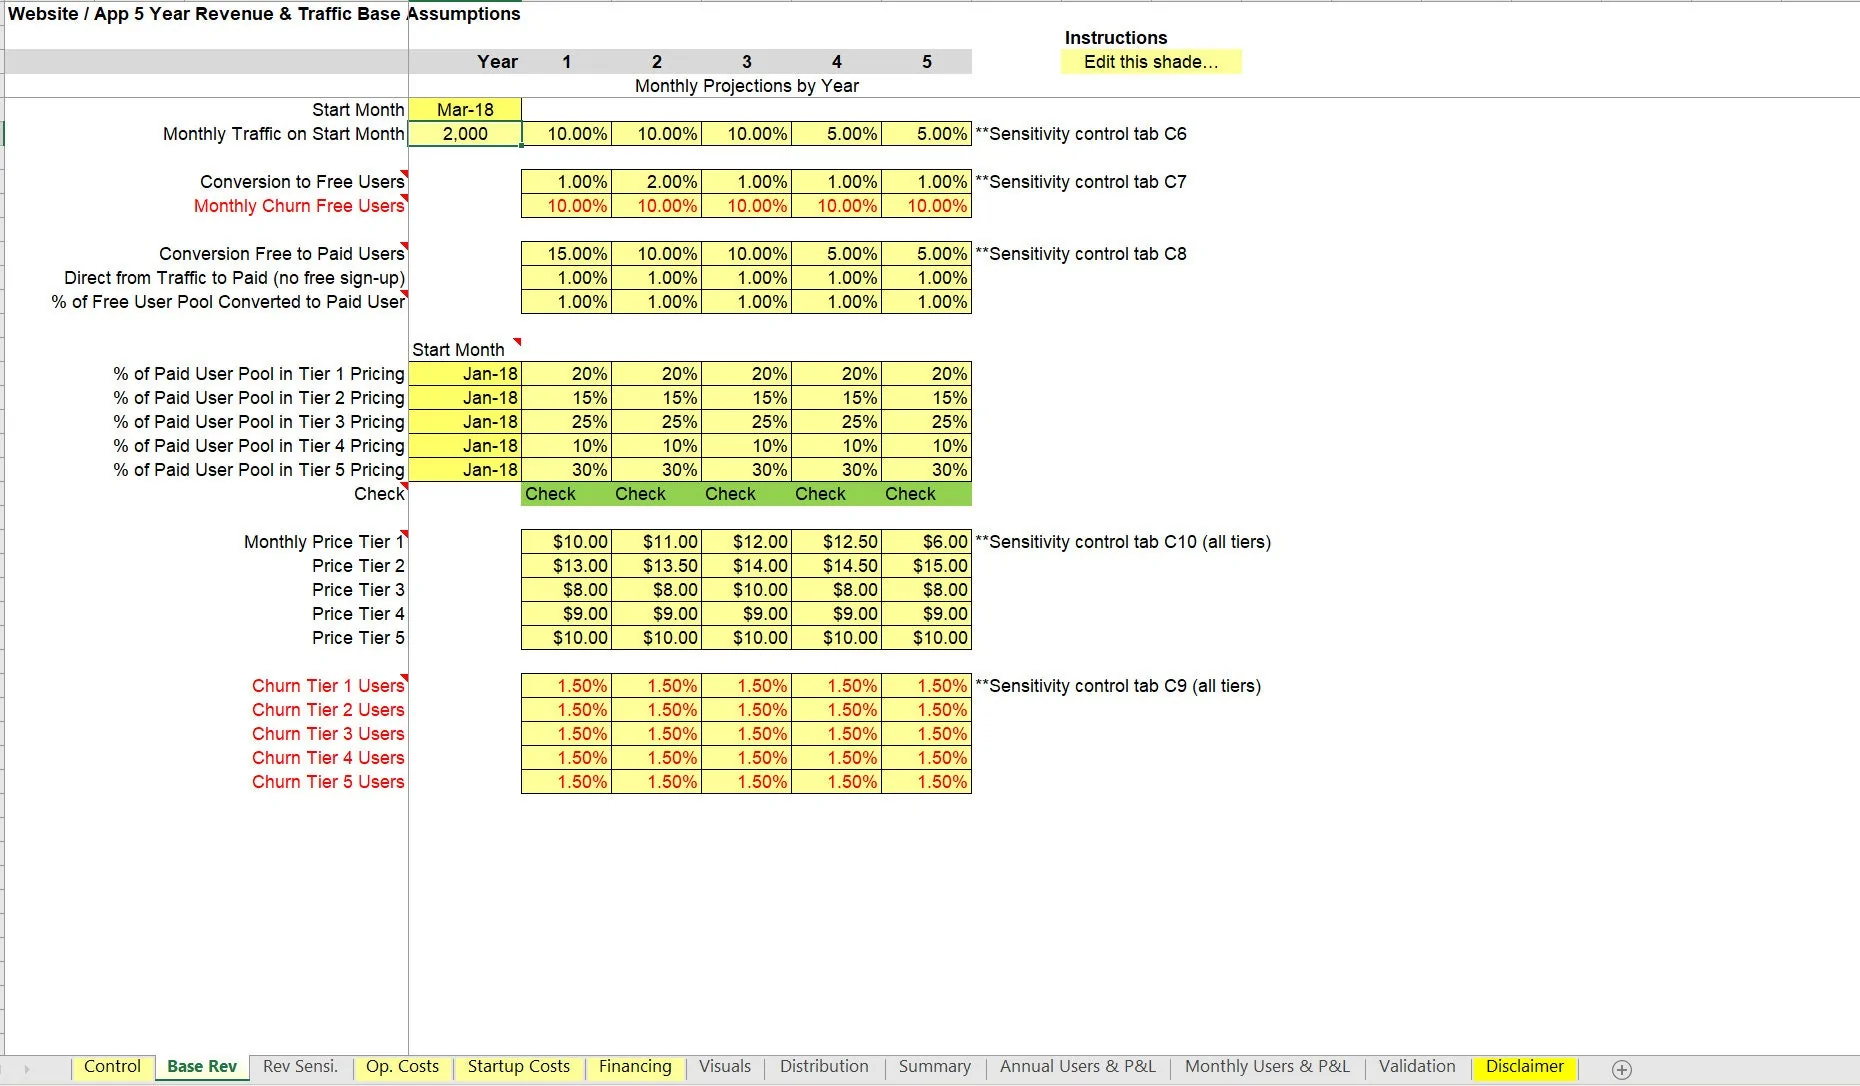
The revenue waterfall is granular. The initial free pool flows as follows:
• Define the starting monthly traffic.
• Define monthly percentage growth of traffic per year.
• Define start month traffic begins.
• Define how much of the traffic converts to a free customer
• Define the average monthly churn rate of that free user pool.
Then, moving customers from the free to paid pool happens as follows:
• Define a percentage of free customer sign-ups that convert to paid in the first month.
• Define the percentage of traffic that converts directly to a paid user and skips the free pool.
• If you have no free pool, simply make 100% of users move from free to paid and that effectively bypasses having a free user pool.
• Define the percentage of the existing free pool customers that convert to paid per month i.e. if the free customer pool is at 1,000 in a given month, maybe 1% of them happen to convert paid. This was separated from free to paid users in order to account for customers that may not convert to paid for awhile.
• Define the percentage of paid customers that fall into each pricing tier.
• Define the monthly price for each pricing tier.
The average monthly churn rate can be defined per pricing tier.
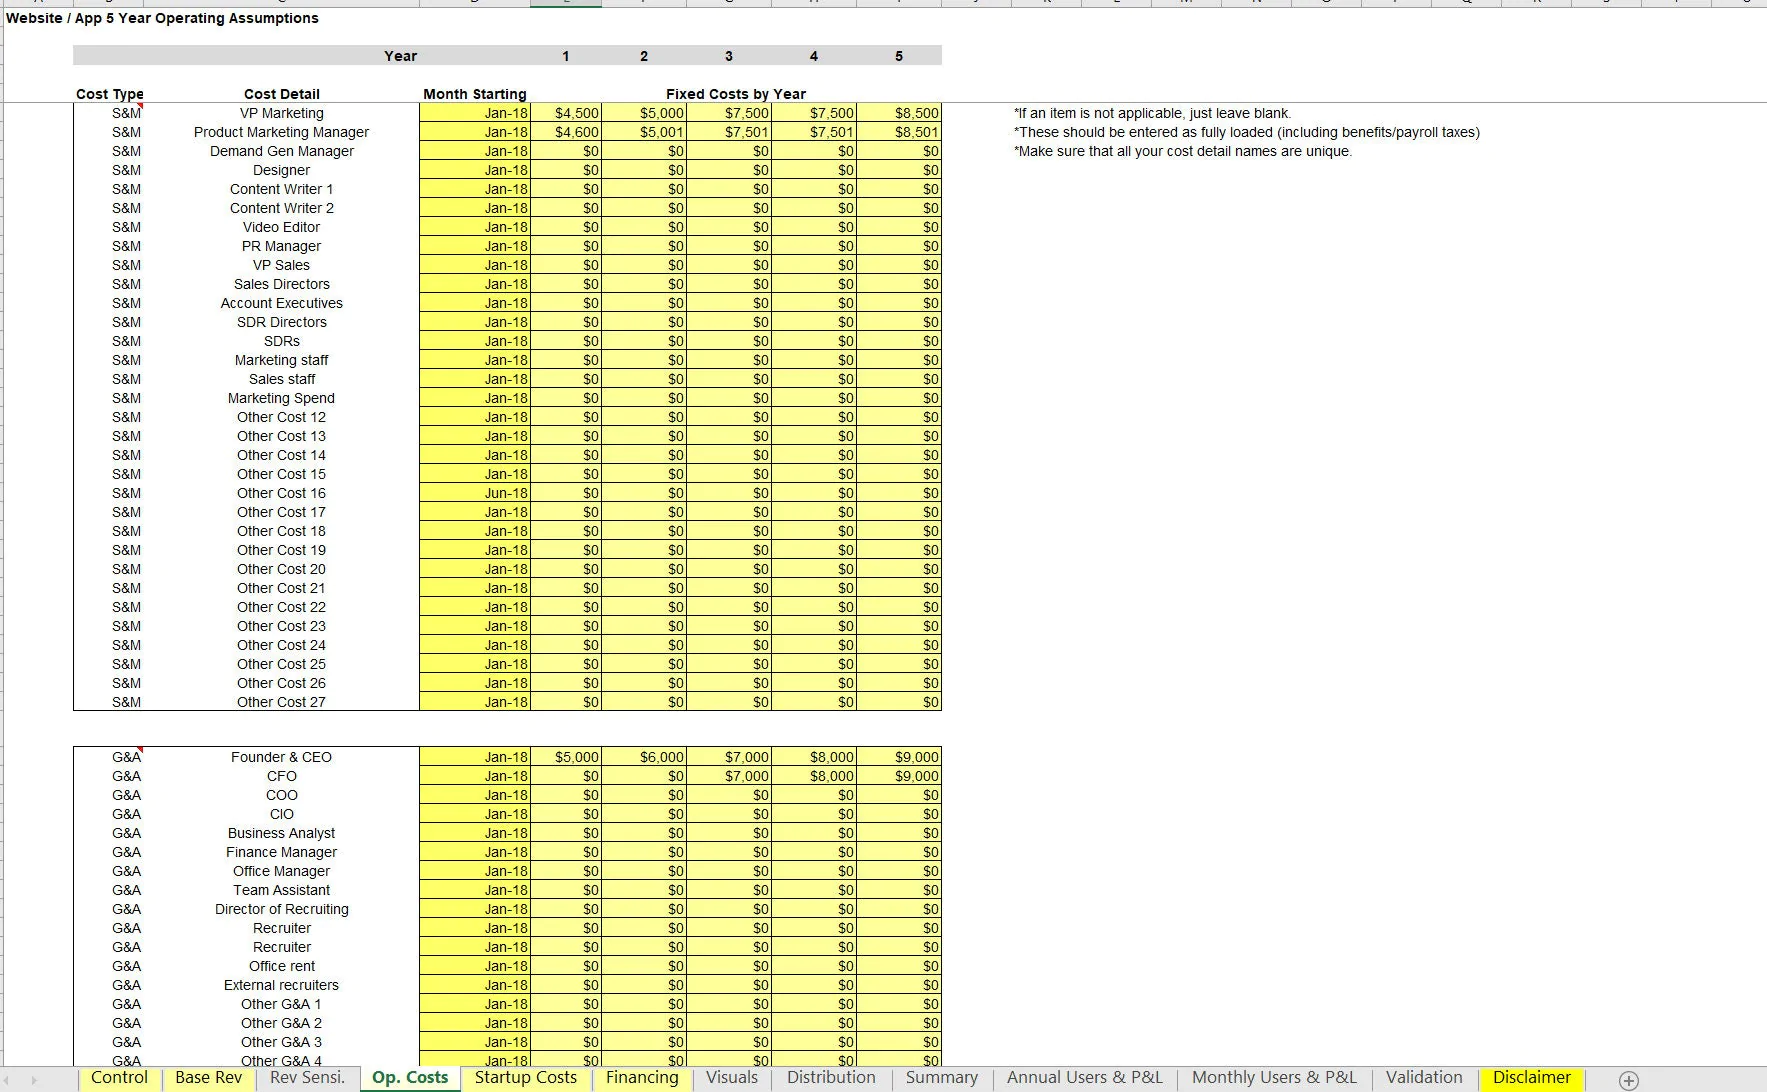
Operating expenses are defined in a robust schedule that has up to 32 slots for General and Administrative, Sales and Marketing, and Research and Development. In each slot, the user defines the line item description, start month, and monthly cost in each of the five years.
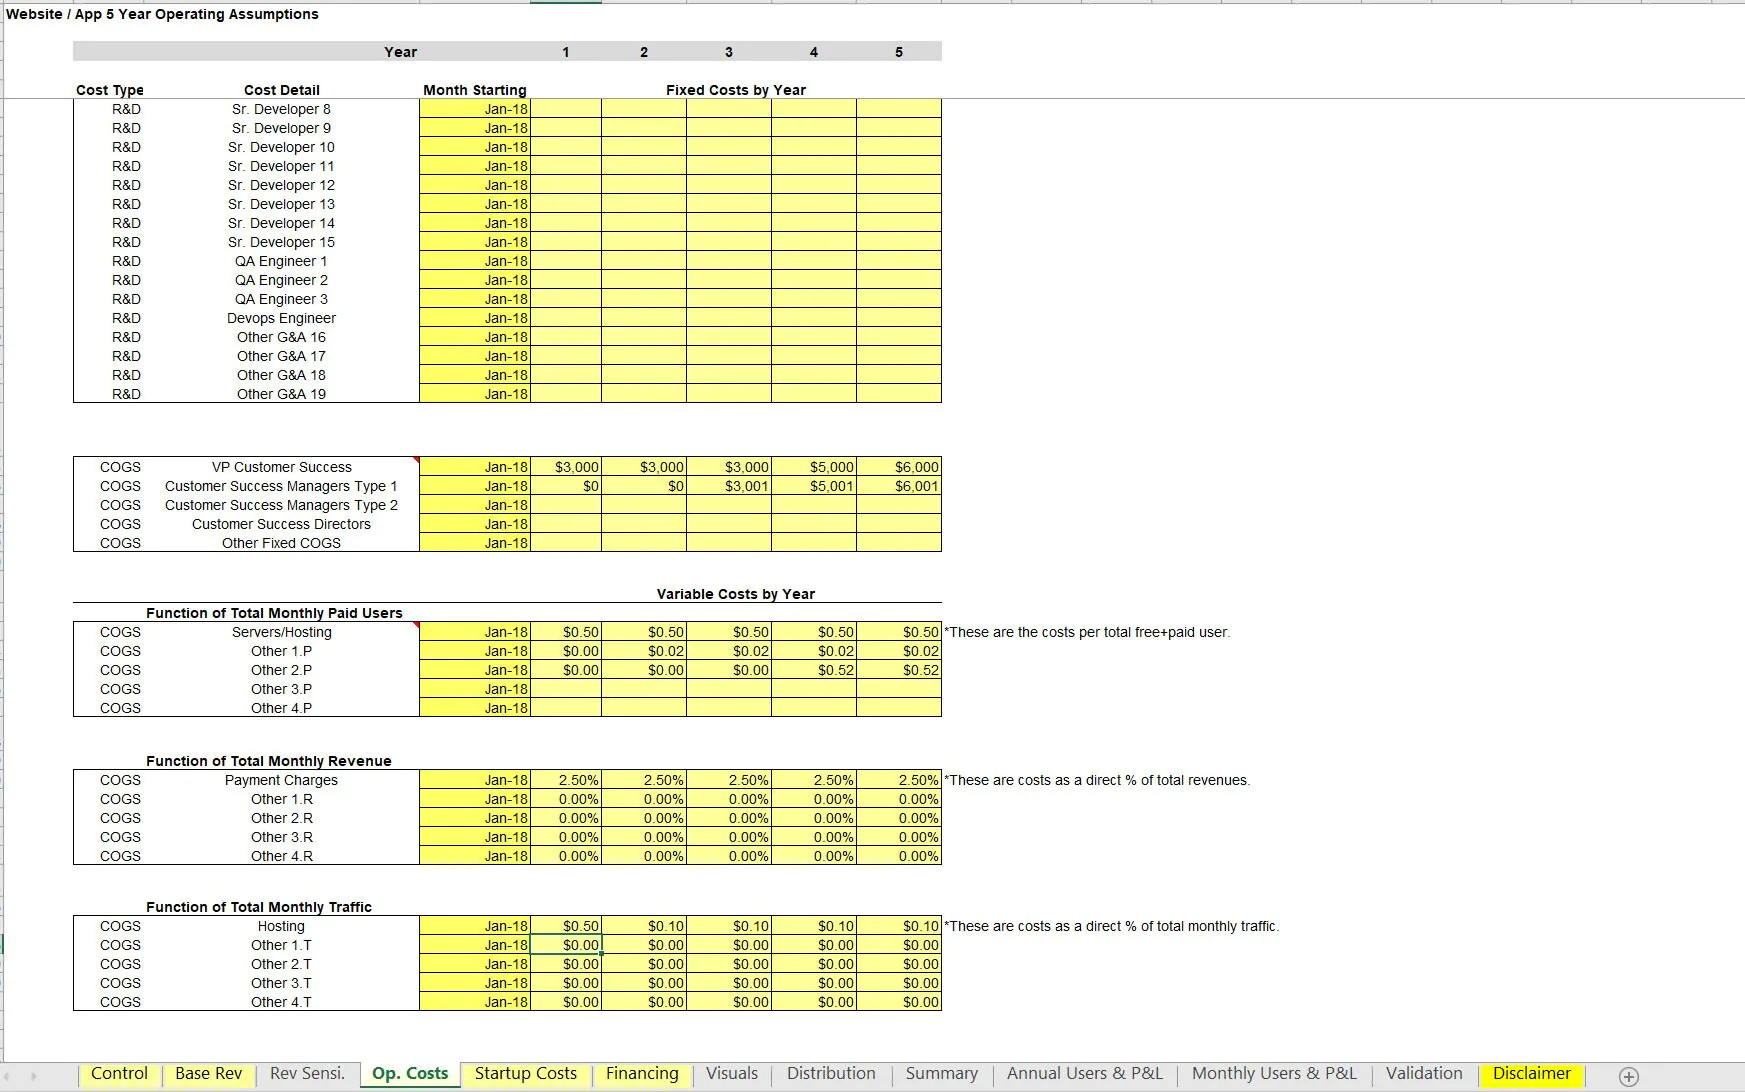
For Cost of Goods Sold (COGS) there are four separate schedules (one of them being customer success workers / costs) and the others being based on the number of paid customers cost per customer per month, a direct percentage of revenue, and a function of total monthly traffic (cost per user per month).
There is a separate schedule for one-time startup costs and future one-time CapEx items. A basic debt schedule is also configurable if the model is to display funding some of the initial investment with traditional p+i debt. It is assumed to be fully repaid if an exit month / terminal value is defined.
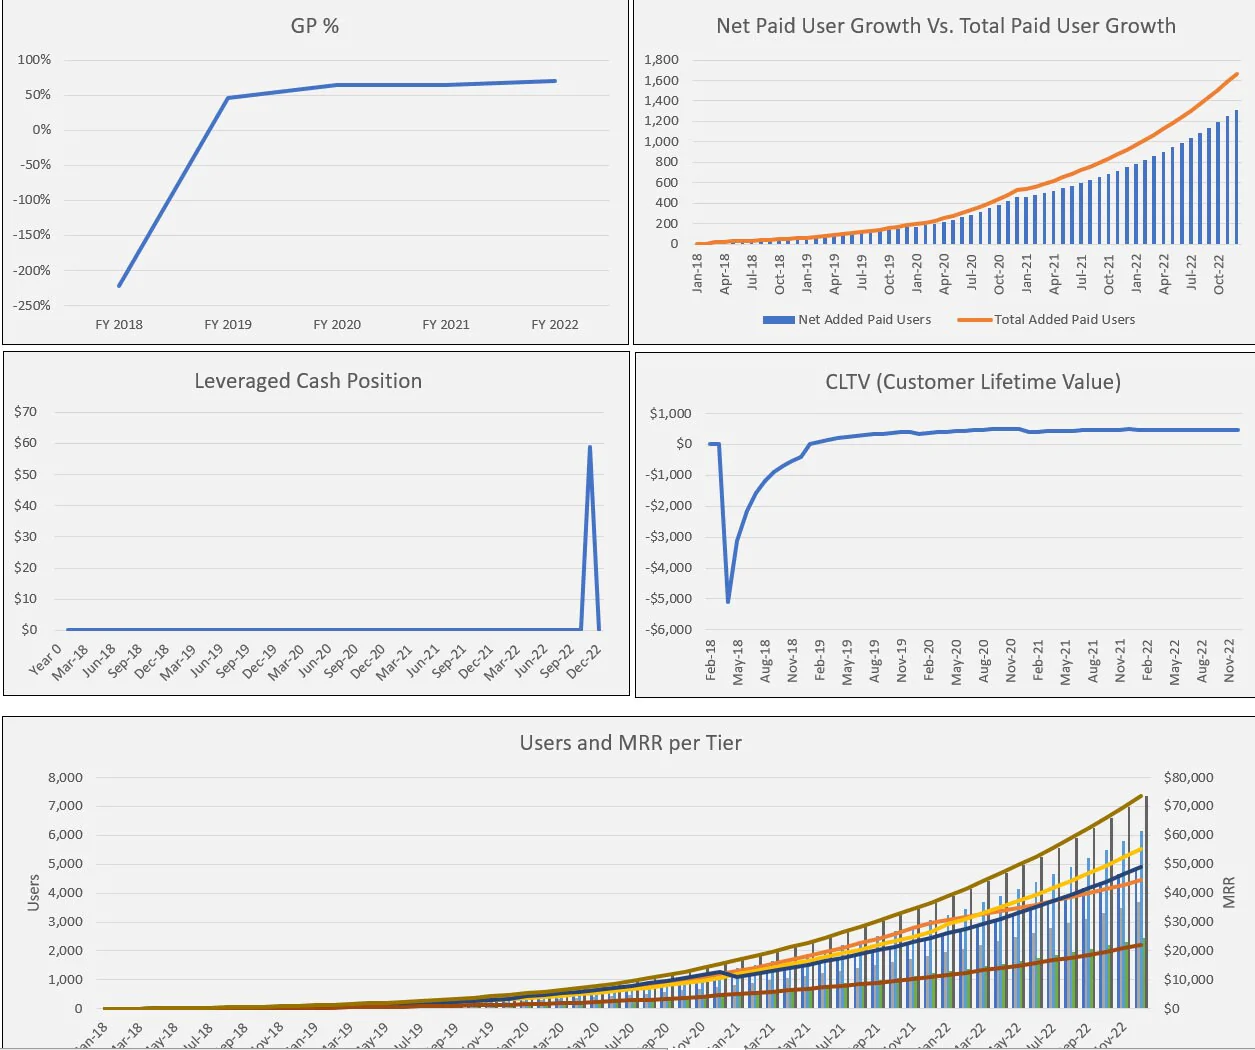
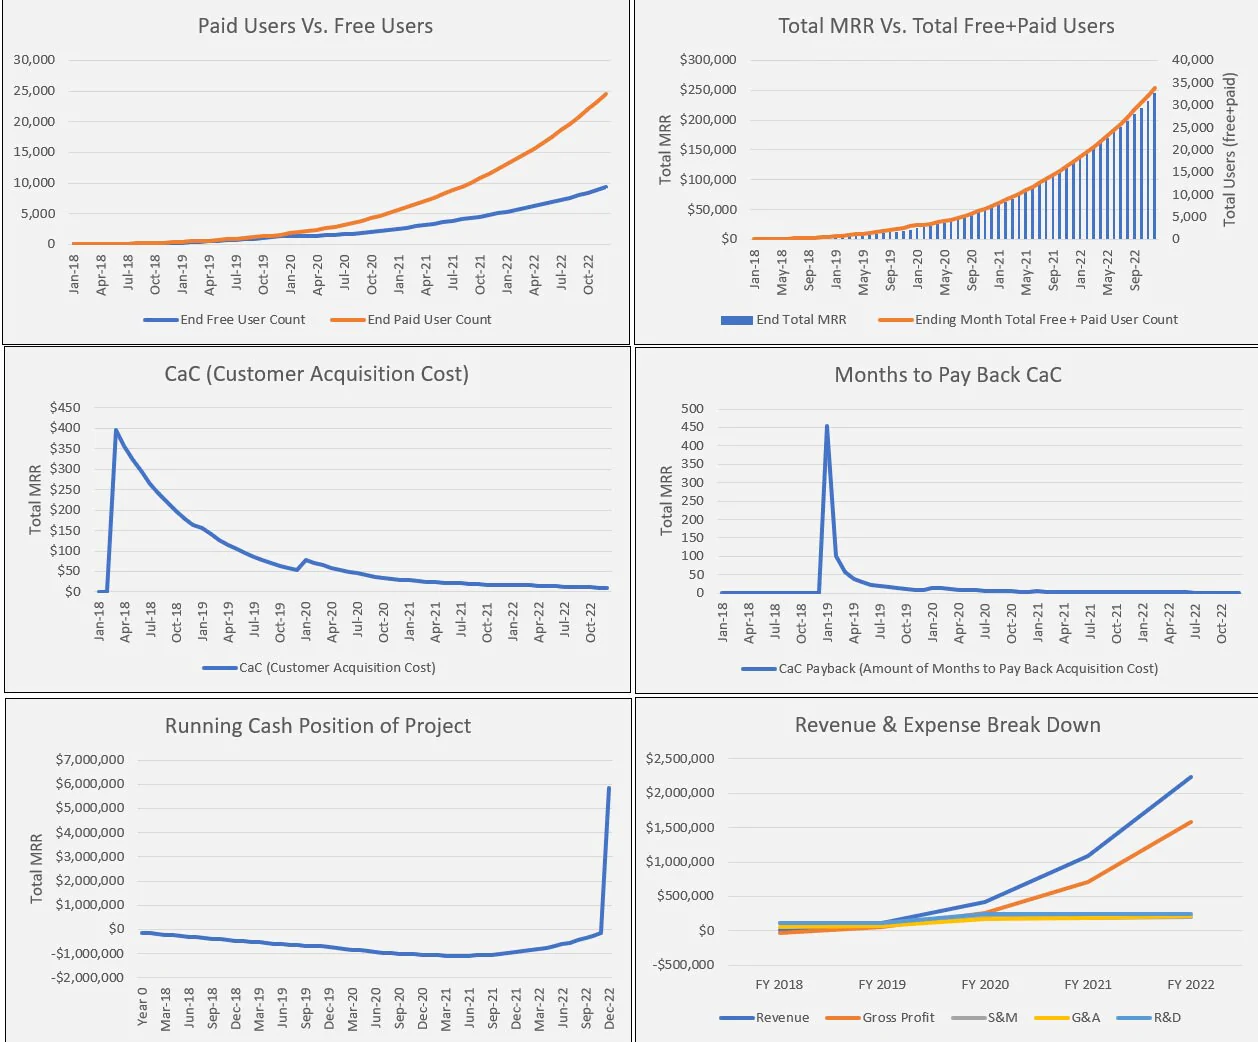
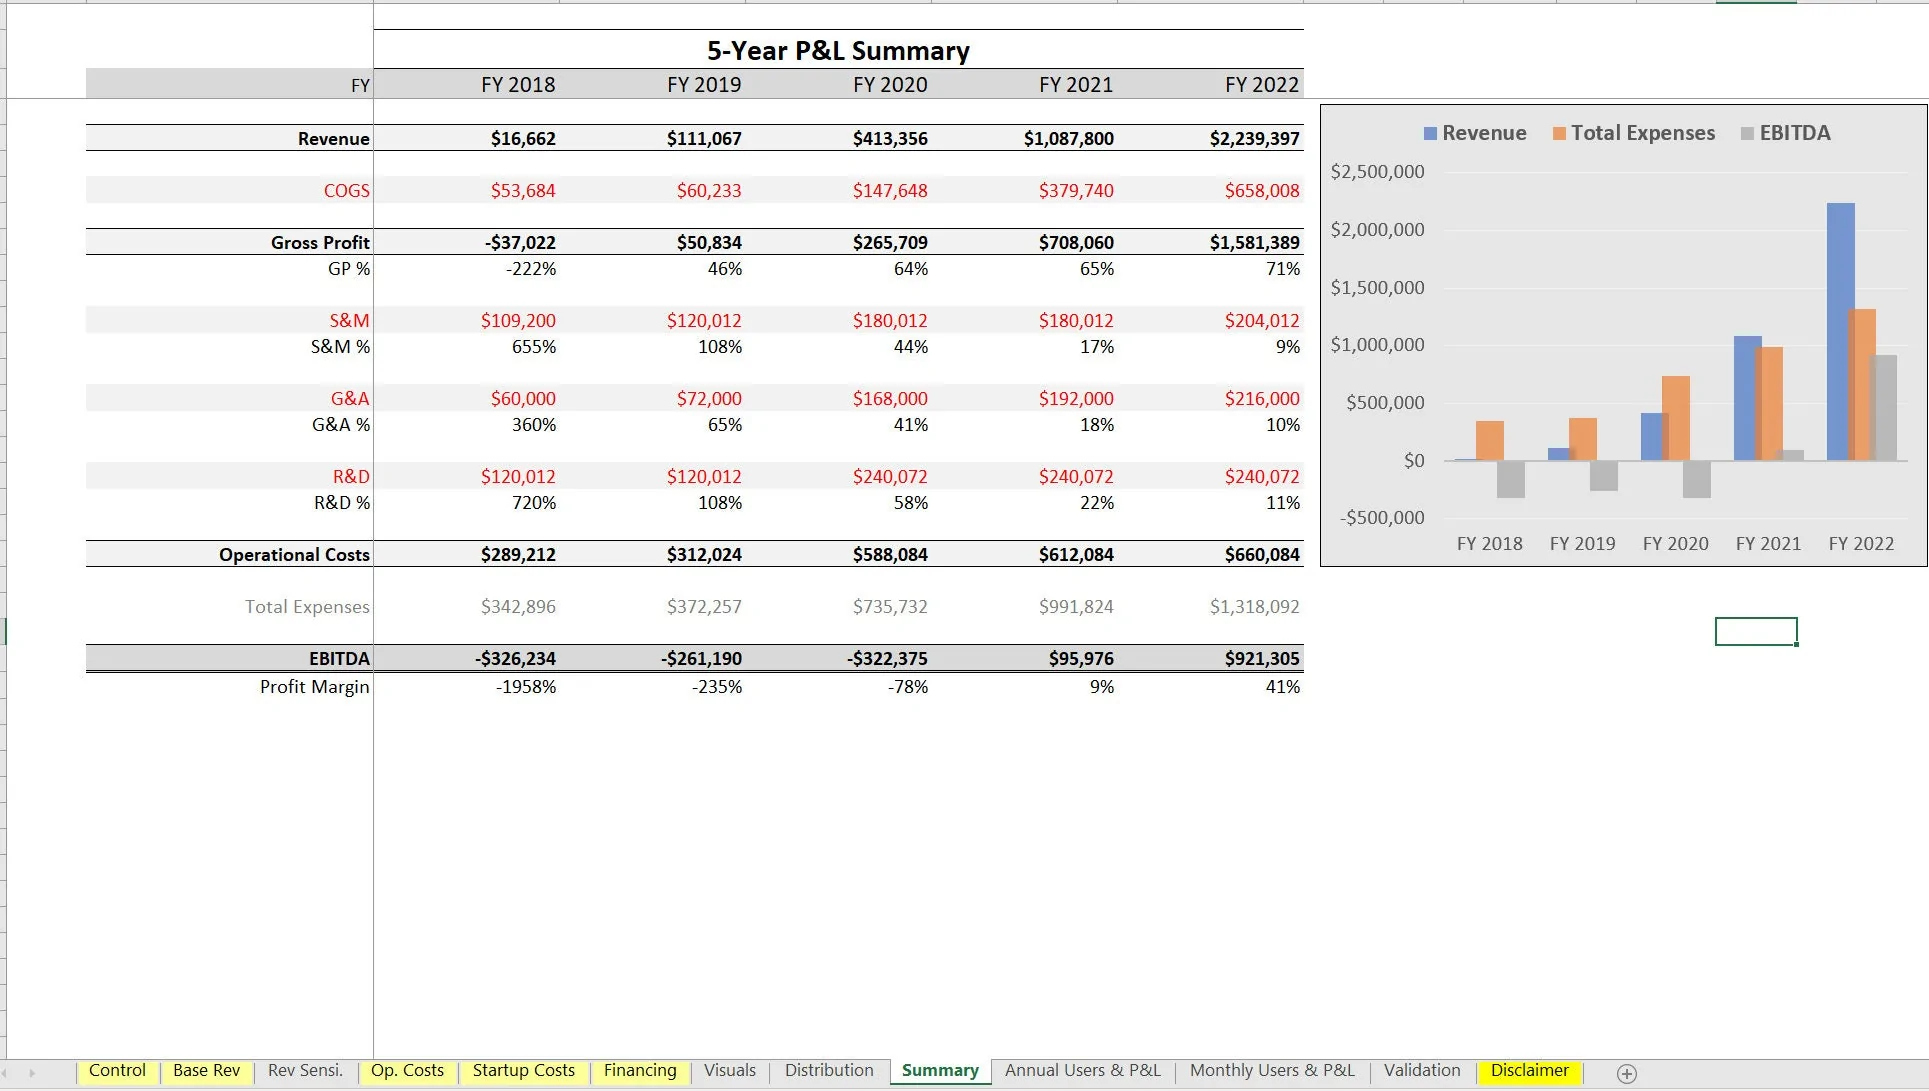
The terminal value is based on a multiple of 12-month revenue at exit. Over 11 visualizations were built in to make the final results more digestible and presentable. A final monthly and annual pro forma detail are displayed. This shows the granular effect of all customer pools over time and the monthly revenue and expenses.
The pro forma drives down to EBITDA and leveraged / non-leveraged cash flow as well as KPI results such as CaC, months to pay back CaC, and average customer lifetime value.
A high level 5-year financial summary and contribution / distribution schedule show the high level financial results and provide a DCF Analysis for the project as a whole and for the investor pool (if applicable) and the owner equity pool. IRR is also displayed for each.
Got a question about the product? Email us at support@flevy.com or ask the author directly by using the "Ask the Author a Question" form. If you cannot view the preview above this document description, go here to view the large preview instead.
Source: Best Practices in SaaS, Mobile App, Integrated Financial Model Excel: Web or Mobile App SaaS Startup Model with Sensitivity Driver Excel (XLSX) Spreadsheet, Jason Varner | SmartHelping
ABOUT THE AUTHOR
I graduated in 2011 with a Bachelor's degree in Accounting and began my career as a financial analyst at a small chain of auto repair shops. After gaining valuable experience, I launched my own practice specializing in real estate underwriting, later expanding into general business modeling.
I honed my spreadsheet modeling expertise by completing over 400 projects on Upwork with a 100% success
... [read more]
Ask the Author a Question
You must be logged in to contact the author.
