
Data-as-a-Service Startup Financial Model – Excel XLSX
Excel (XLSX)
VIDEO DEMO
BENEFITS OF THIS DOWNLOADABLE EXCEL DOCUMENT
- A framework for studying the economics of selling data via API requests, volume of data downloaded, a subscription, and one-time sales.
SAAS EXCEL DESCRIPTION
You could have 1 GB of valuable information you are granting millions of people API access to and charging per request or per download or even a monthly subscription, or you could have 1,000,000,000s of GBs that are you selling access to. Either way this model has the ability for the user to enter in relevant assumptions and see the resulting revenues, expenses, and returns of starting and running a data-as-a-service business.
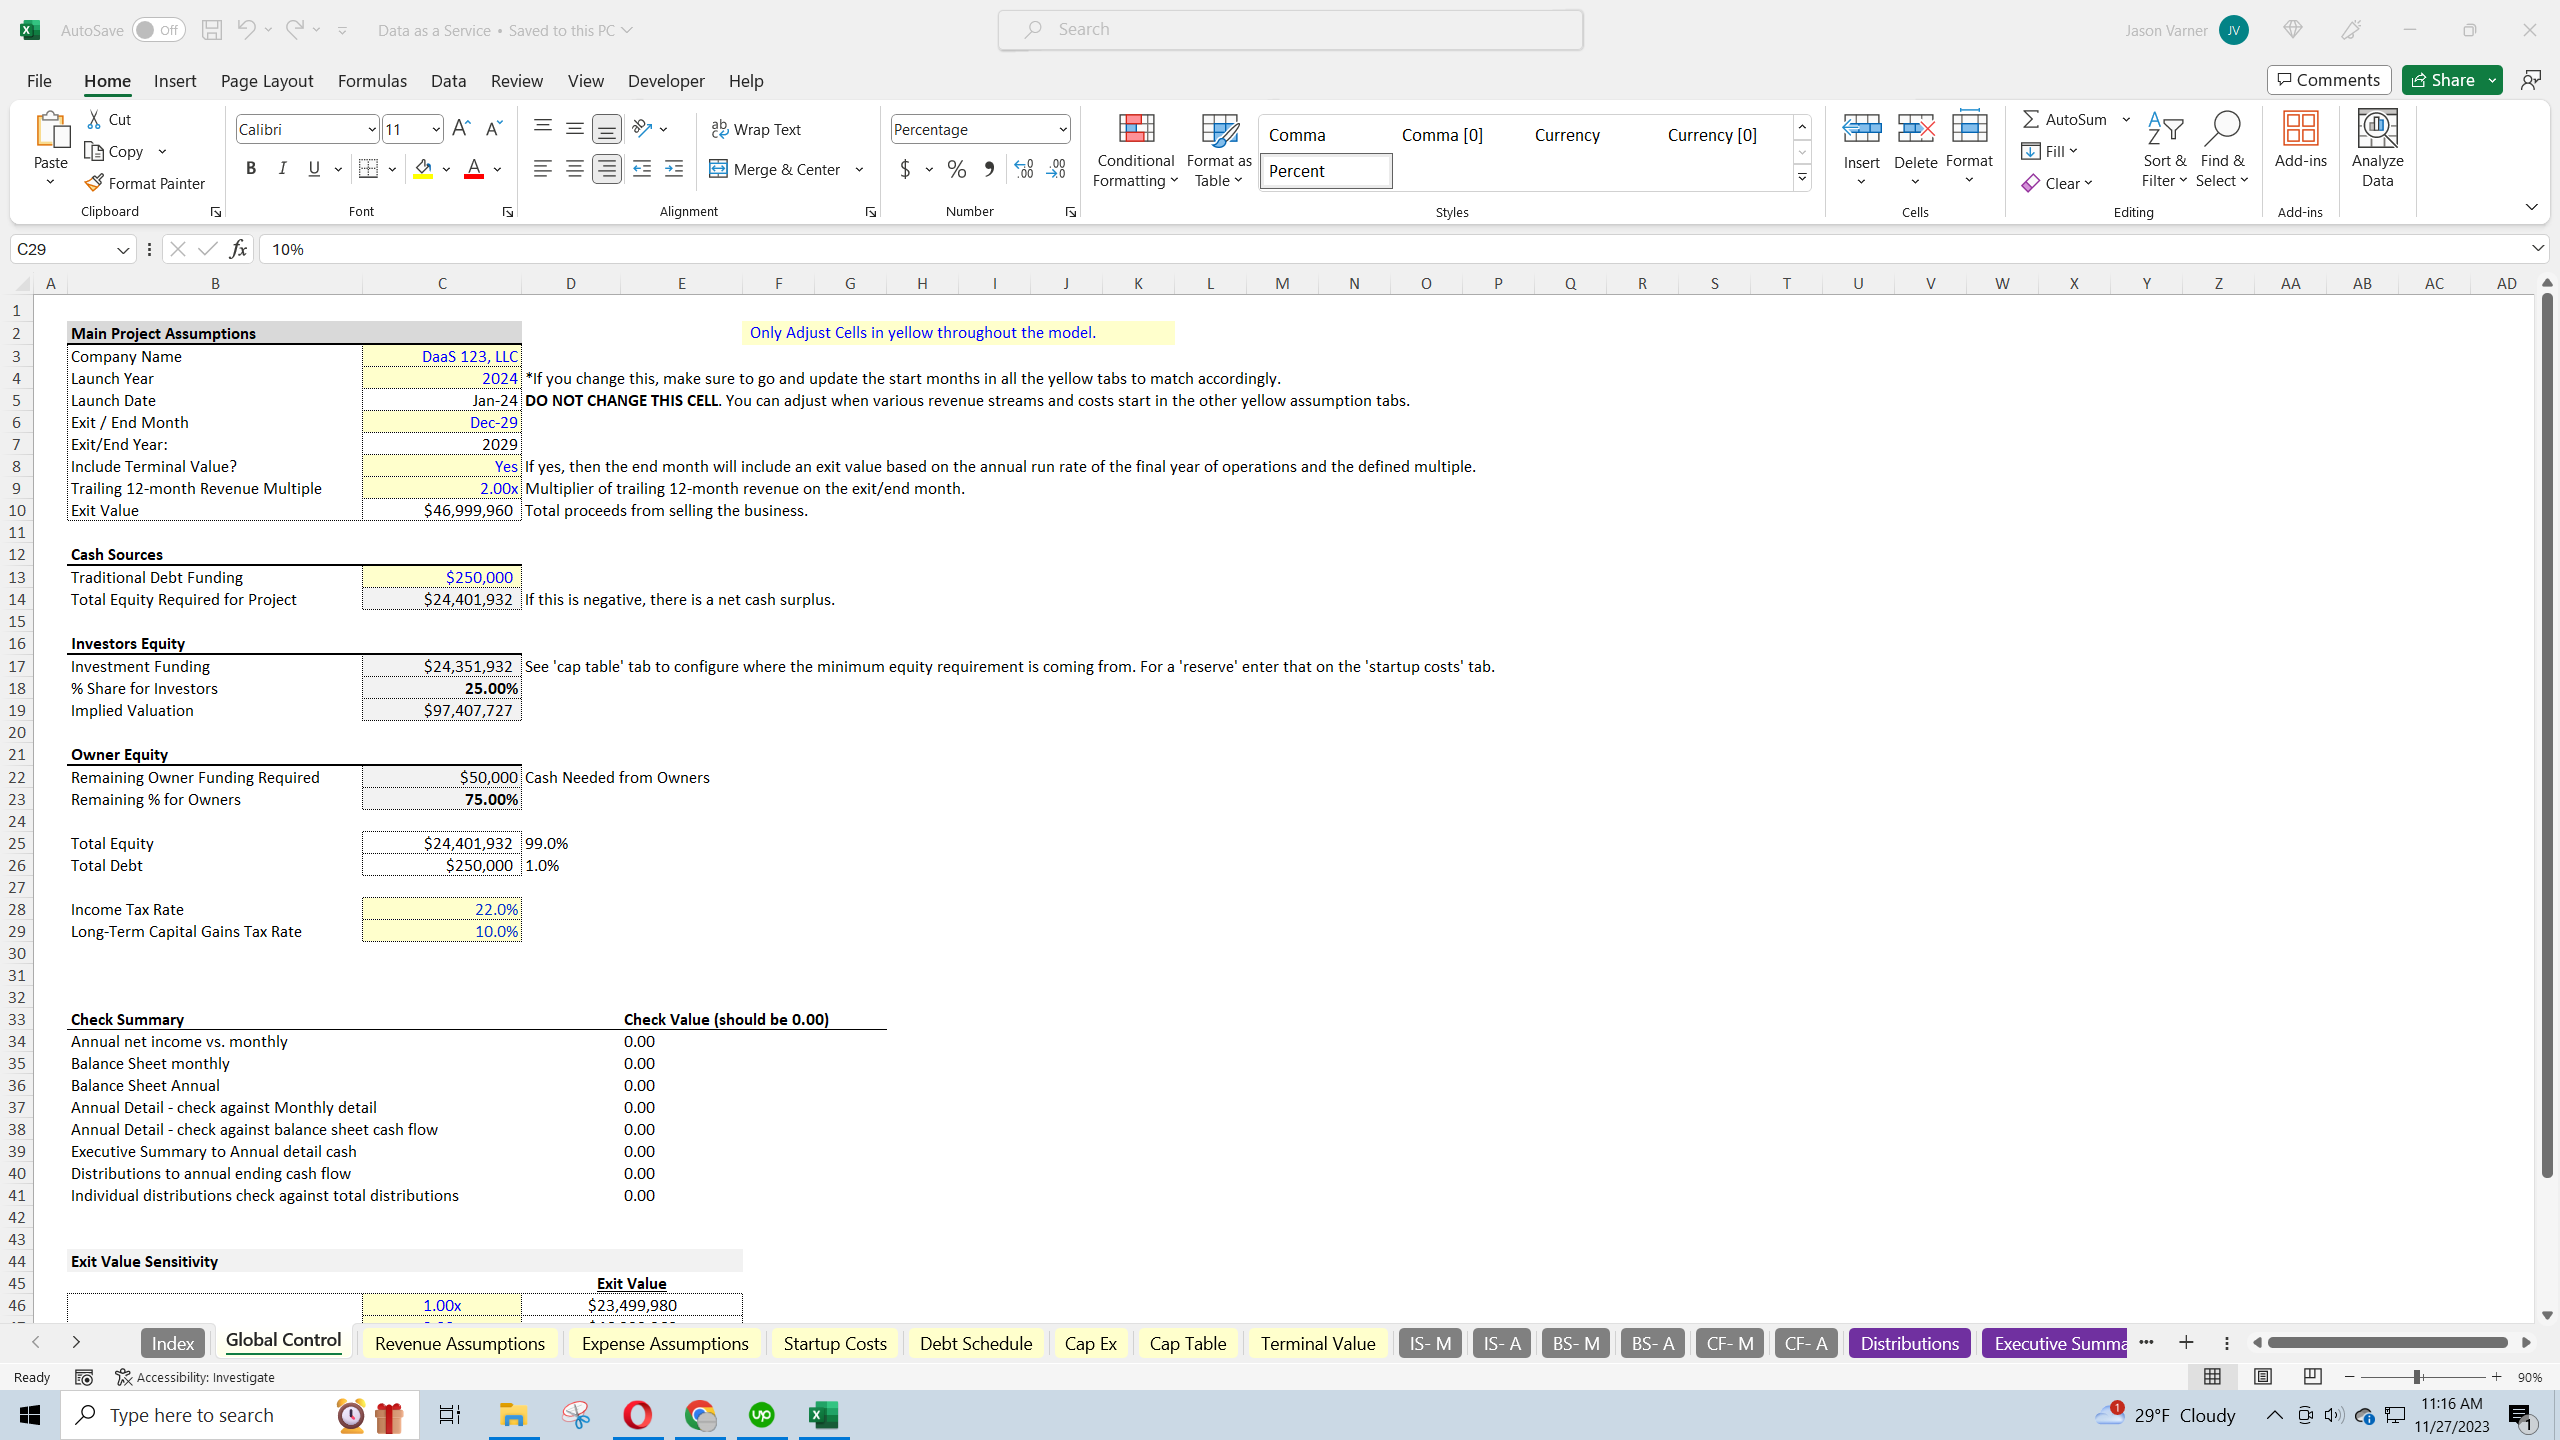
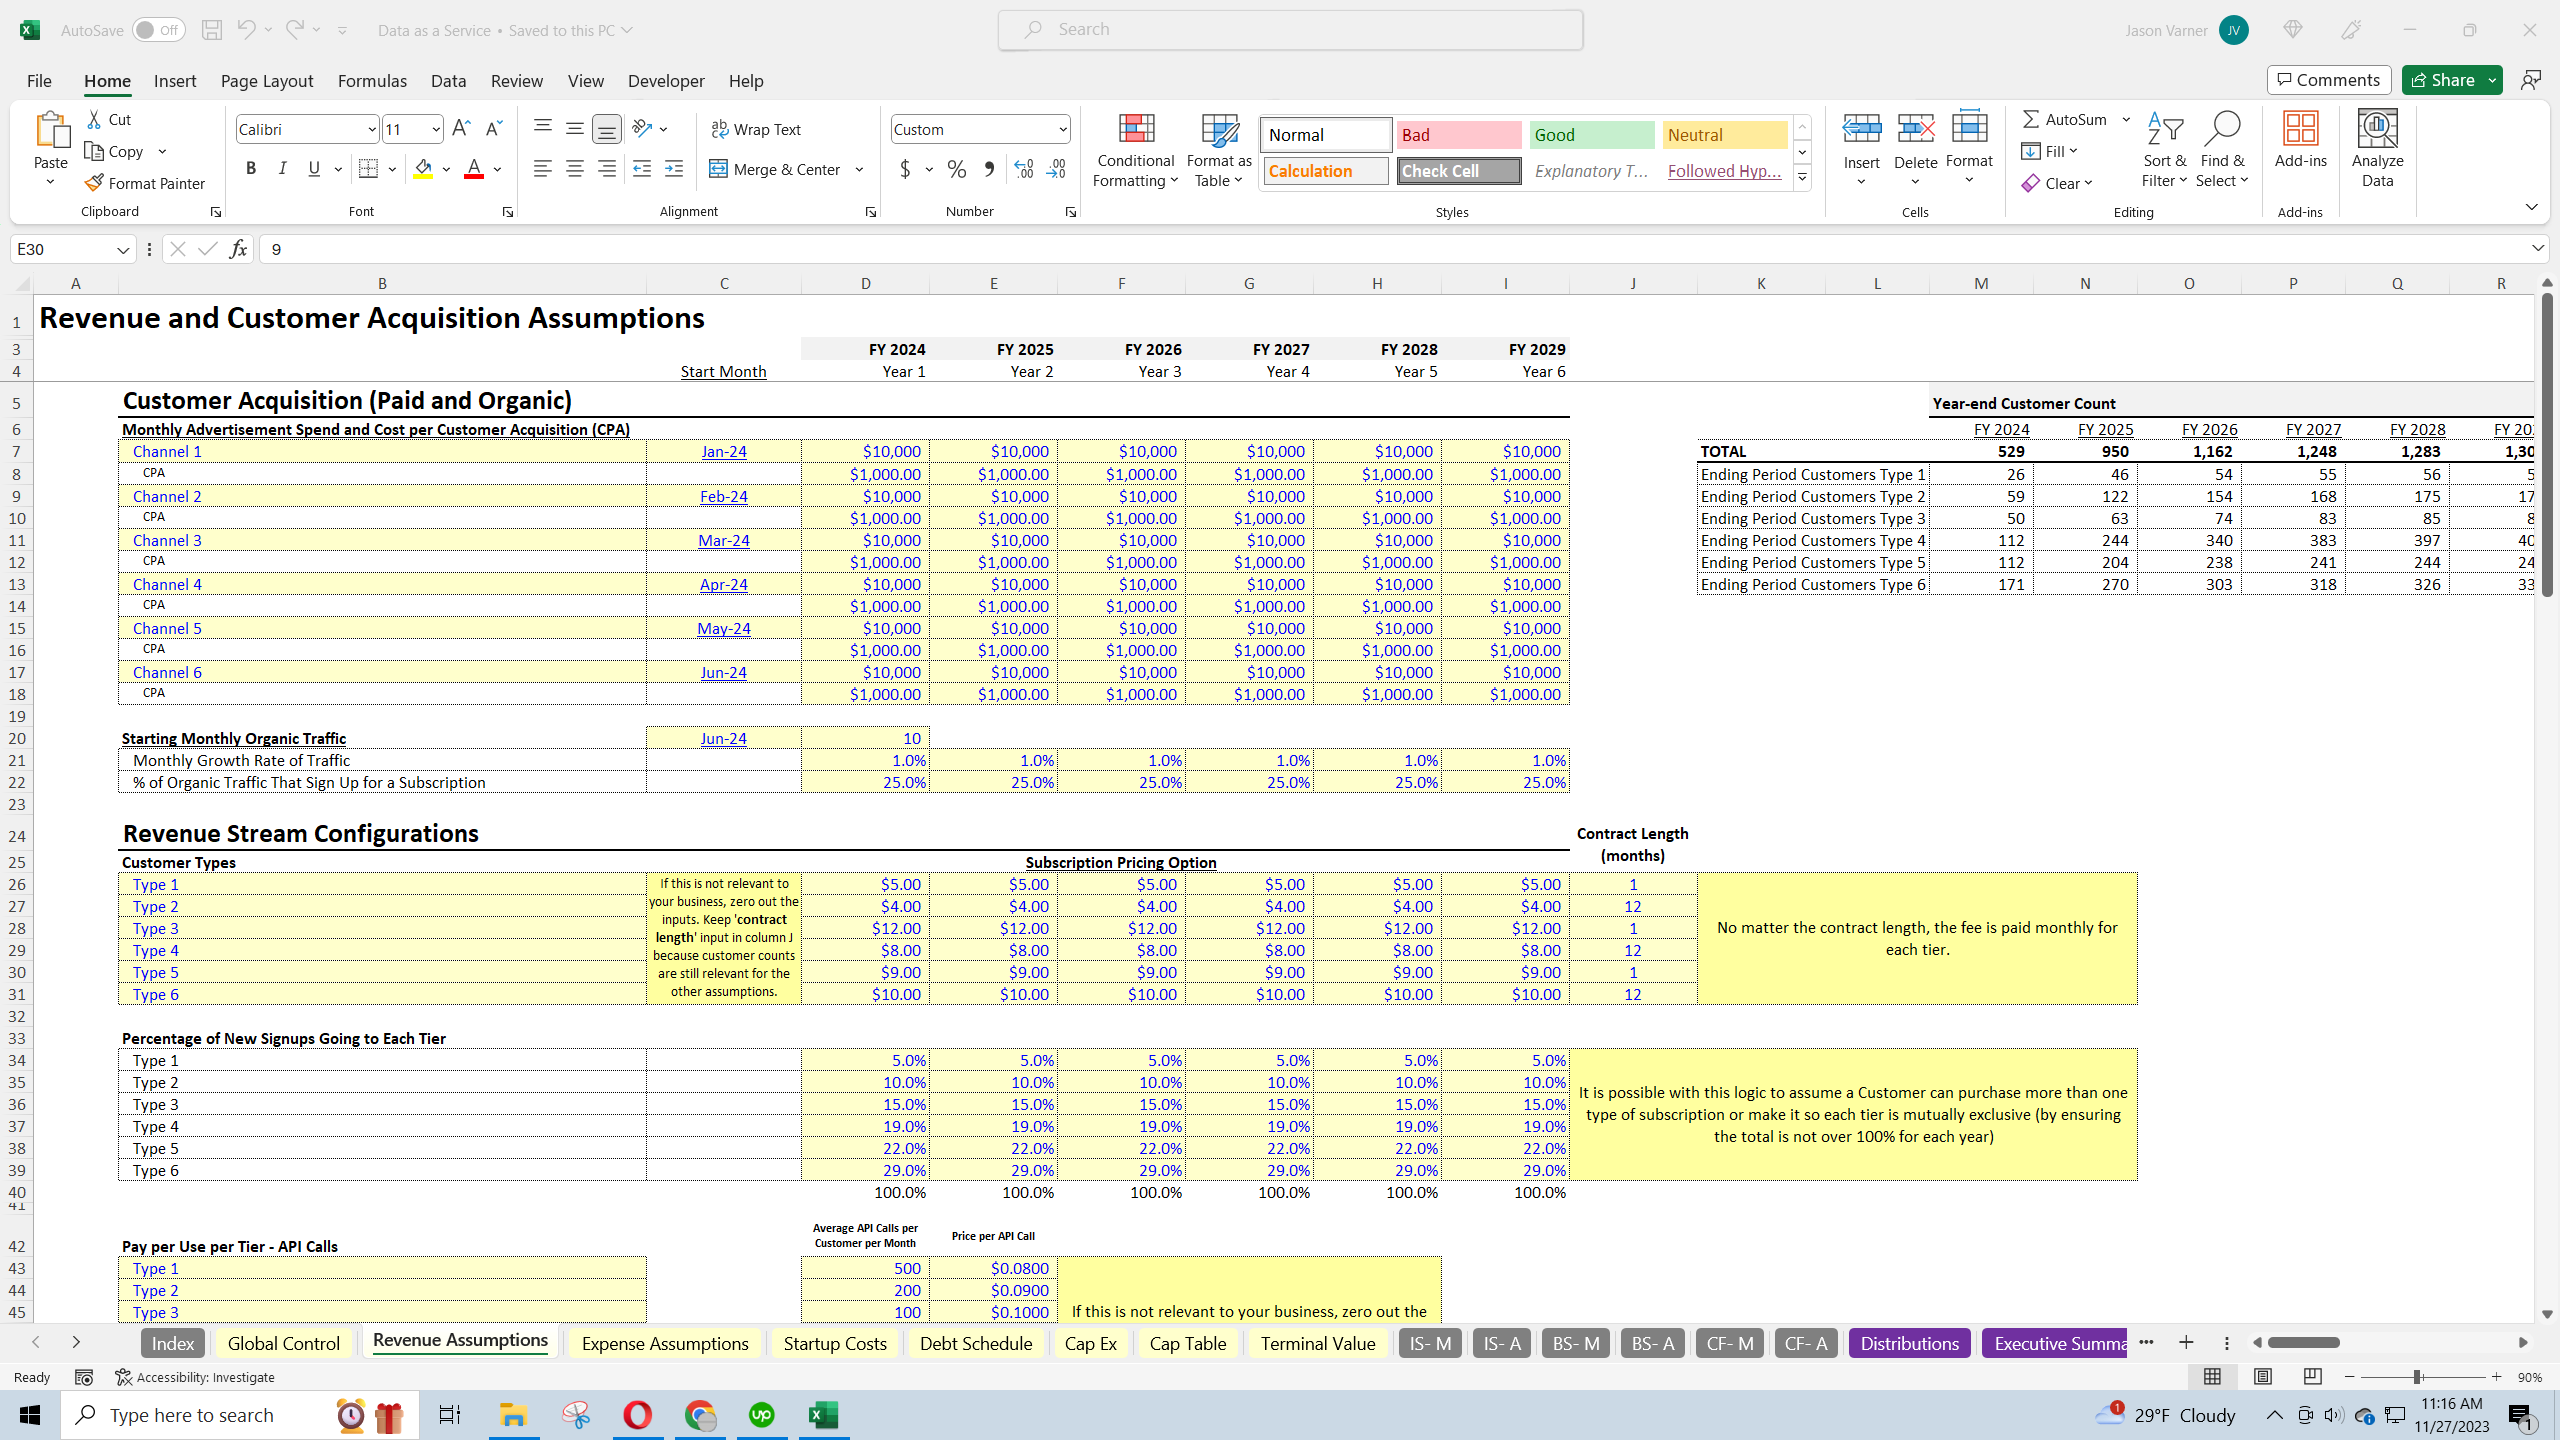
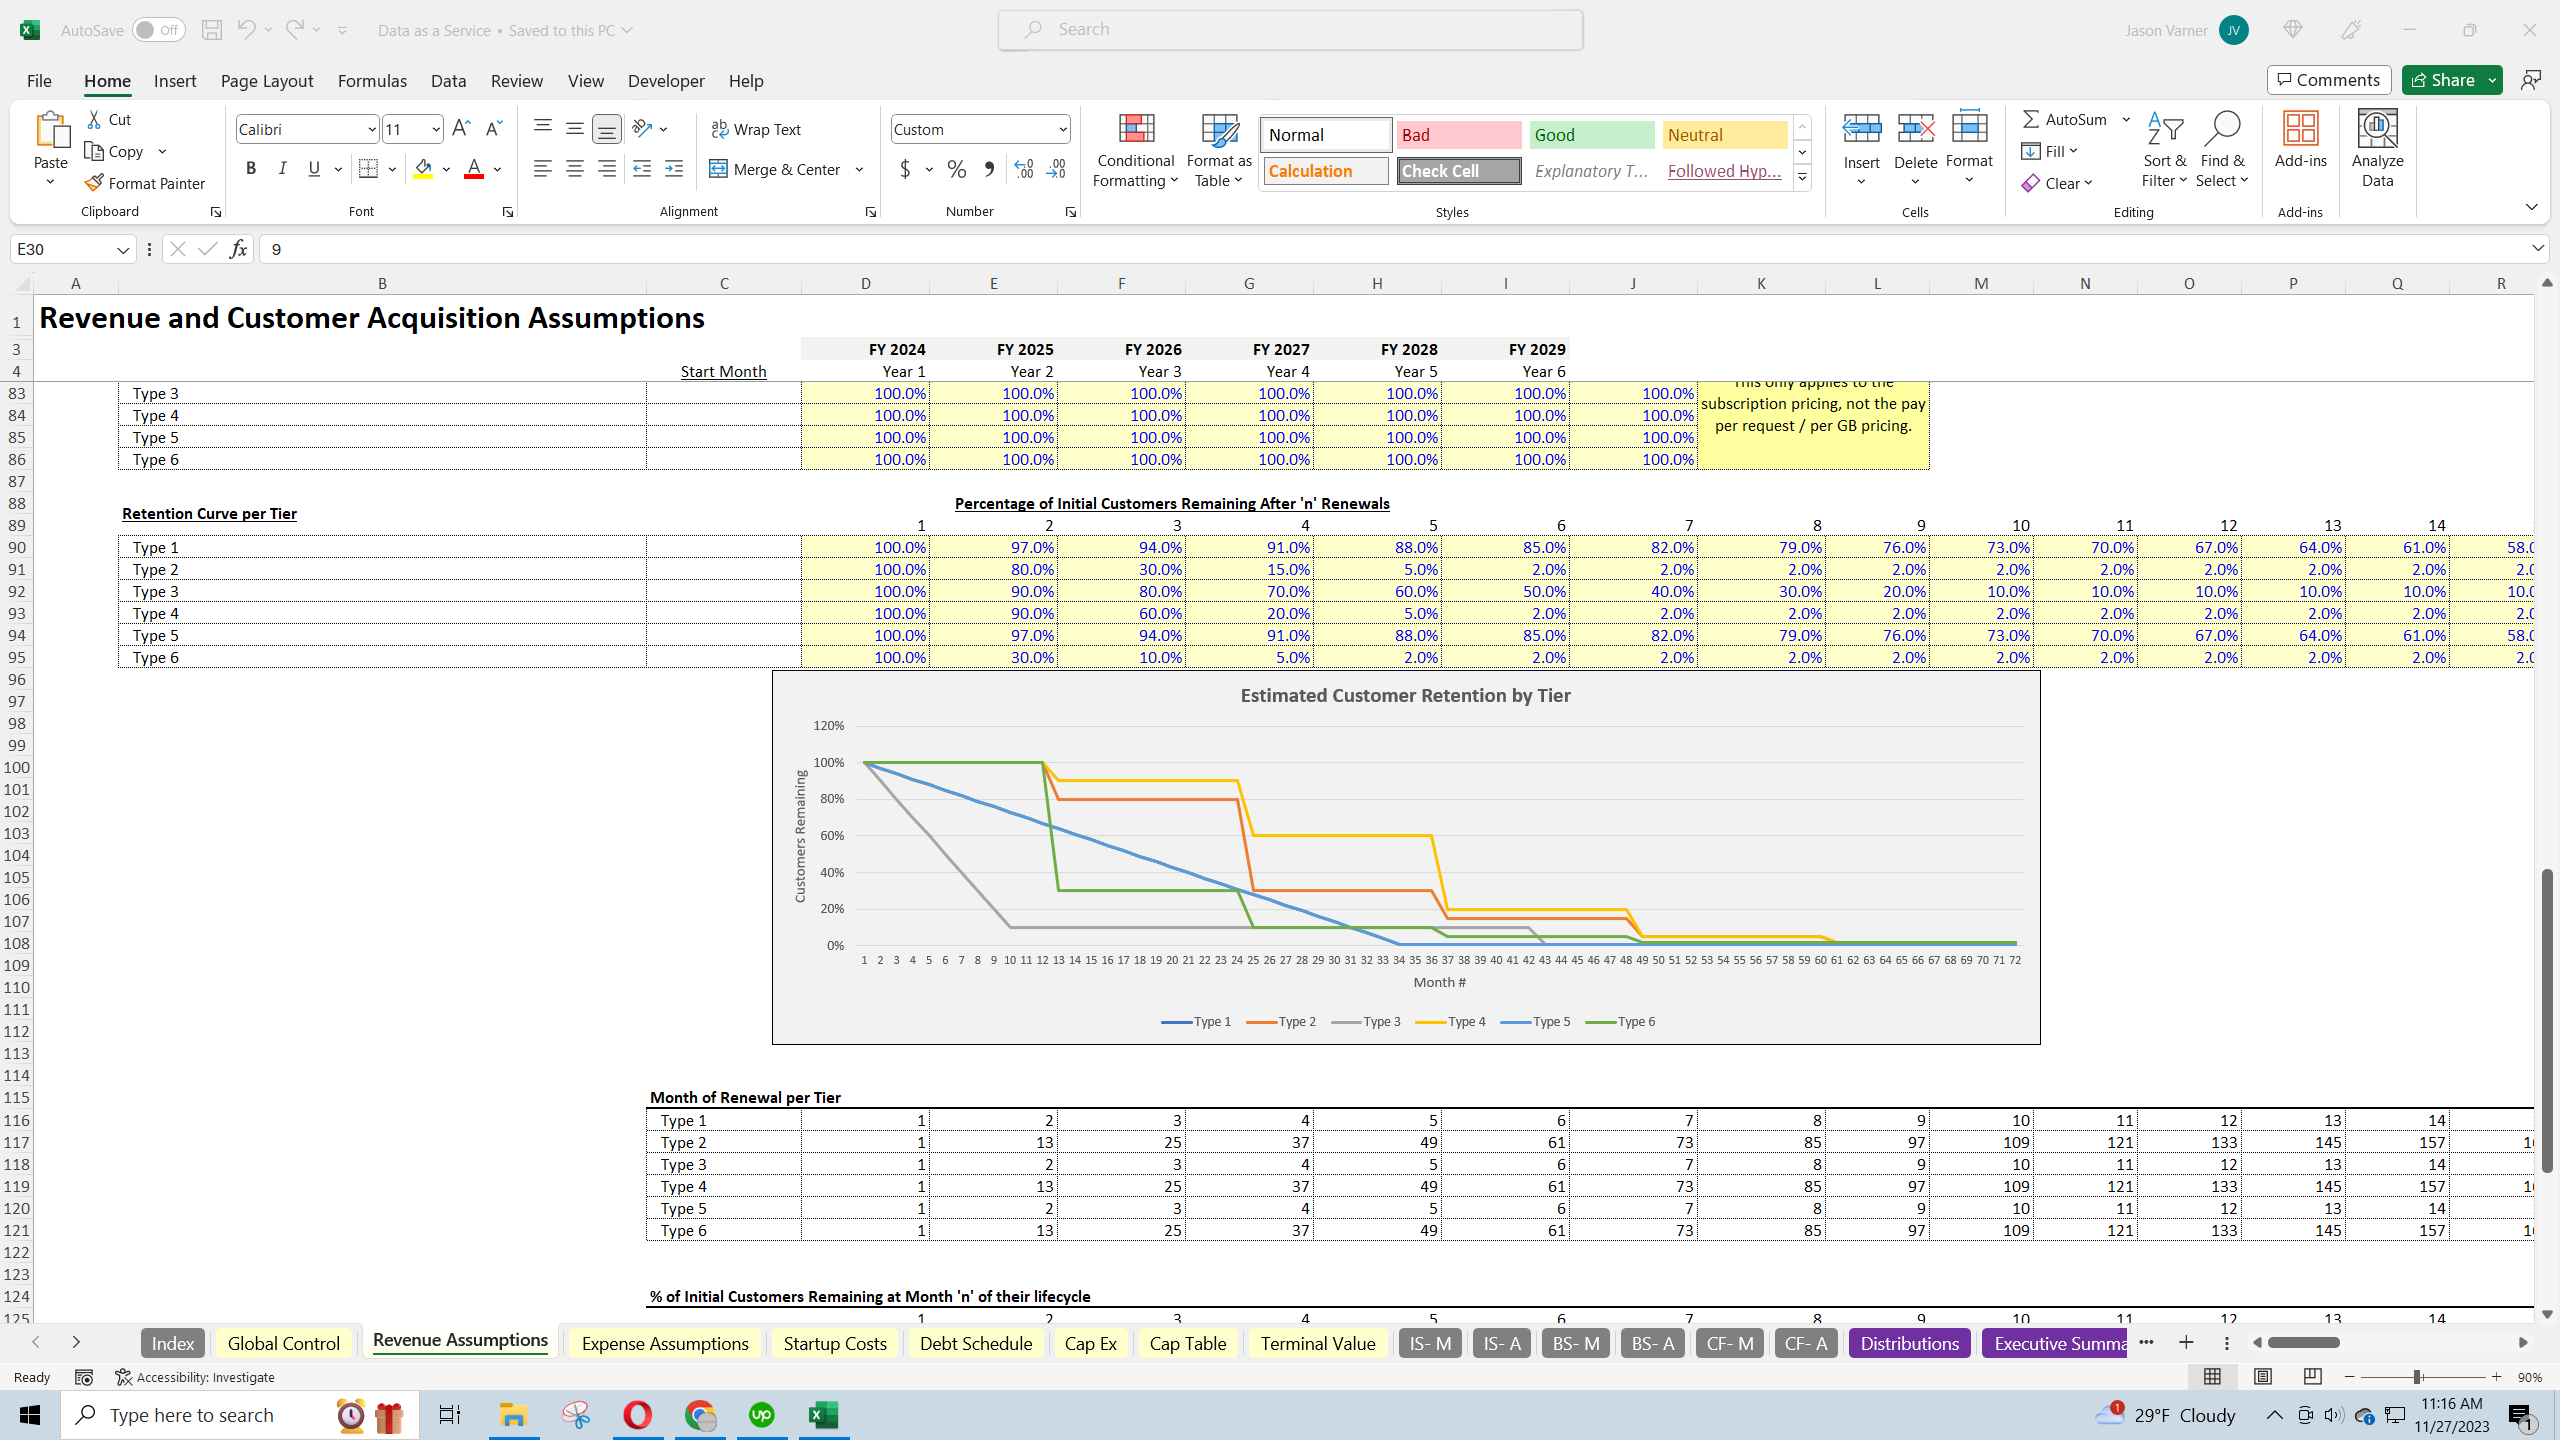
The entire model runs off customers that exist over time. There are multiple paid and free/organic acquisition channels that drive new customers as well as retention curves that drive how long a customer is active for. Everything has monthly granularity views and rolls up to annual views. There is a fully integrated 3-statement model that auto-updates when the bottom-up assumptions are adjusted.
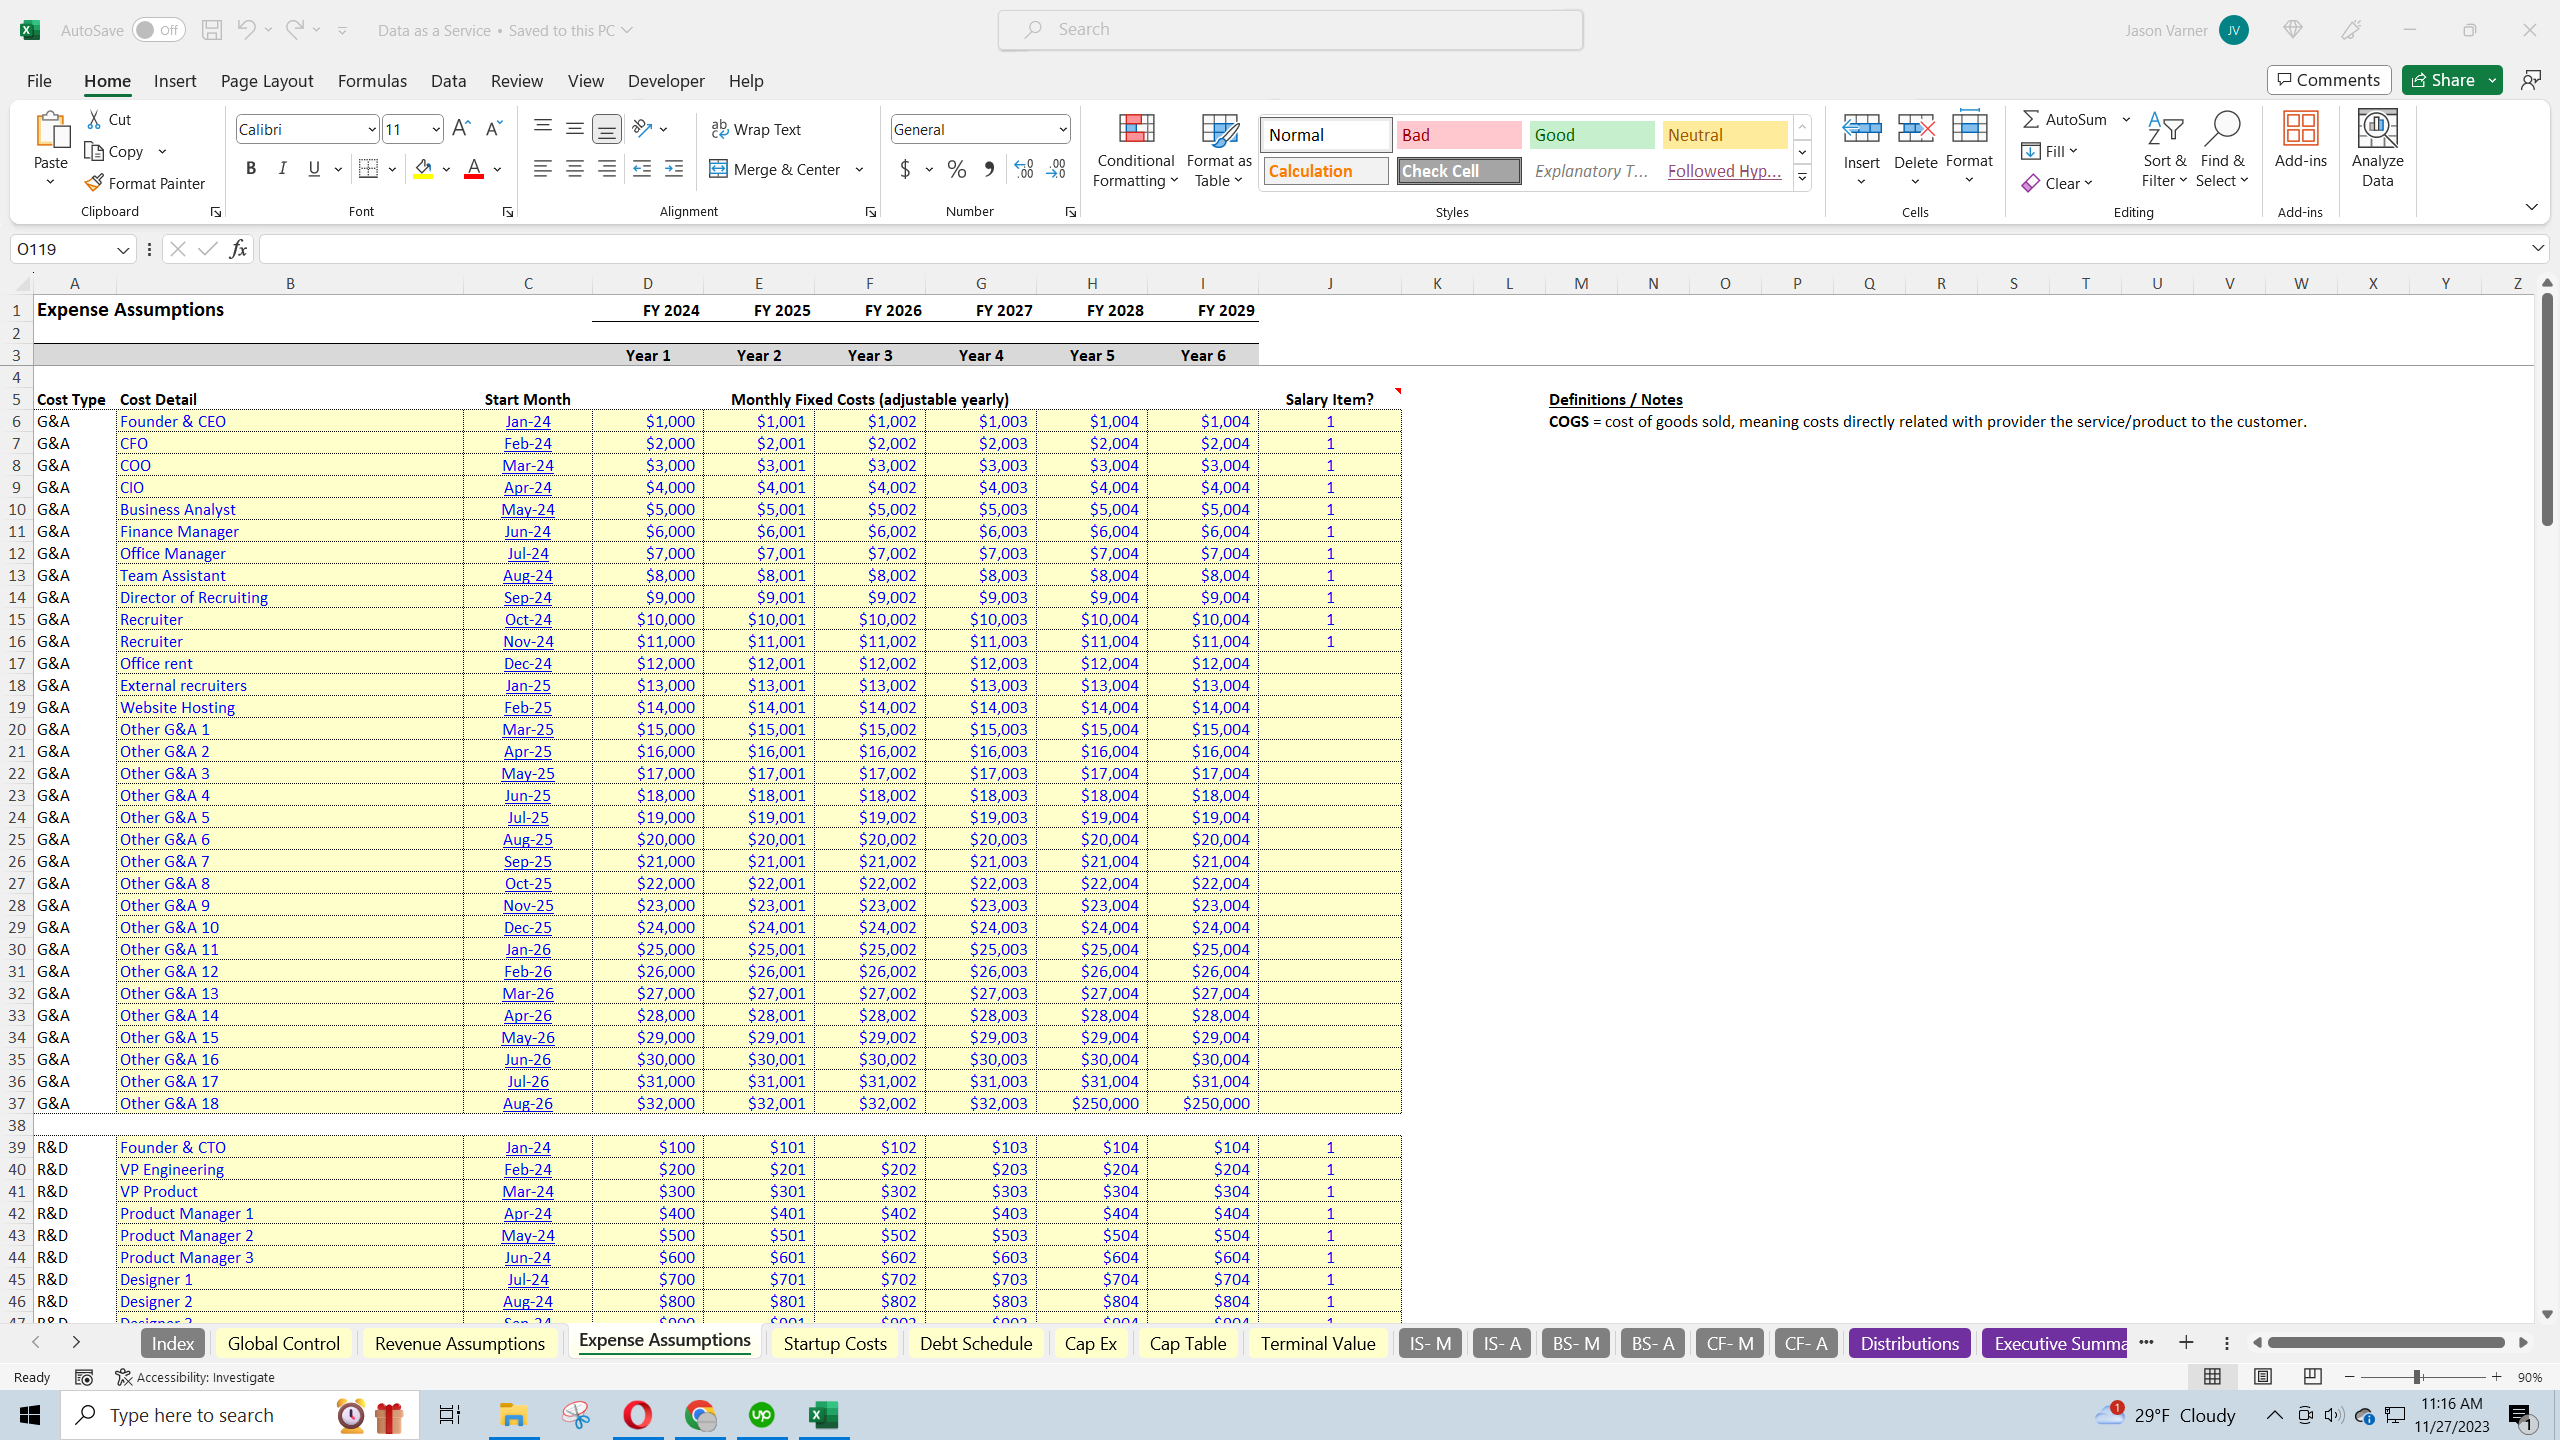
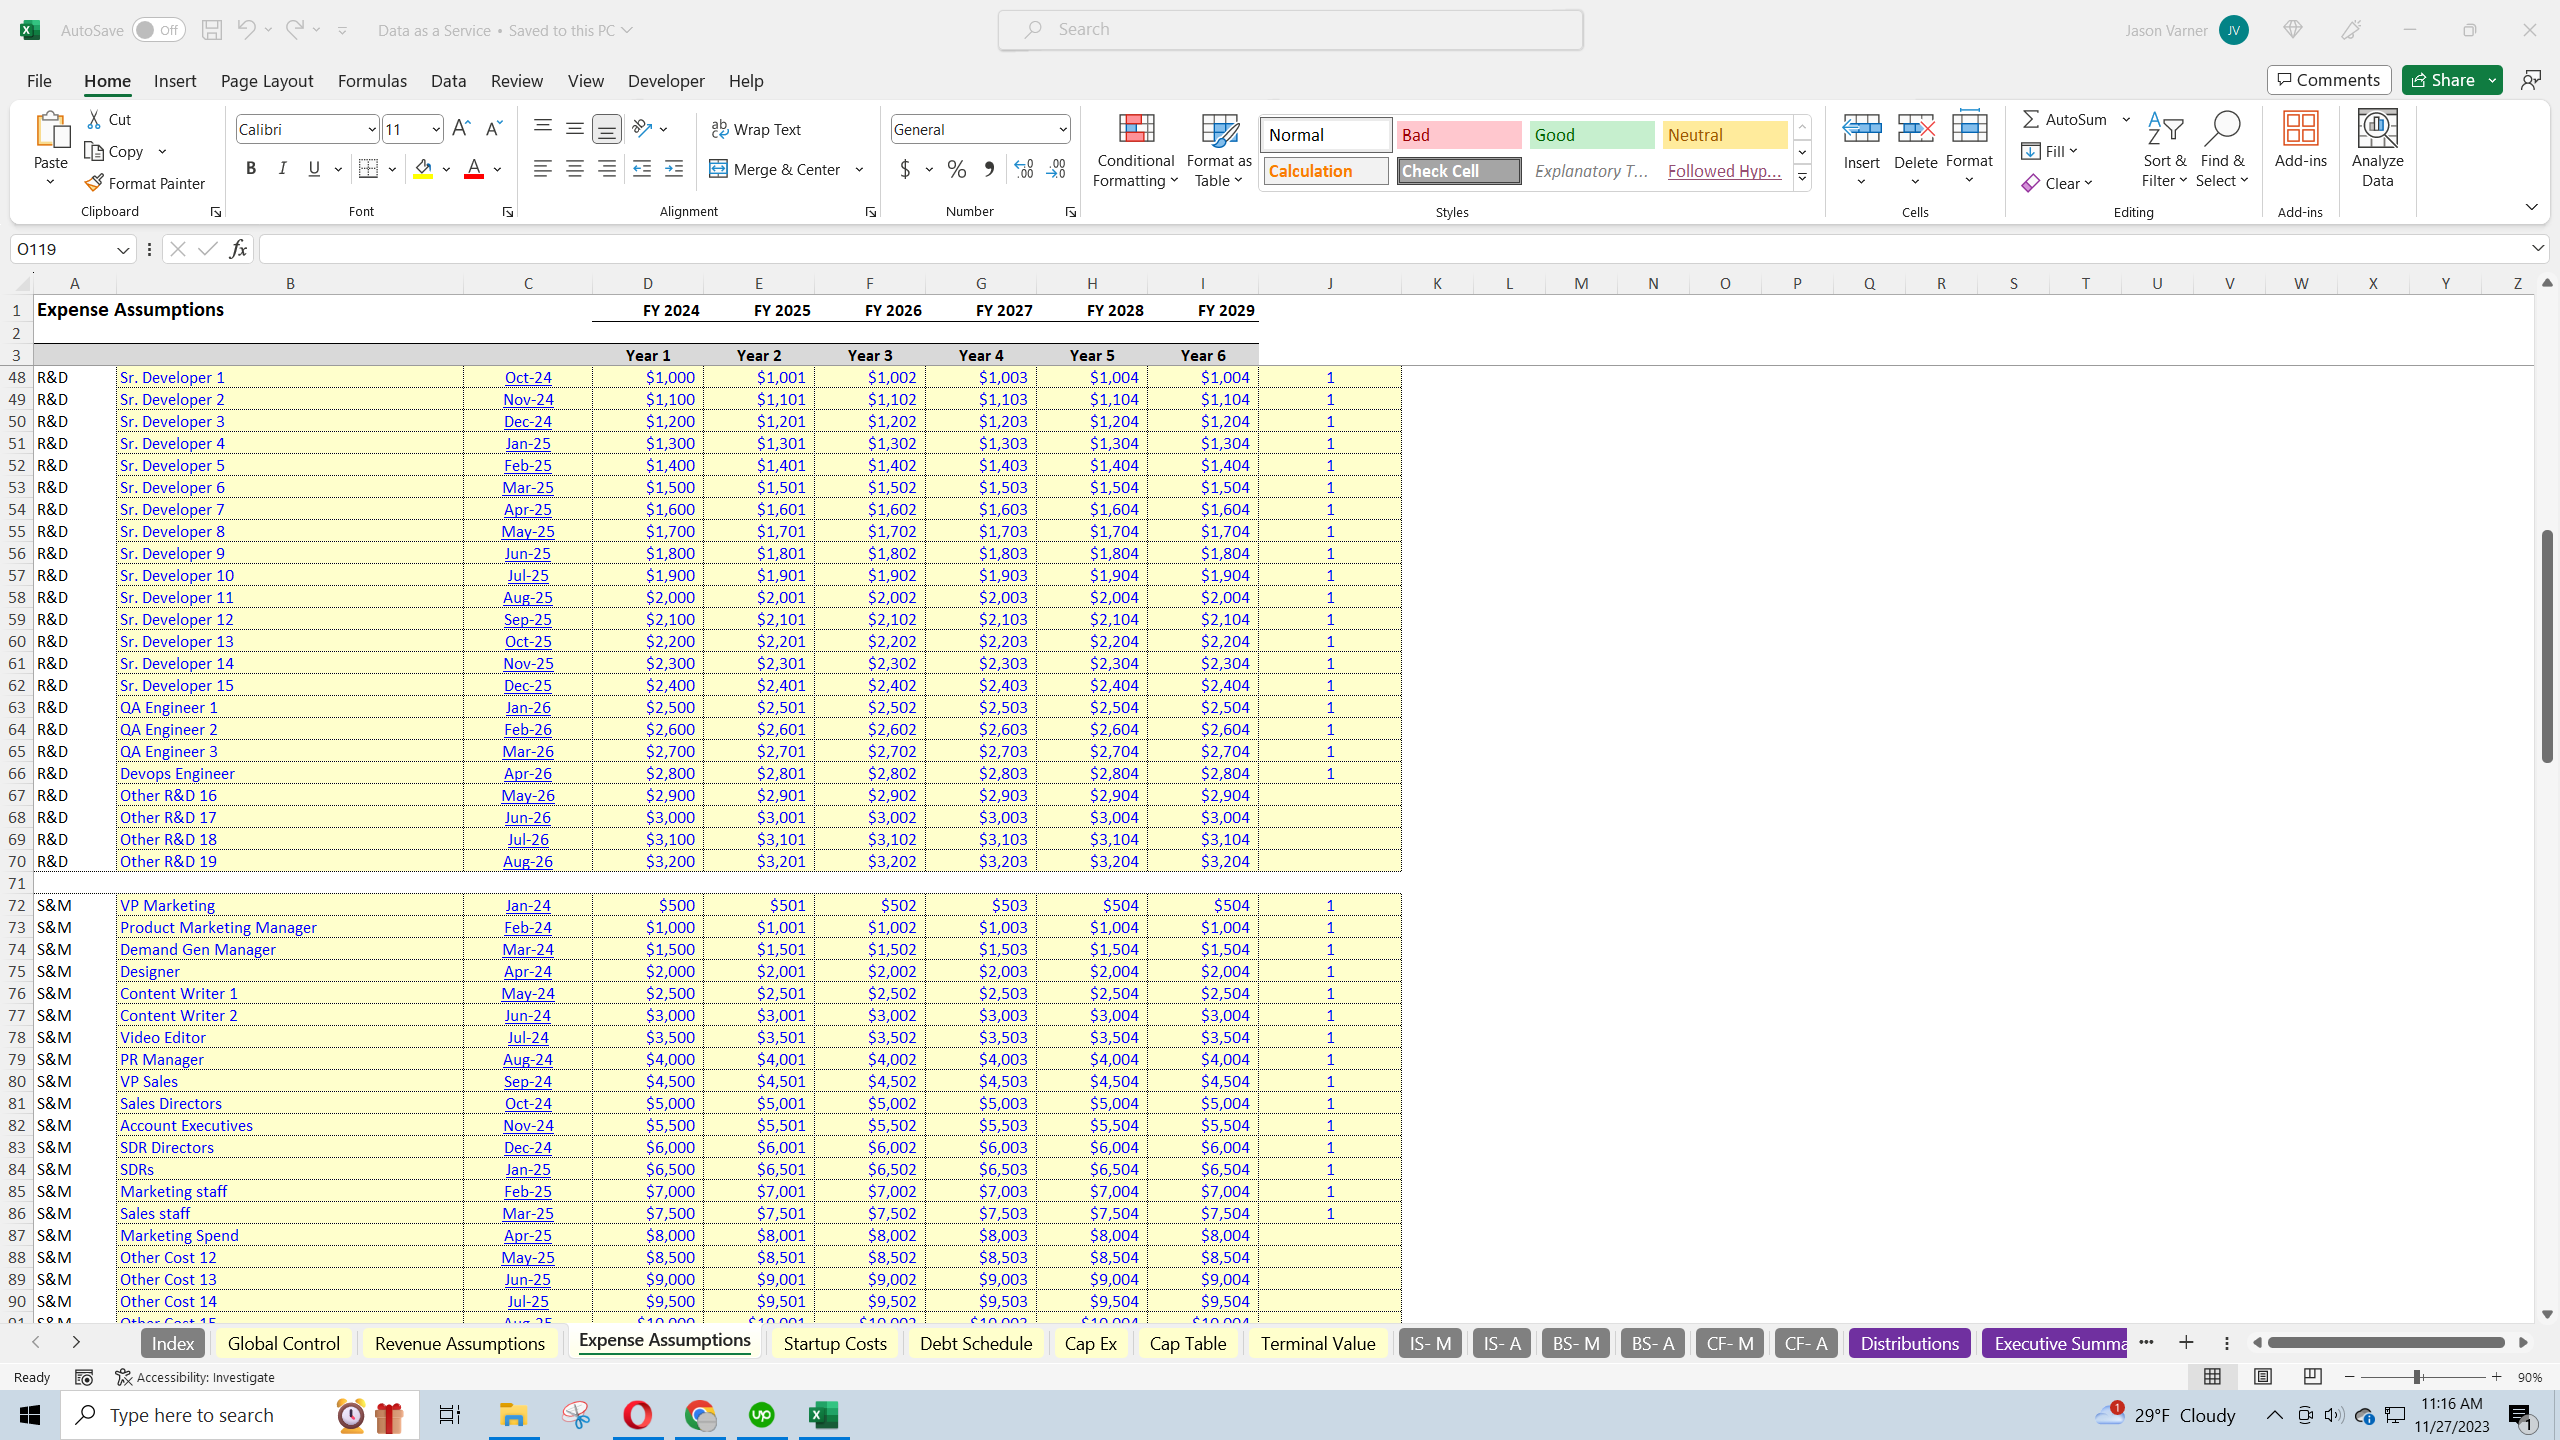
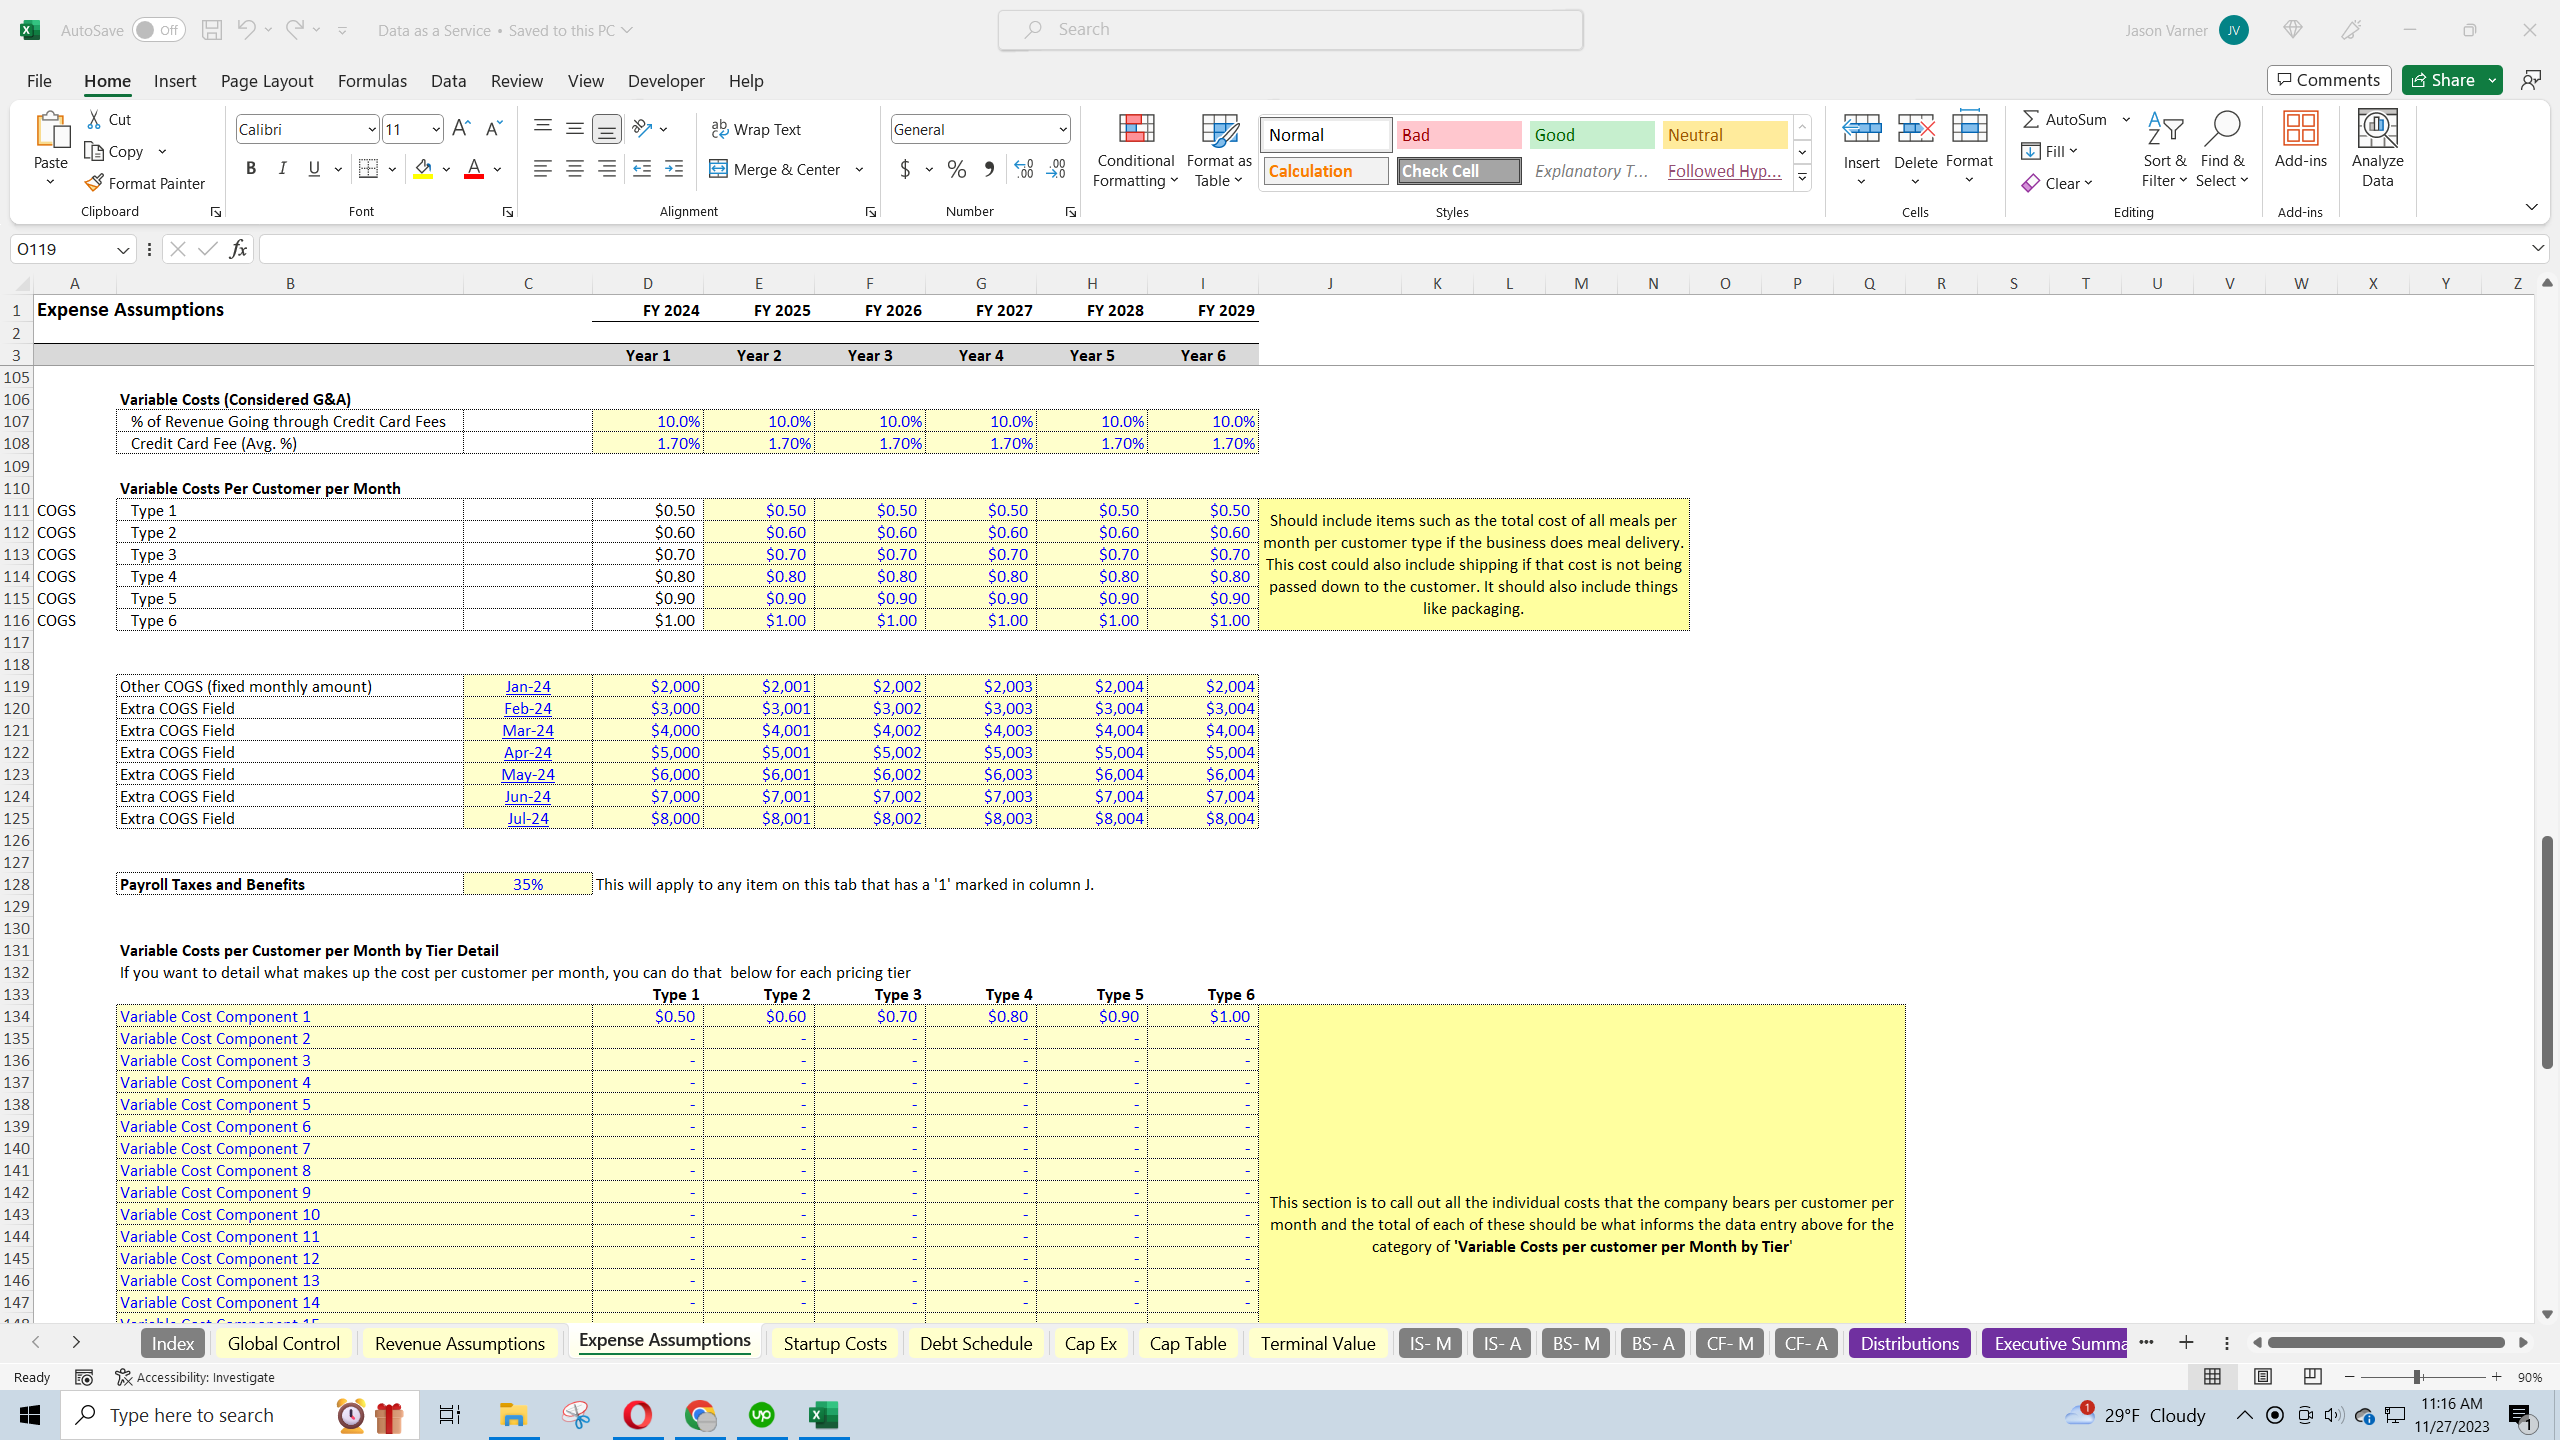
Your main variable costs will be any capex for infrastructure, data transmission costs (transferring data out of your network to customers), and possibly data acquisition costs. This model is a little unique in that you have a non-cash cost of goods sold items that hit as depreciation expense (infrastructure capital expenditures) so that is added back when driving down to actual cash flow. You don't want to double count the expenditure.
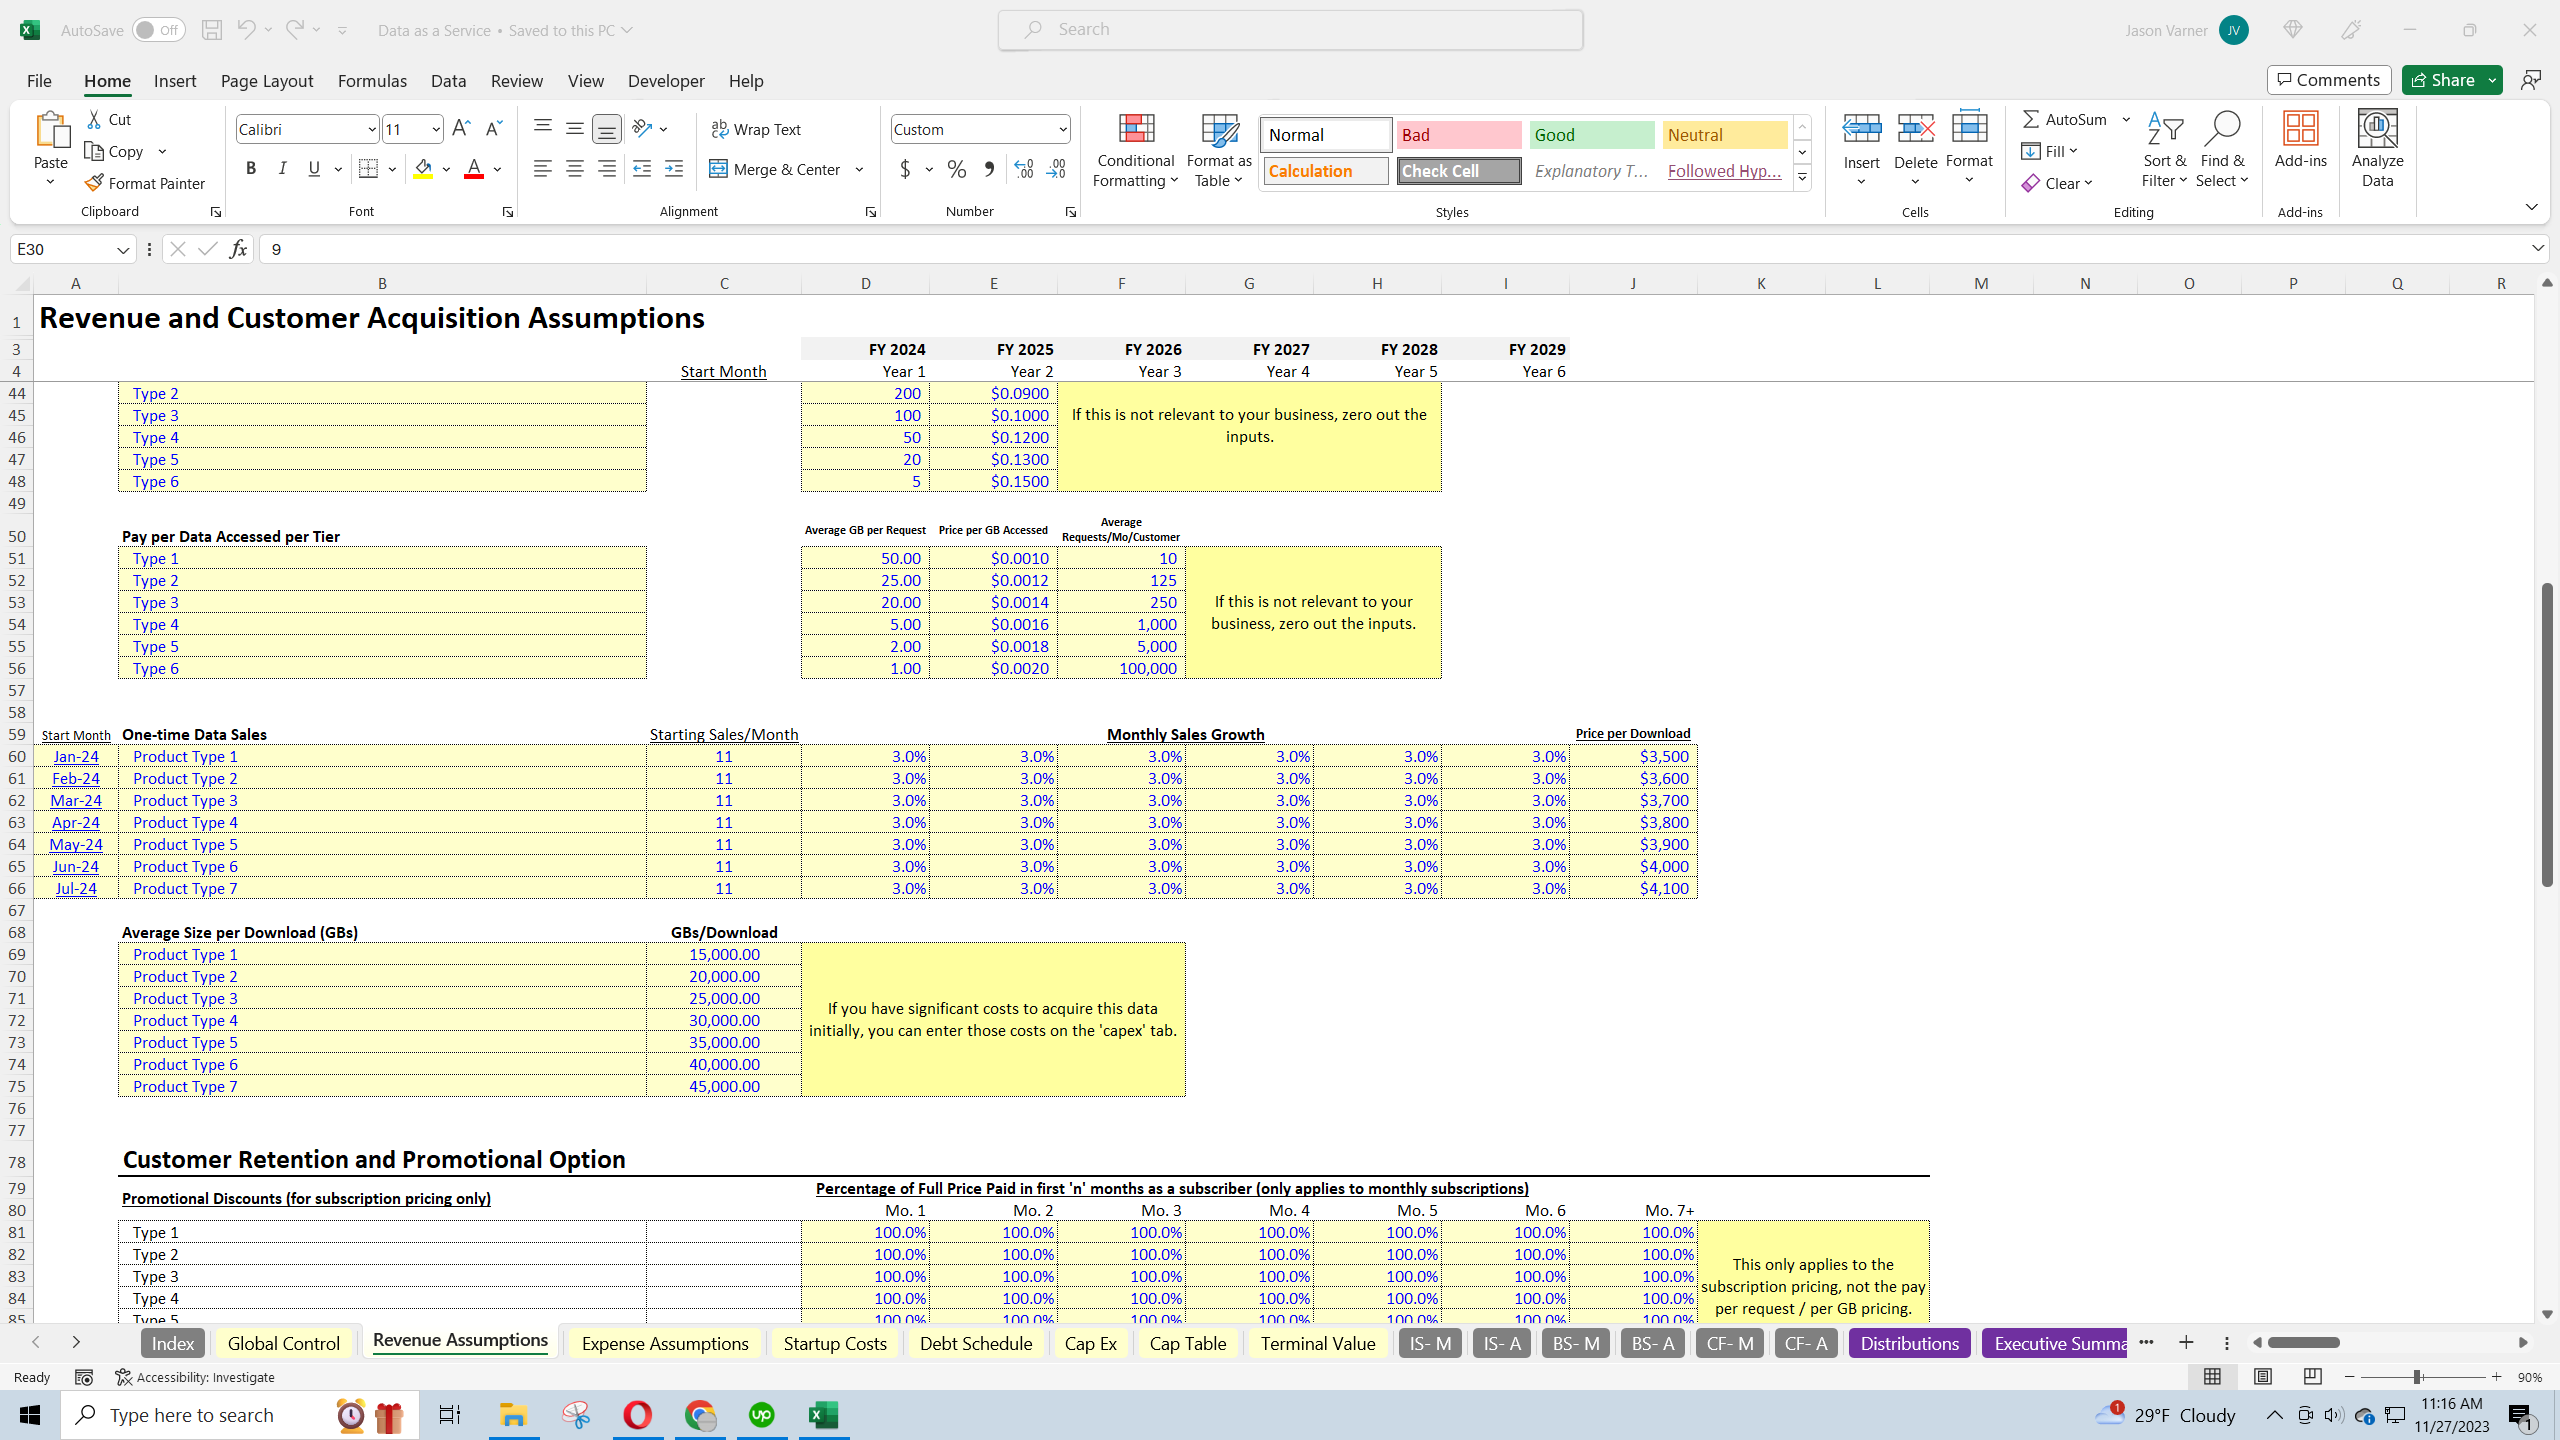
The model lets the user have multiple revenue streams and the first three look at the number of customers that exist (up to 6 customer tiers). They may be paying a monthly fee with monthly/annual or any length contracts or they may be paying per use. The pay per use is based on the number of API requests per customer per month and how much is being charged per request. There is also another option for revenue and that is pay per amount of data used, which drives off of average GBs downloaded per month per customer and cost per GB downloaded. Finally, there is also an option for one-time data sales, which doesn't look at the number of customers that exist over time, but rather the number of downloads per month, average GBs per download, and average price per download (7 download options).
If you want to denote the data in a different unit of measure other than GBs, that is completely fine. Simply adjust the labels and make sure your price and units match the unit of measure you are using.
In terms of financial analysis, the model has a DCF Analysis, IRR, NPV, and Equity Multiple output for the project as a whole and for the investor / owner contribution pools depending on who is financing the initial startup costs and any operating burn. There are also lots of visualizations for KPIs like average customer lifetime value, average customer acquisition costs, average months to pay back customer acquisition cost, and LTV to CaC ratio.
The model can be configured to run for up to 72 months and includes an option for terminal value based on a trailing 12-month revenue multiple. There is also an option to finance some of the startup costs with debt and any remaining balance is automatically paid back at the forecasting end month if a terminal value is selected as being displayed.
Got a question about the product? Email us at support@flevy.com or ask the author directly by using the "Ask the Author a Question" form. If you cannot view the preview above this document description, go here to view the large preview instead.
TOPIC FAQ
What revenue models should I consider when building forecasts for a Data-as-a-Service startup?
Common DaaS revenue models include recurring subscriptions (monthly/annual contracts), pay-per-use pricing based on API requests, pay-per-GB data consumption, and one-time data sales. The product overview specifically models monthly subscriptions, API-request fees, GB-download fees, and up to 7 one-time download options, and supports up to 6 customer tiers.What are the main cost drivers for a DaaS business that I need to model?
Primary cost drivers include infrastructure capital expenditures, data transmission costs (egress), and potential data acquisition costs. Infrastructure capex is reflected as a non-cash cost through depreciation that is added back when calculating cash flow, per the model’s accounting treatment of capex and depreciation.How should I model customer acquisition and retention for monthly forecasts?
Use multiple paid and organic acquisition channels to drive new customers and apply retention curves to model customer lifetimes. The overview describes a cohort-driven approach where customer counts evolve monthly and roll up to annual views, enabling metrics like average customer lifetime value and months-to-payback CAC.What investor-return outputs are important for DaaS forecasts and how are they handled?
Key investor-return outputs include discounted cash flow (DCF), internal rate of return (IRR), net present value (NPV), and equity multiple. The described model produces those outputs for the project overall and for owner/investor contribution pools, and it includes an option for terminal value based on a trailing 12-month revenue multiple.How do I incorporate debt financing and terminal value into a DaaS forecast?
You can model debt financing for some startup costs and specify repayment terms; if a terminal value is selected, any remaining balance can be paid from the terminal proceeds. The model offers an option for terminal value based on a trailing 12-month revenue multiple and automated end-of-forecast repayment.What should I look for when choosing a downloadable financial model for a DaaS startup?
Look for monthly-granularity projections, an integrated 3-statement model that auto-updates with bottom-up assumptions, configurable revenue streams (subscription, per-request, per-GB, one-time sales), KPI visualizations, and a forecasting horizon sufficient for your planning—this model supports up to 72 months.Can I change the unit of measure if my data is not in GBs?
Yes; you can relabel the unit of measure and ensure price and unit assumptions match the new measure. The overview explicitly states you can substitute another unit for GBs by adjusting labels and matching prices and units in the inputs.Which KPIs matter most for monitoring a DaaS business in a financial model?
Important KPIs include average customer lifetime value (LTV), average customer acquisition cost (CAC), months to pay back CAC, and the LTV-to-CAC ratio. The model includes visualizations for these KPIs to track customer economics and acquisition payback metrics.Source: Best Practices in SaaS, Data Monetization, Integrated Financial Model Excel: Data-as-a-Service Startup Financial Model Excel (XLSX) Spreadsheet, Jason Varner | SmartHelping
ABOUT THE AUTHOR
I graduated in 2011 with a Bachelor's degree in Accounting and began my career as a financial analyst at a small chain of auto repair shops. After gaining valuable experience, I launched my own practice specializing in real estate underwriting, later expanding into general business modeling.
I honed my spreadsheet modeling expertise by completing over 400 projects on Upwork with a 100% success
... [read more]
Ask the Author a Question
You must be logged in to contact the author.
