

Startup Freemium SaaS Financial Model: 5 Year – Excel XLSX
Excel (XLSX)
VIDEO DEMO
SAAS EXCEL DESCRIPTION
Recent Updates: 3-statement model integration, cap table, improvement in global assumption layout, dynamic capex schedule. A freemium business model can be modeled with a few basic levers.
This template makes it easy to configure and forecast the timing, pricing, and resulting financial forecast of a freemium strategy. Simply, this means you have some source of traffic, offer that traffic a free service and upsell a paid service and/or upsell an ad free service for better user experience.
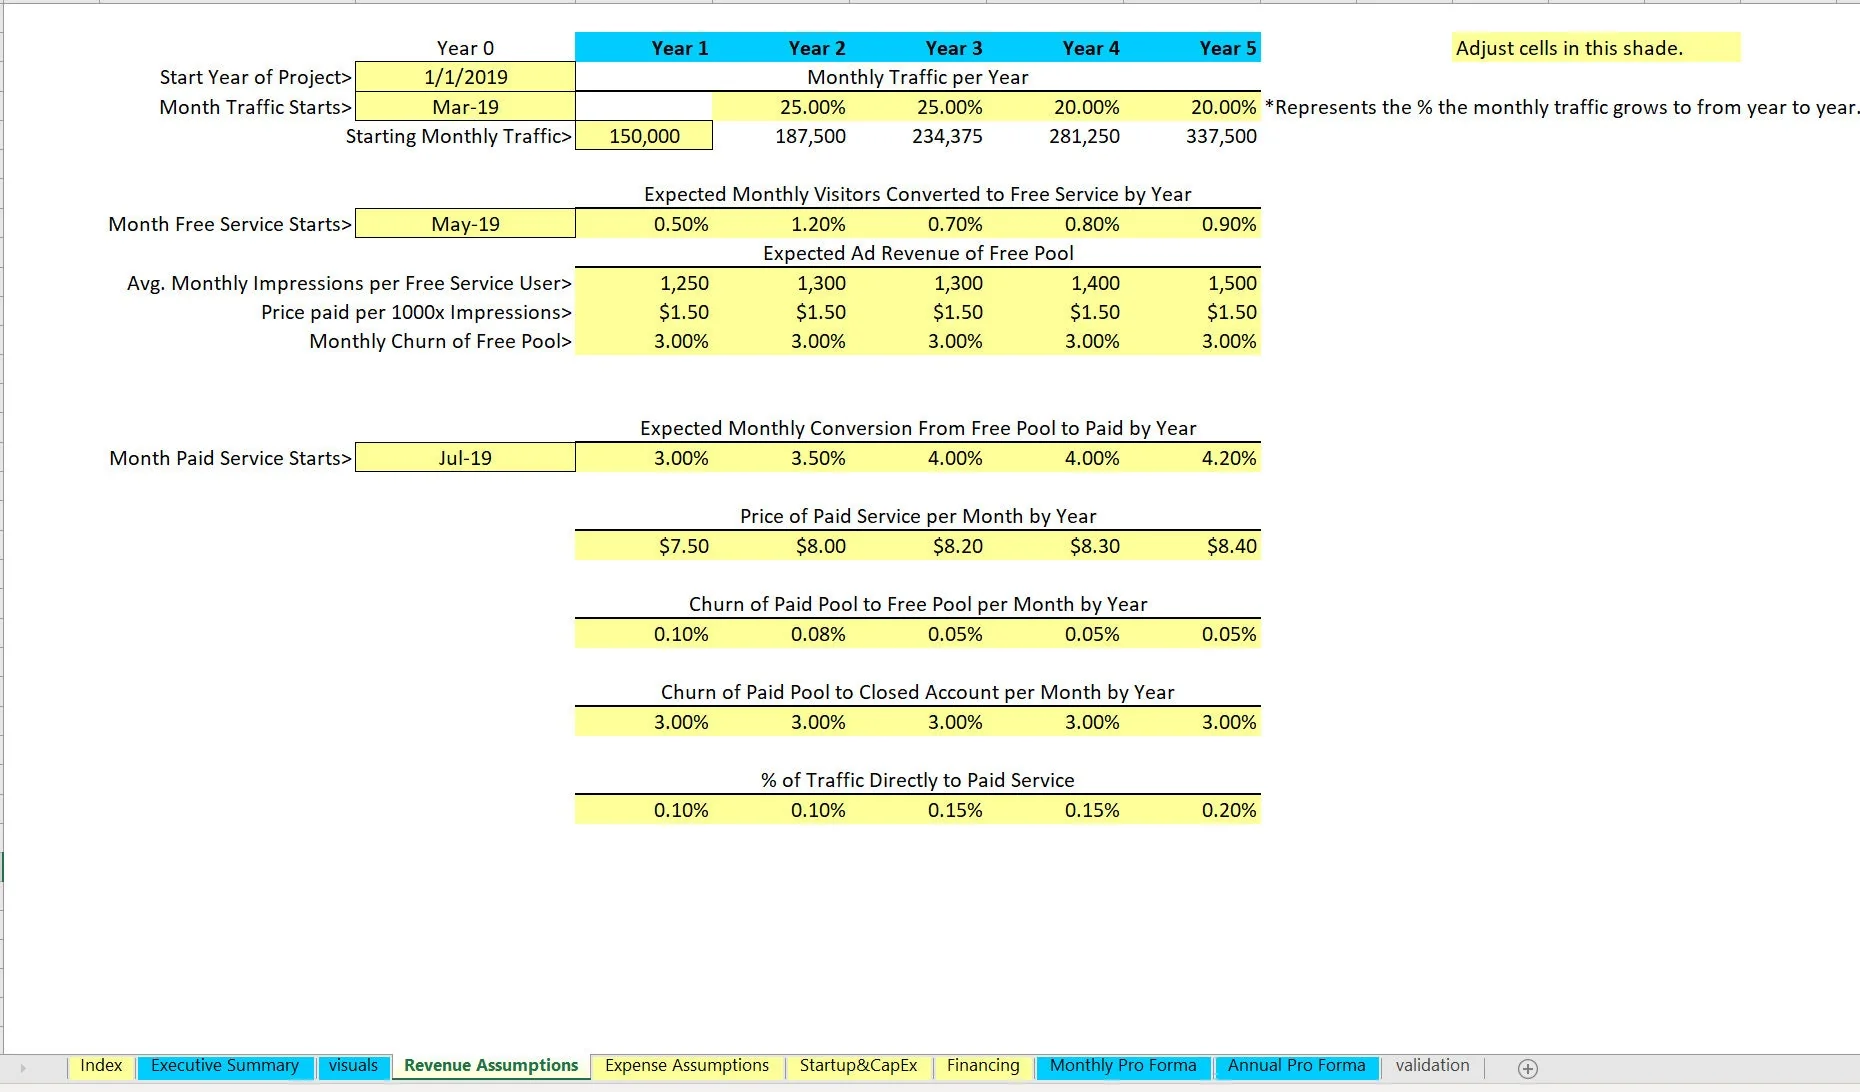
The revenue drivers adjust over 5 years and include:
• Start year of model
• Start month of traffic
• Start month freemium service begins
• Start month paid service begins
• Starting monthly traffic and CAGR per year
• Percentage of visitors converted to the free service
• Expected impressions and earnings per impressions of per ads shown to the free pool -Average churn of free pool
• Percentage of free user pool converting to paid per month
• Monthly price of paid service
• Churn of paid pool moving back down to free
• Churn of paid pool closing account
• Percentage of traffic signing up to paid service directly
Expense assumptions are based on a dynamic fixed cost schedule that can be defined per category (G&A, S&M, R&D, and/or COGS) as well as plenty of slots per category with varying start month and monthly cost over 5 years. COGS can be defined by a cost per user per month on average or a fixed percentage of revenue.
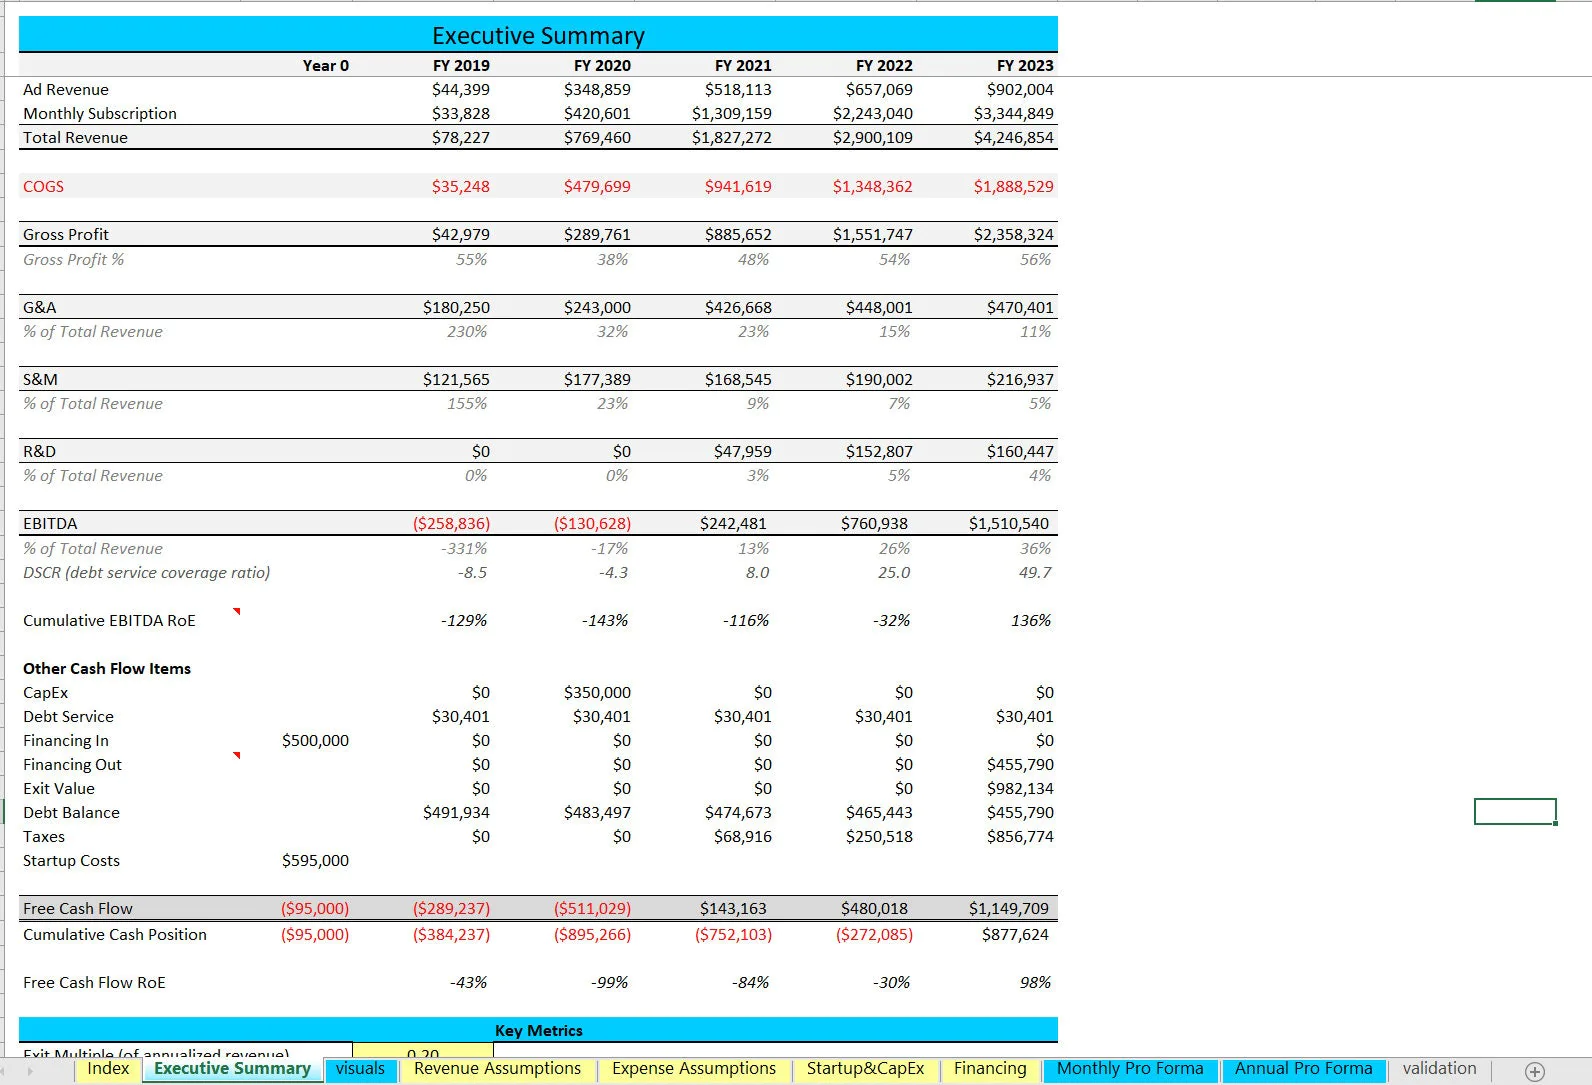
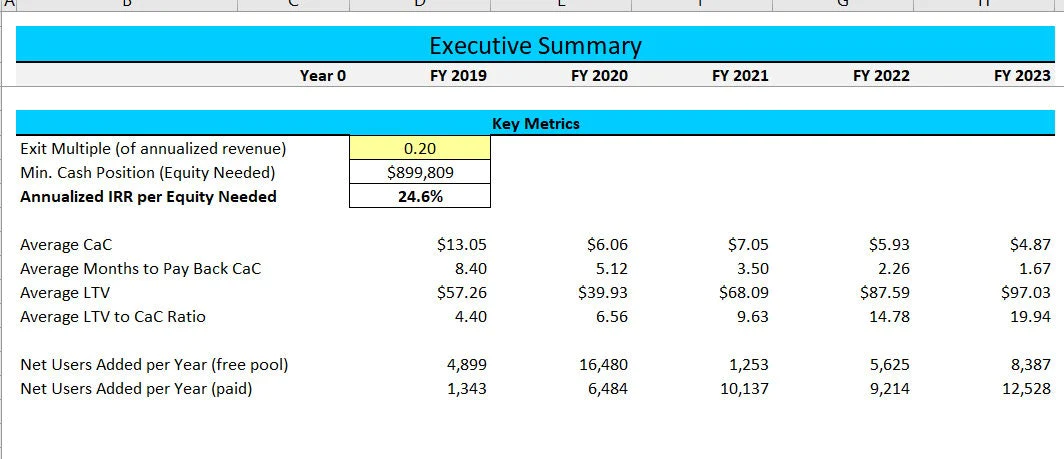
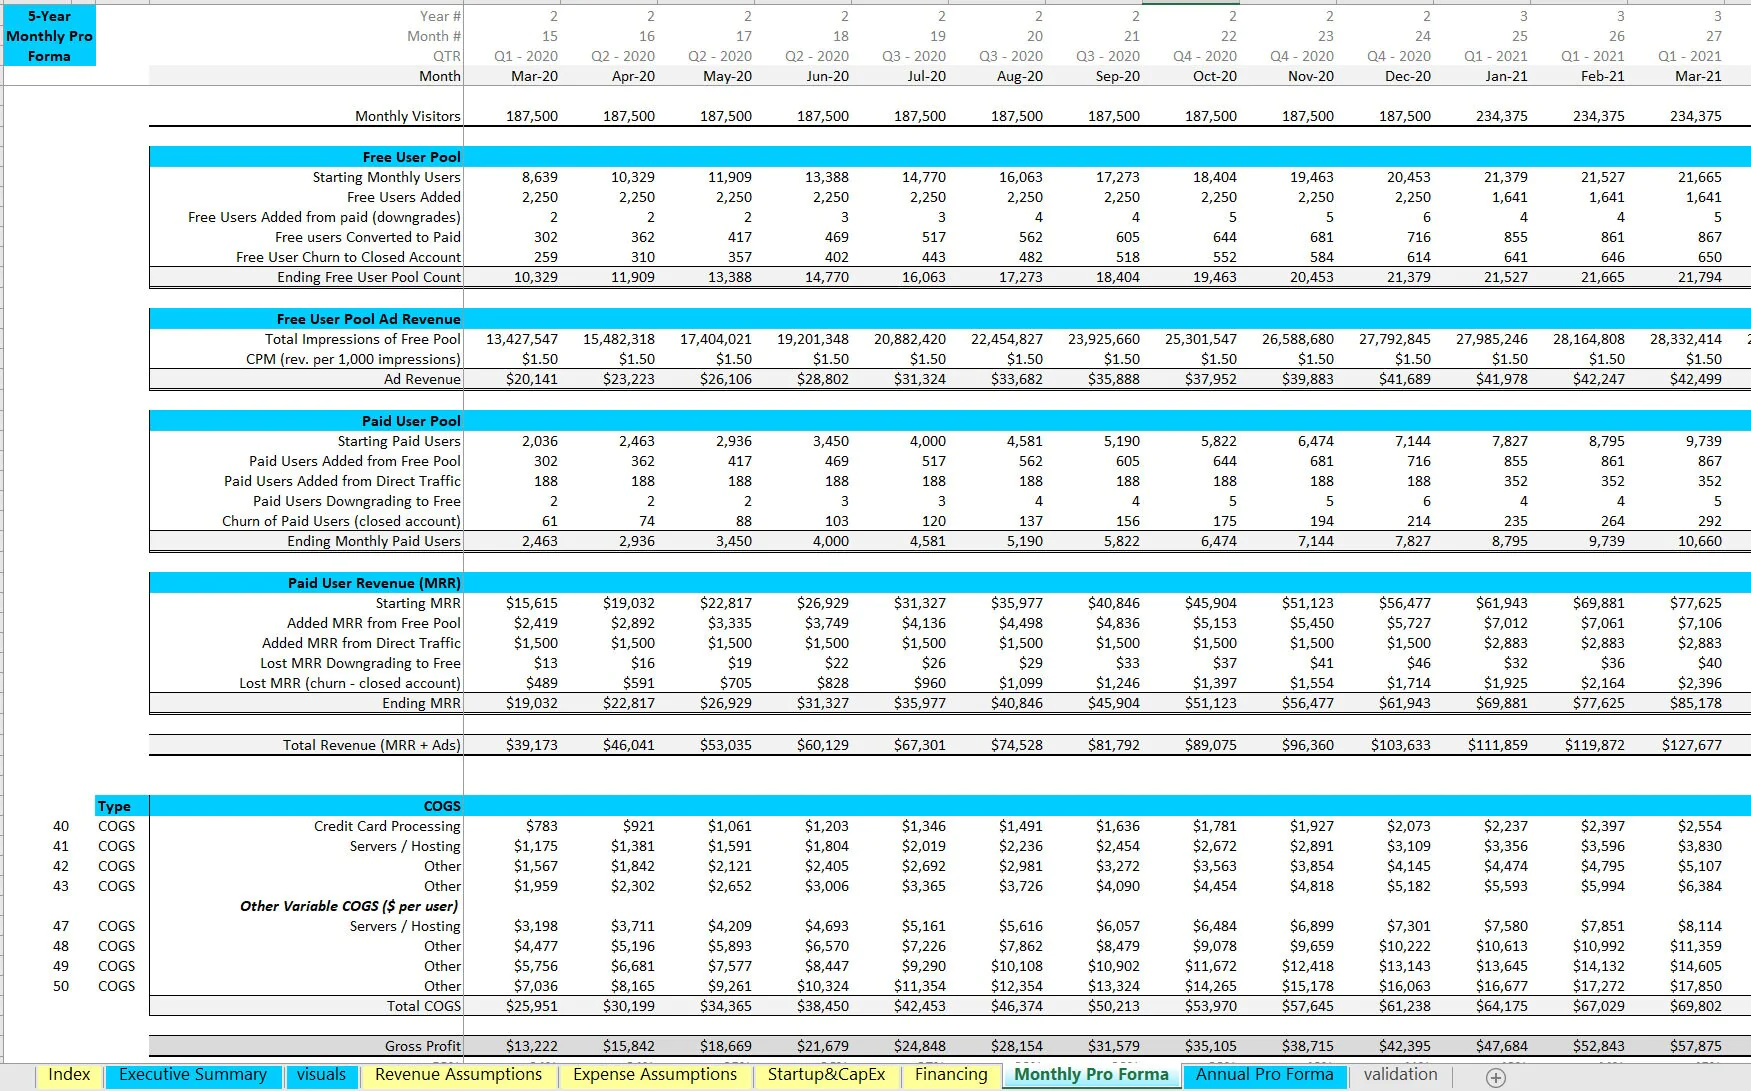
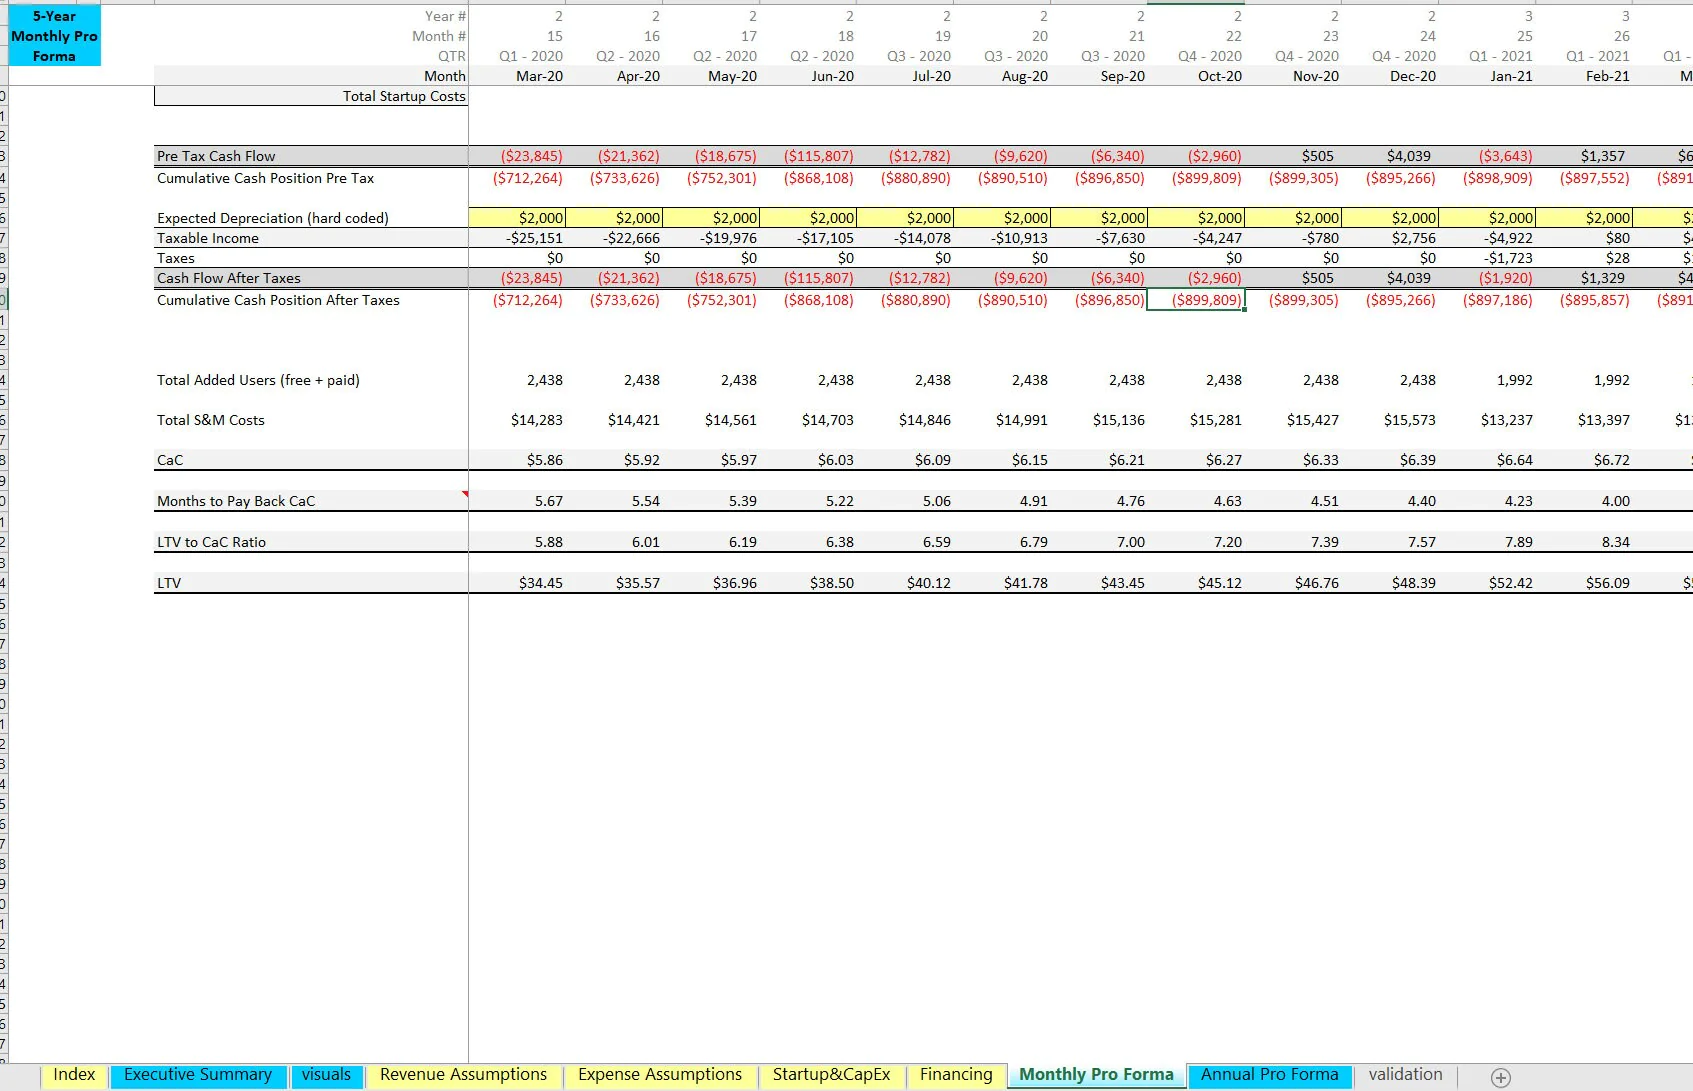
Final output reports include a monthly and annual pro forma that drives to operating income, taxable income, net income after taxes, and cash flow after taxes. Additionally, there is a high level annual summary of key financial line items and cash flow items as well as KPI's.
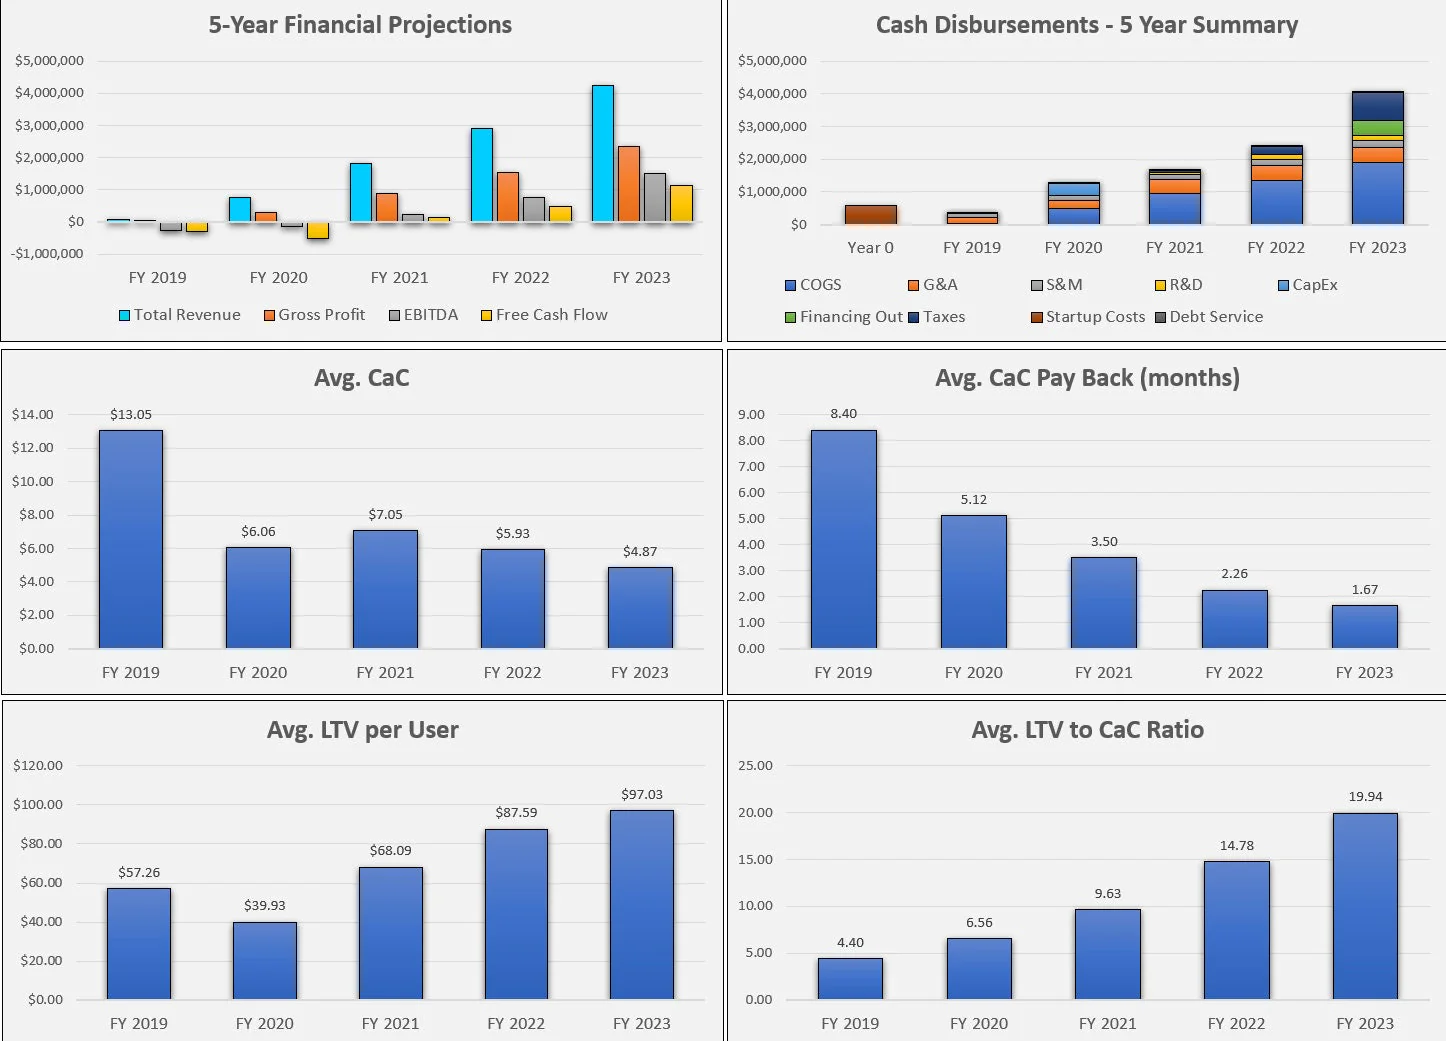
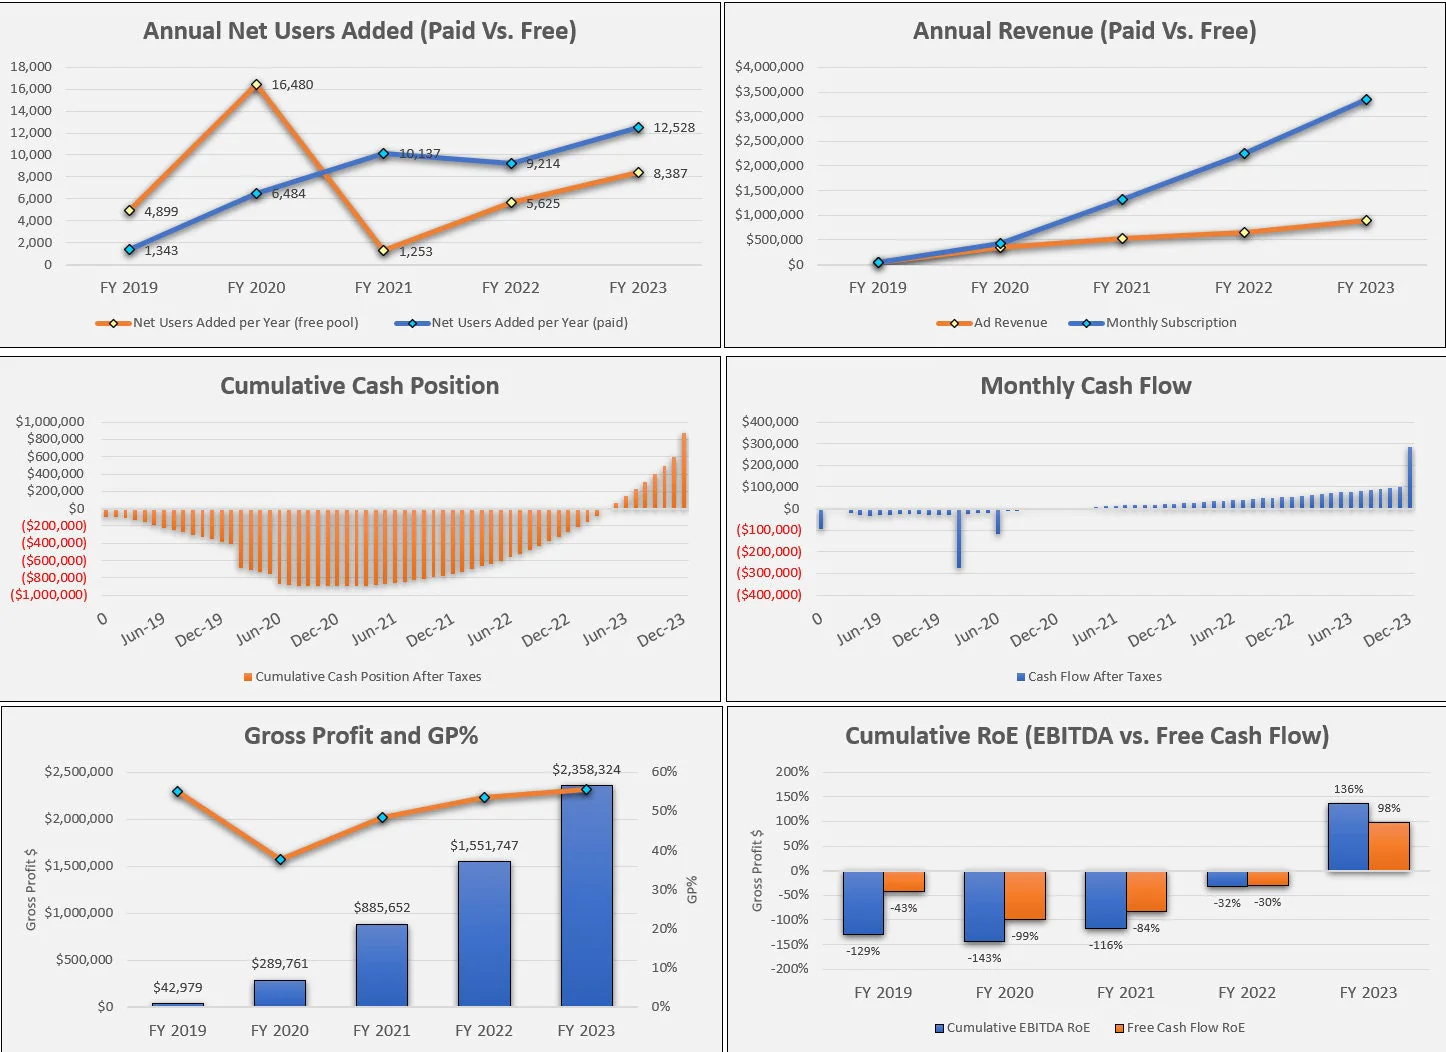
There are over 13 visualizations to make the results more digestible and clear. Final IRR is displayed based on minimum cash requirements and expected cash flow per year. There is an option to define an exit value based on a defined multiple of annual revenue in the final year. Any funding from debt that still has a balance is assumed to be repaid on the exit month.
Got a question about the product? Email us at support@flevy.com or ask the author directly by using the "Ask the Author a Question" form. If you cannot view the preview above this document description, go here to view the large preview instead.
TOPIC FAQ
What revenue drivers should I include when modeling a freemium SaaS business?
Key revenue drivers for a freemium SaaS model are starting monthly traffic and its CAGR, percentage of visitors who sign up for the free service, impressions and earnings per ad shown to the free pool, percentage of free users converting to paid per month, monthly paid price, and share of traffic signing up directly to paid service, including churn assumptions for free and paid pools; use starting monthly traffic and CAGR per year.How do I forecast ad revenue within a freemium model?
Ad revenue in a freemium model is typically forecast by estimating the number of impressions delivered to the free user pool and the earnings per impression, then applying expected fill rates and impression growth tied to traffic assumptions. The Startup Freemium SaaS Financial Model: 5 Year explicitly models impressions and earnings per impression.Which expense categories and modeling approaches work for SaaS templates?
Expenses are commonly modeled by category—G&A, S&M, R&D, and COGS—using a dynamic fixed-cost schedule with variable start months and monthly costs. COGS can be modeled either as an average cost per user per month or as a fixed percentage of revenue, per the template’s options for expense structure and timing.What does integrating a 3-statement model accomplish for a freemium SaaS forecast?
Integrating the income statement, balance sheet, and cash-flow statement links operating drivers to taxable income, net income after taxes, and cash flow after taxes, ensuring scenarios flow through to cash and valuation metrics. The template’s 3-statement integration produces operating income, taxable income, net income after taxes, and cash flow after taxes.What outputs and visualizations are most useful when presenting a freemium model to investors?
Investors typically expect monthly and annual pro forma financials, key KPIs, cash-flow projections, IRR based on minimum cash requirements, and exit-value scenarios. Visual aids that clarify conversion funnels, revenue mix, and cash dynamics are useful; this model provides over 13 visualizations and IRR and exit-multiple options.How should I model churn and movement between free and paid user pools?
Model separate churn parameters: average churn for the free pool, percentage of free users converting to paid per month, churn of paid users reverting to free, churn of paid users canceling entirely, and direct paid sign-ups from traffic. These distinct rates capture net movement and retention dynamics, including percentage of free pool converting to paid per month.What value does a pre-built freemium financial template provide compared with building from scratch?
A template provides pre-configured revenue drivers, expense schedules by category, and end-to-end outputs—reducing setup time and standardizing assumptions. For example, the Startup Freemium SaaS Financial Model: 5 Year bundles revenue levers, a dynamic fixed-cost schedule, dynamic capex, 3-statement integration, and a cap table into a single XLSX resource including IRR and exit multiple features.How is exit valuation typically modeled for a SaaS freemium business?
Exit valuation is commonly modeled by applying a defined multiple to a revenue or earnings metric in the final forecast year; the template supports defining an exit value based on a multiple of annual revenue in the final year and assumes outstanding repayable debt is settled at exit.Source: Best Practices in SaaS, Integrated Financial Model Excel: Startup Freemium SaaS Financial Model: 5 Year Excel (XLSX) Spreadsheet, Jason Varner | SmartHelping
ABOUT THE AUTHOR
I graduated in 2011 with a Bachelor's degree in Accounting and began my career as a financial analyst at a small chain of auto repair shops. After gaining valuable experience, I launched my own practice specializing in real estate underwriting, later expanding into general business modeling.
I honed my spreadsheet modeling expertise by completing over 400 projects on Upwork with a 100% success
... [read more]
Ask the Author a Question
You must be logged in to contact the author.
