
Basic SaaS Startup Model: 4 Pricing Tiers – Excel XLSX
Excel (XLSX)
VIDEO DEMO
SAAS EXCEL DESCRIPTION
How much is a SaaS customer worth? How long does a SaaS customer take to repay their acquisition costs? At what price does the MRR received from subscriptions allow for stabilized profit and growth? This model will help enlighten one in regards to those questions.
Recent Updates: Integrated 3-statement model, capitalization table, contribution / distribution summary with DCF Analysis / IRR, and lots of formatting changes for a more professional view.
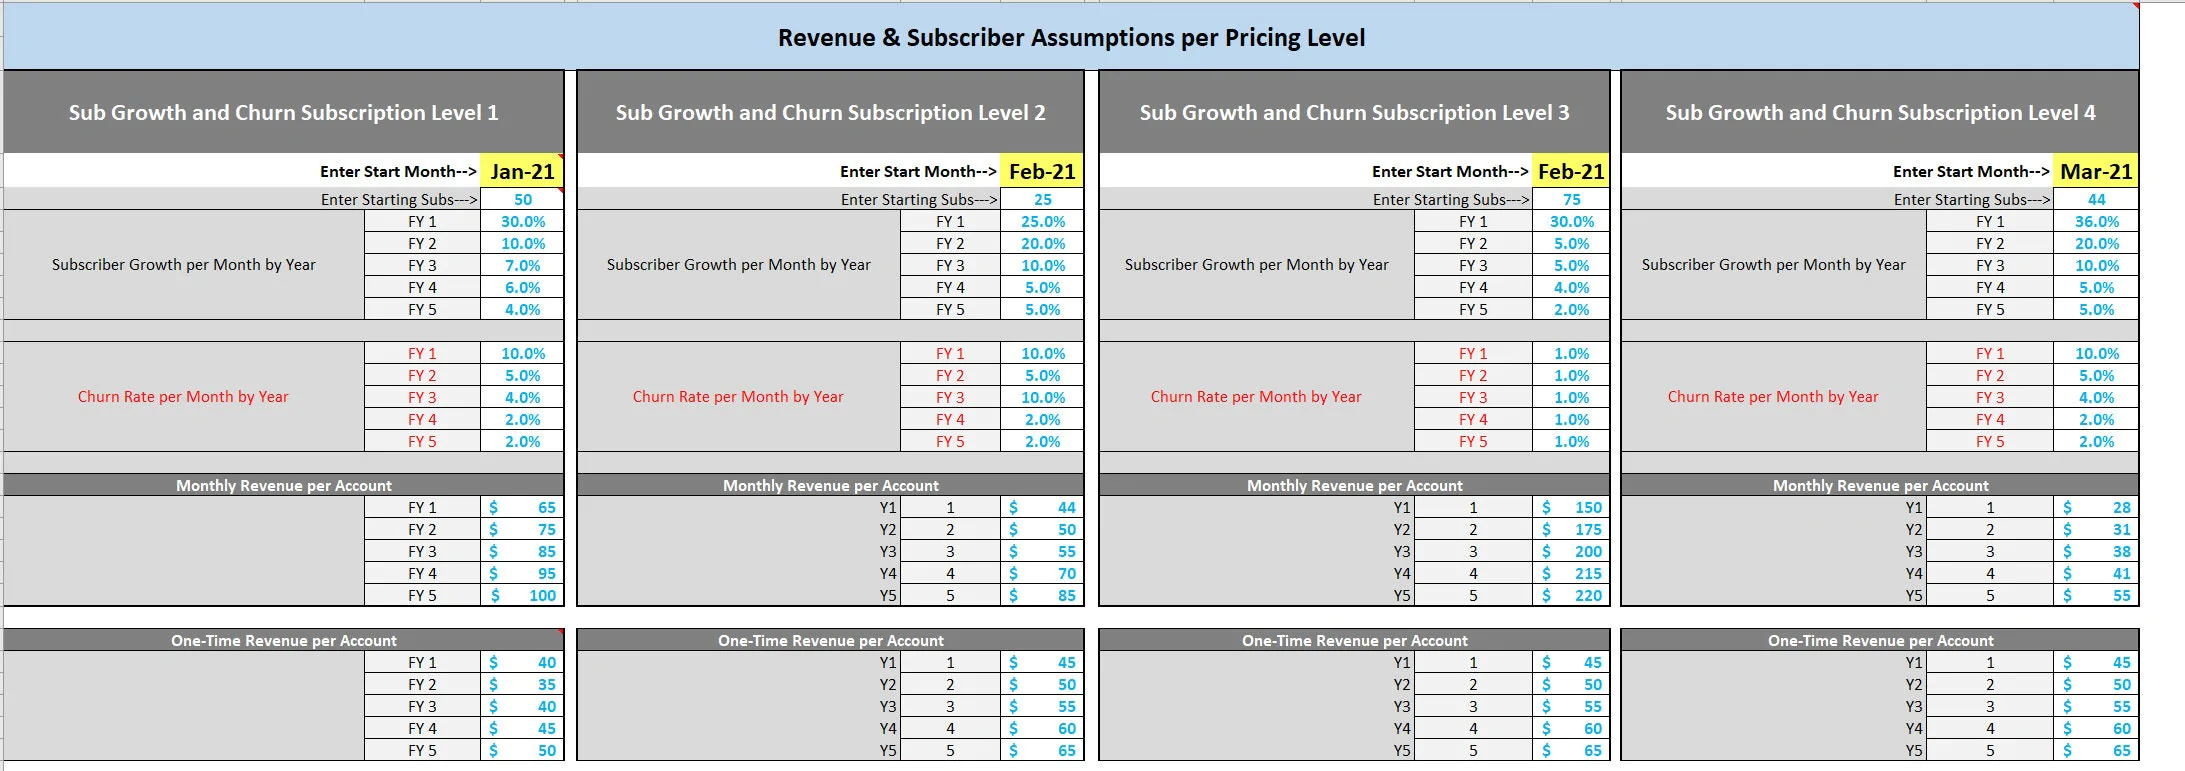
This is a very simple-to-use and understandable SaaS financial model. It has four basic pricing tiers. The user can configure subscriber assumptions and OpEx in a way that anyone can figure out and input accurately without messing up much.
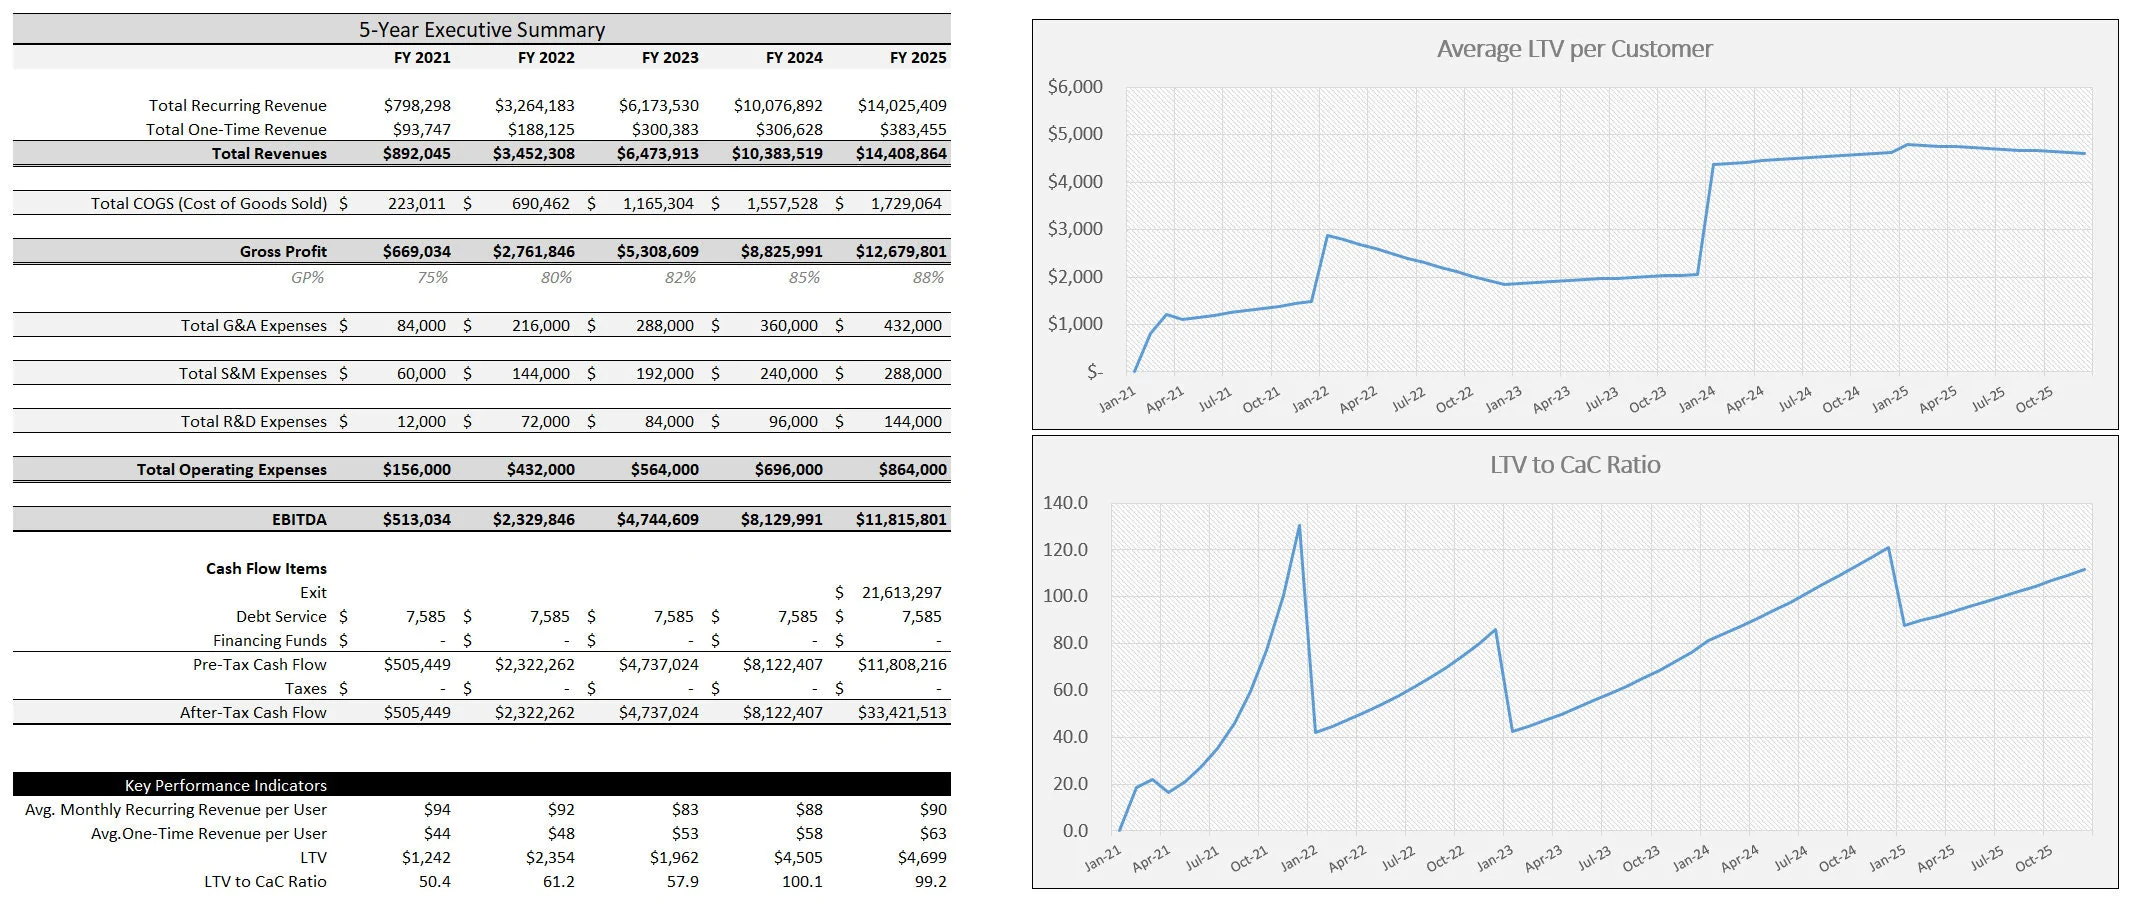
COGS is defined as a percentage of total revenue per year. The model drives down to EBITDA and cash flow as well as has a basic DCF Analysis and terminal value.
Subscriber Inputs:
• Up to 4 tiers
• Start month
• Starting sub count
• Average monthly value per subscriber per tier
• Monthly CAGR of subscribers per tier
• One-time setup fee per tier
• Average monthly churn rate per year per tier
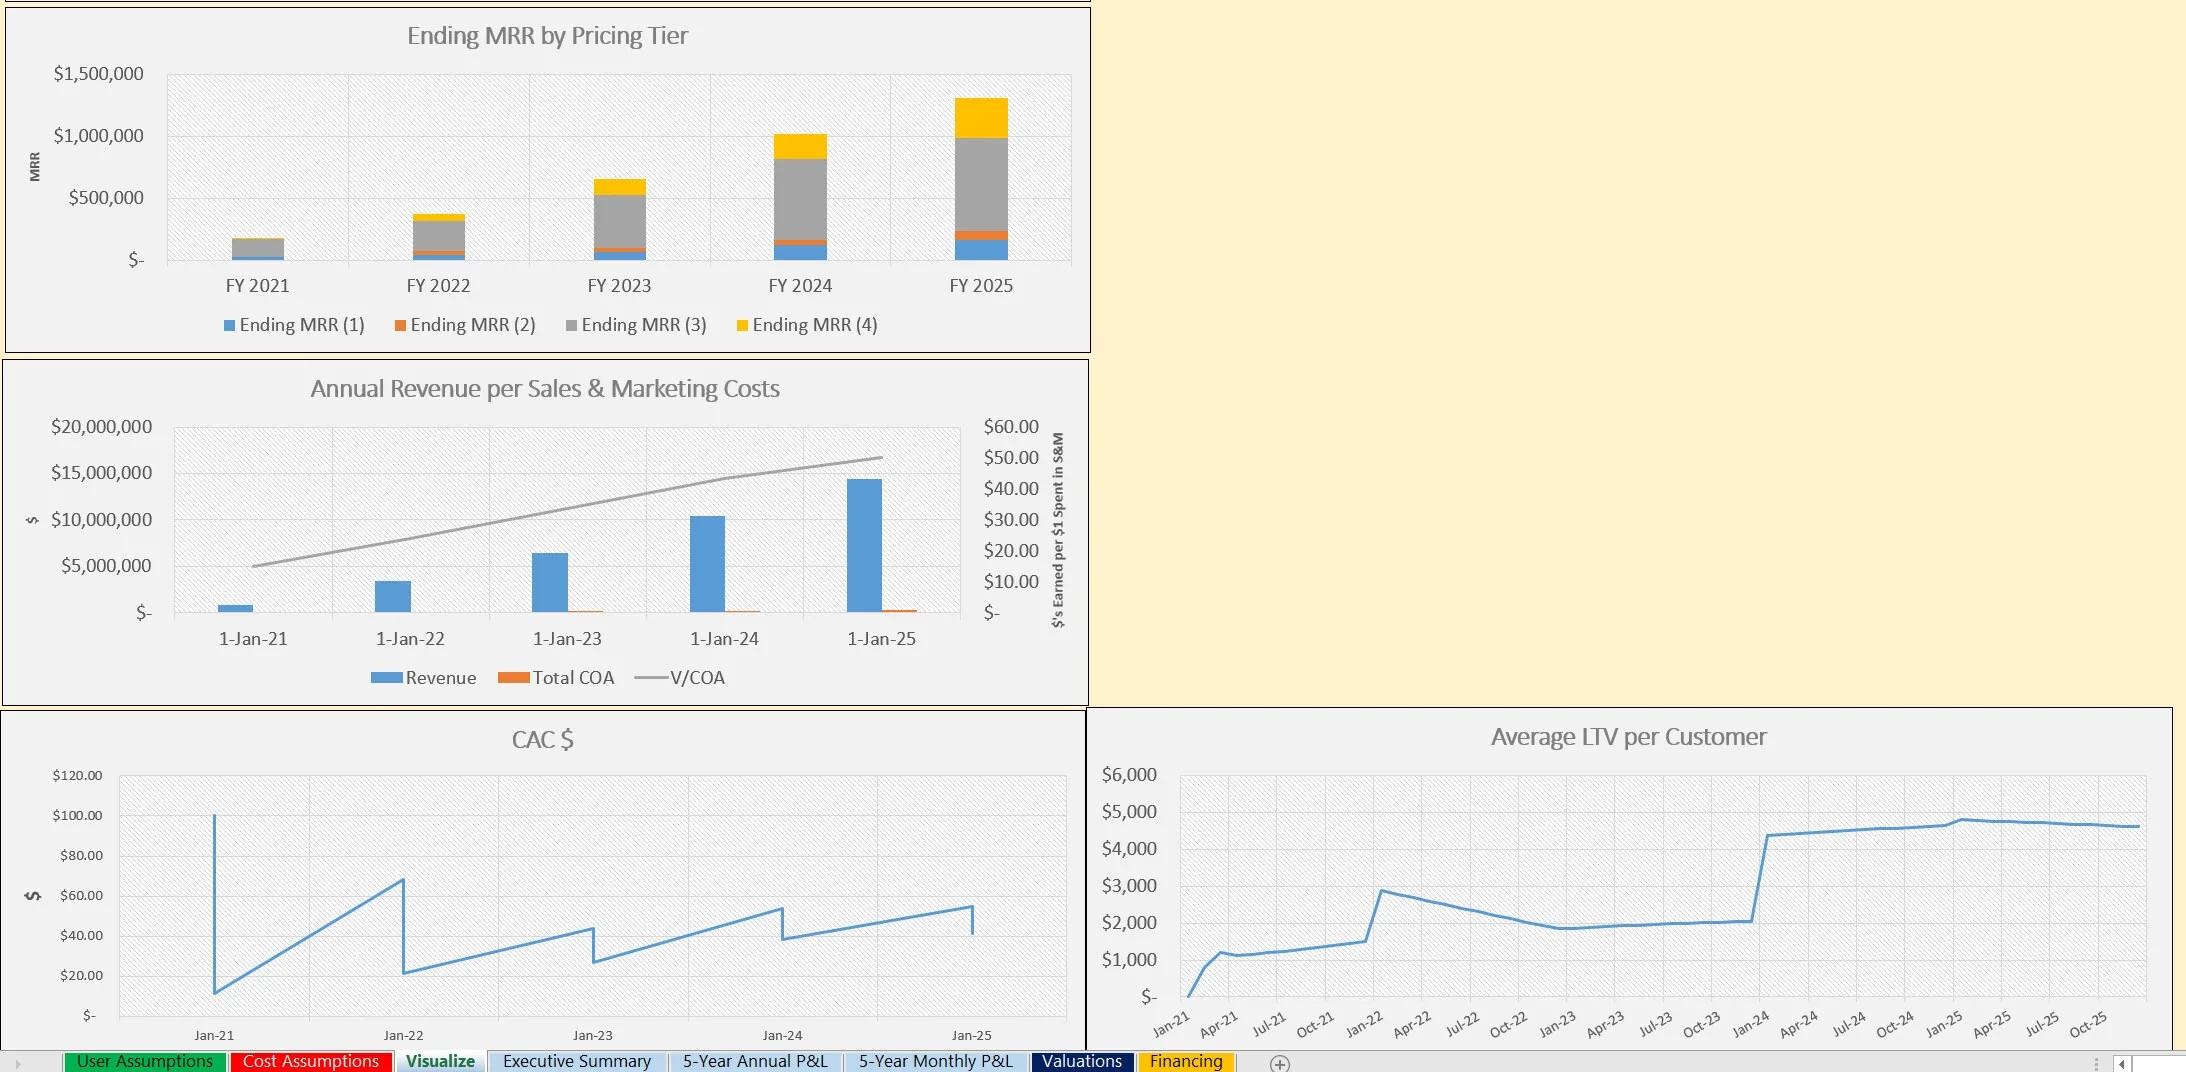
Advanced KPI metrics are derived from the pro forma on a monthly basis. This is possible because the total Sales and Marketing costs per year are definable and measuring that against the total added subscribers per month results in a CaC.
Also, the churn rate allows for an average life of a subscriber and the resulting revenue in that time to be calculated as well as the LTV to CaC ratio.
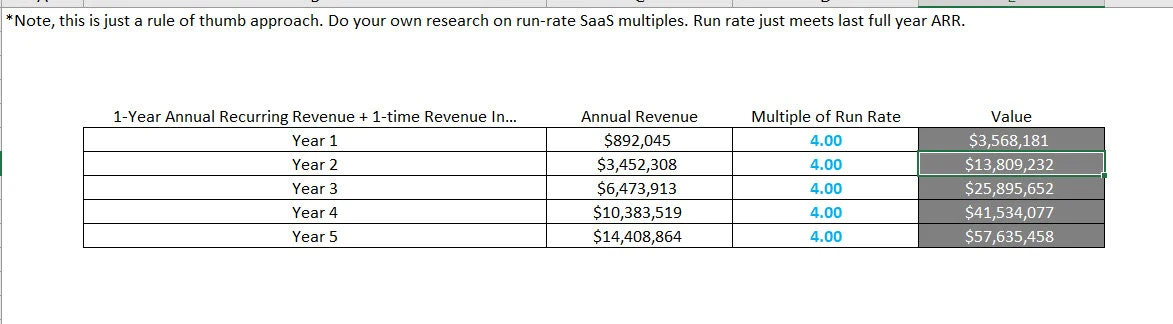
This is a simplified model that was built to be a quick tool to use for any business that has month-to-month subscriber pricing tiers. One sensitivity analysis that is shown is the valuation per a given run rate based on final year run rate x a sales multiple.
Got a question about the product? Email us at support@flevy.com or ask the author directly by using the "Ask the Author a Question" form. If you cannot view the preview above this document description, go here to view the large preview instead.
TOPIC FAQ
What inputs are essential for modeling SaaS subscriber revenue and unit economics?
Key inputs are tier-level subscription assumptions: start month, starting subscriber count, average monthly value (ARPU) per tier, monthly CAGR per tier, one-time setup fee per tier, and average monthly churn rate per year per tier. The model also requires annual Sales & Marketing spend to derive CAC and supports up to 4 pricing tiers.How is customer acquisition cost (CAC) typically calculated in a SaaS model?
CAC is calculated by comparing total Sales & Marketing costs to the volume of new subscribers acquired. In this model, the approach uses definable total S&M costs per year measured against total added subscribers per month to derive CAC from annual S&M and monthly subscriber additions.How do you derive LTV and the LTV:CAC ratio from churn?
Use the average monthly churn rate per year per tier to estimate average subscriber lifetime, then sum expected recurring revenue over that lifetime to compute LTV. Divide LTV by the CAC to produce the LTV:CAC ratio, which the model reports based on churn-derived lifetime and CAC inputs.What are the typical financial outputs a basic SaaS model should provide?
A basic SaaS model should produce monthly and annual pro forma statements, EBITDA and cash flow projections, valuation analysis such as DCF and terminal value, and investor-oriented summaries like a capitalization table and contribution/distribution summary; this model includes a 3-statement integration plus DCF/IRR outputs.What features should I prioritize when buying a simple SaaS financial template?
Prioritize templates that allow tiered subscriber inputs, monthly churn and growth assumptions, definable annual Sales & Marketing to compute CAC, and integrated outputs like EBITDA, cash flow, and DCF/IRR. Templates that explicitly support up to 4 pricing tiers and three-statement integration address common SaaS needs.How much Excel skill and time are typically required to customize a basic SaaS model?
For a model described as simple-to-use, basic to intermediate Excel proficiency is usually sufficient to enter tier-level subscriber assumptions, annual OpEx, and S&M figures. Customizing scenarios and sensitivities should be quick for month-to-month subscriber pricing across up to 4 tiers.How do I assess the cost versus value of buying a ready-made SaaS template?
Assess value by whether the template produces the outputs you need—monthly KPIs, CAC, LTV, EBITDA, cash flow, and valuation (DCF/IRR)—and how much time it saves versus building from scratch. Templates that deliver DCF/IRR and monthly KPI calculations typically provide measurable time savings.What model features matter most when preparing investor materials for a SaaS seed round?
Investors expect clear unit-economics (CAC and LTV), monthly revenue and churn dynamics, integrated cash flow and EBITDA forecasts, and valuation support such as DCF/IRR and a capitalization table. A template combining these elements enables investor-ready materials including DCF/IRR and cap table outputs.Source: Best Practices in SaaS, Subscription, Integrated Financial Model Excel: Basic SaaS Startup Model: 4 Pricing Tiers Excel (XLSX) Spreadsheet, Jason Varner | SmartHelping
ABOUT THE AUTHOR
I graduated in 2011 with a Bachelor's degree in Accounting and began my career as a financial analyst at a small chain of auto repair shops. After gaining valuable experience, I launched my own practice specializing in real estate underwriting, later expanding into general business modeling.
I honed my spreadsheet modeling expertise by completing over 400 projects on Upwork with a 100% success
... [read more]
Ask the Author a Question
You must be logged in to contact the author.
