
Enterprise SaaS 5-Year Startup Model – Excel XLSX
Excel (XLSX)
VIDEO DEMO
SAAS EXCEL DESCRIPTION
Recent Updates: Added fully integrated financial statements (Income Statement, Cash Flow Statement, Balance Sheet), also included a 'deferred revenue' liability row for situations where the user has selected to collect cash up front for contracts instead of evenly over the life of the contract. Added a cap table and capex with depreciation logic as well.
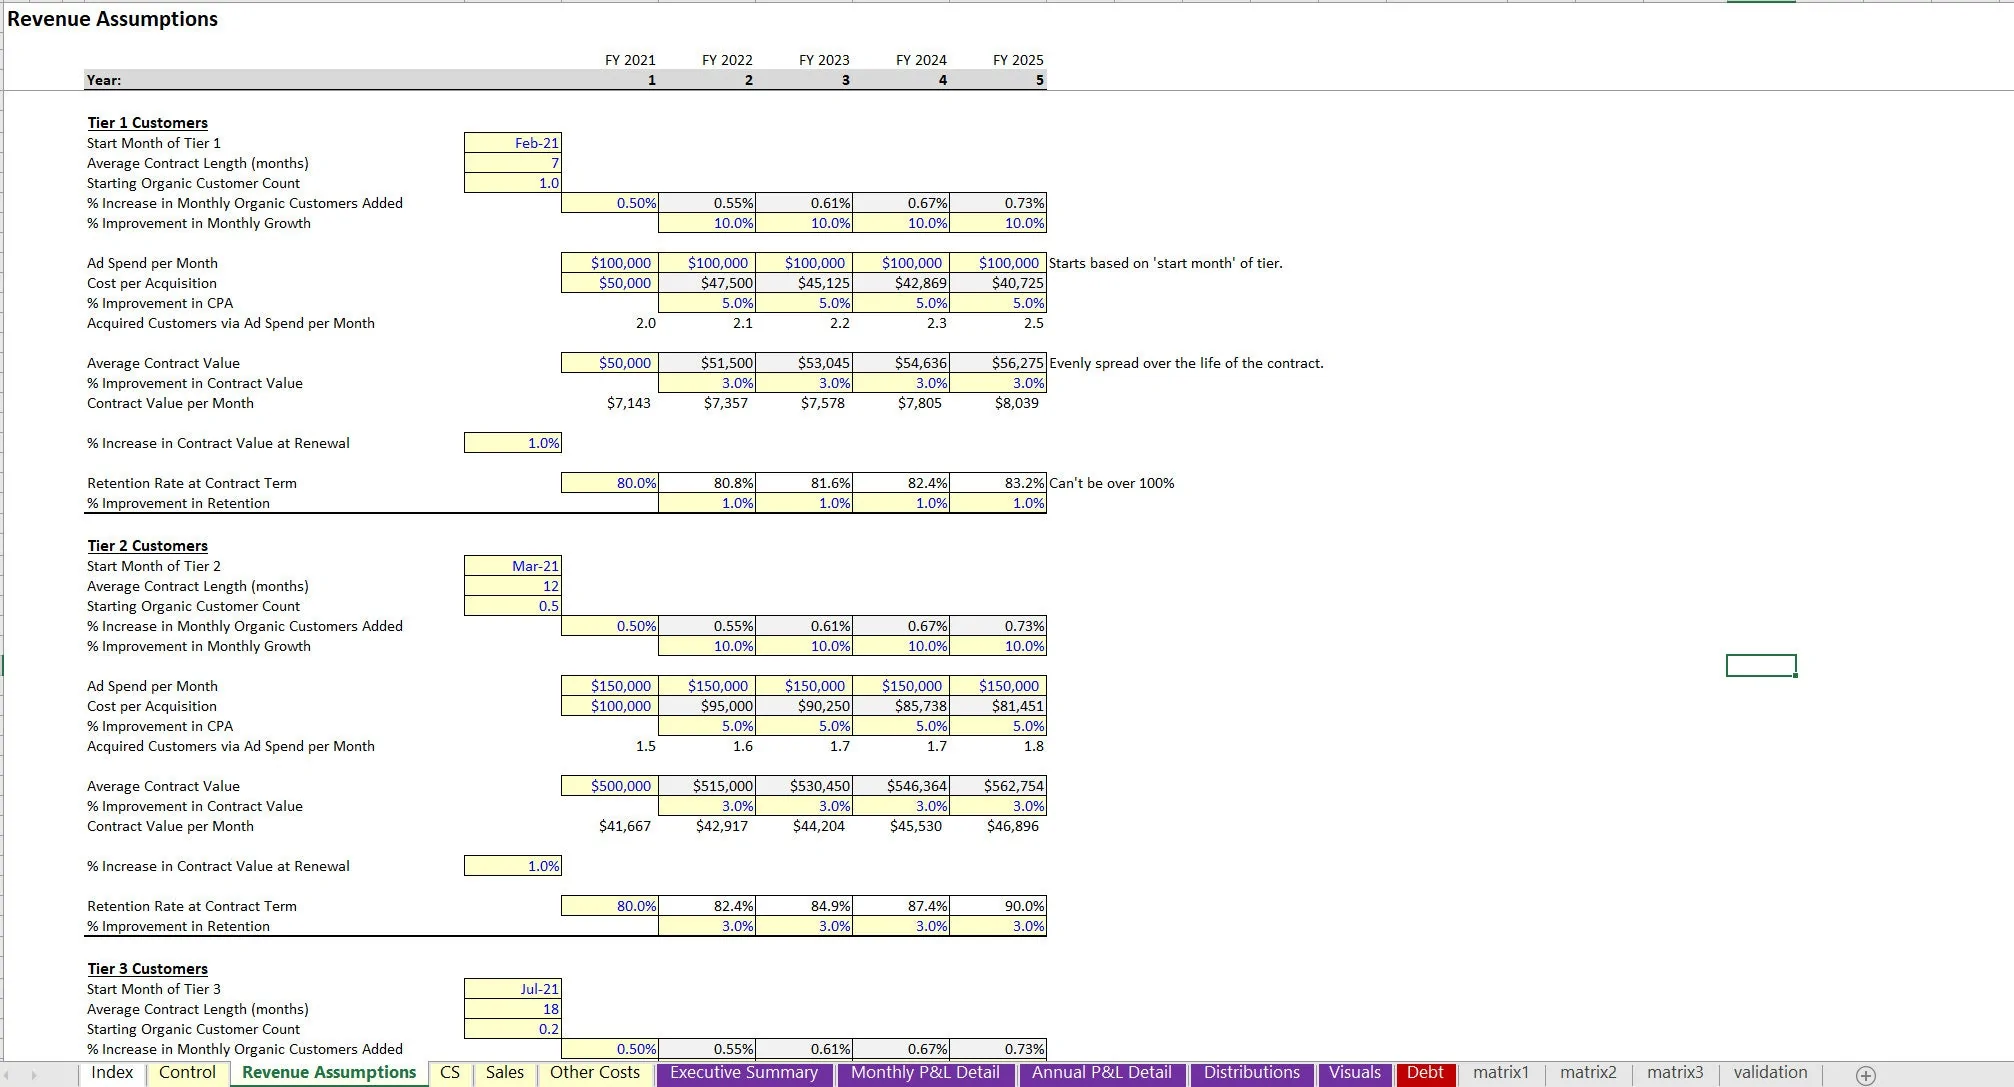
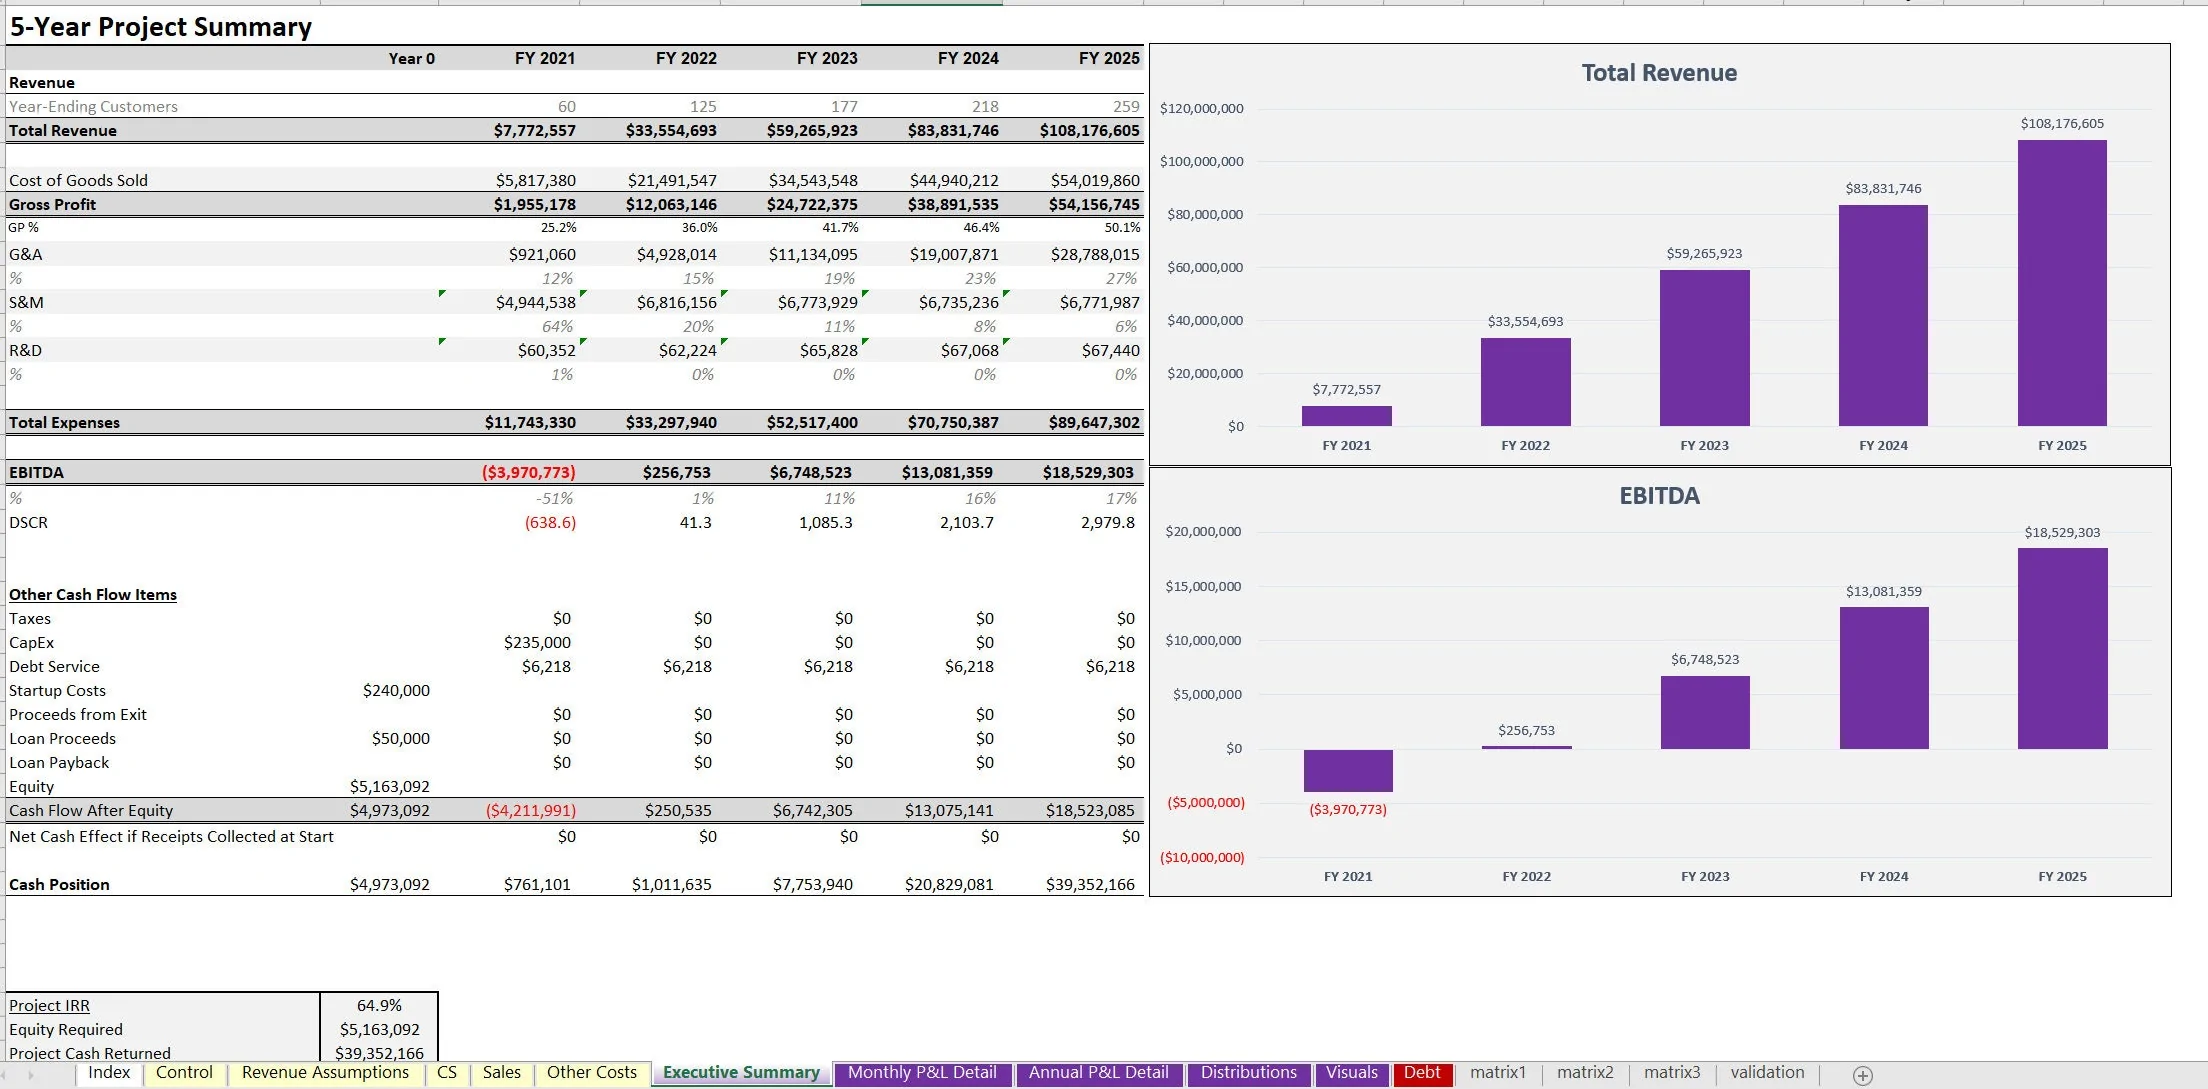
This model is designed to handle up to three types of enterprise customers that are completely configurable. Final outputs include an Executive Summary (annual), monthly and annual pro forma details, DCF Analysis, and plenty of visualizations.
The most difficult piece of logic for this model was correctly modeling out the input for contract length. This is a dynamic input and can be from 1 month to any number of months. Combined with retention rate, this gives a very accurate customer count forecast based on the defined assumptions.
Each customer type is configurable based on the following (most adjustable in each year):
• Start Month
• Average Contract Length (months)
• Starting Organic Customer Count
• % Increase in Monthly Organic Customers Added
• % Improvement in Monthly Growth
• Ad Spend per Month
• Cost per Acquisition
• % Improvement in CPA
• Acquired Customers via Ad Spend per Month
• Average Contract Value
• % Improvement in Contract Value
• Contract Value per Month
• % Increase in Contract Value at Renewal
• Retention Rate at Contract Term
• % Improvement in Retention
Other advanced logic that was built in includes the possibility to model the average contract value increasing for existing customers. For example, a starting customer may have an average contract value of $x, and all those that renew when their contract term is up, may now have an average contract value of $x+5%.
This is how negative churn is possible and based on the defined inputs, you may see the actual $ churn being a negative value (meaning the amount of money lost to customers that left is less than the increase in money earned from customers that stay).
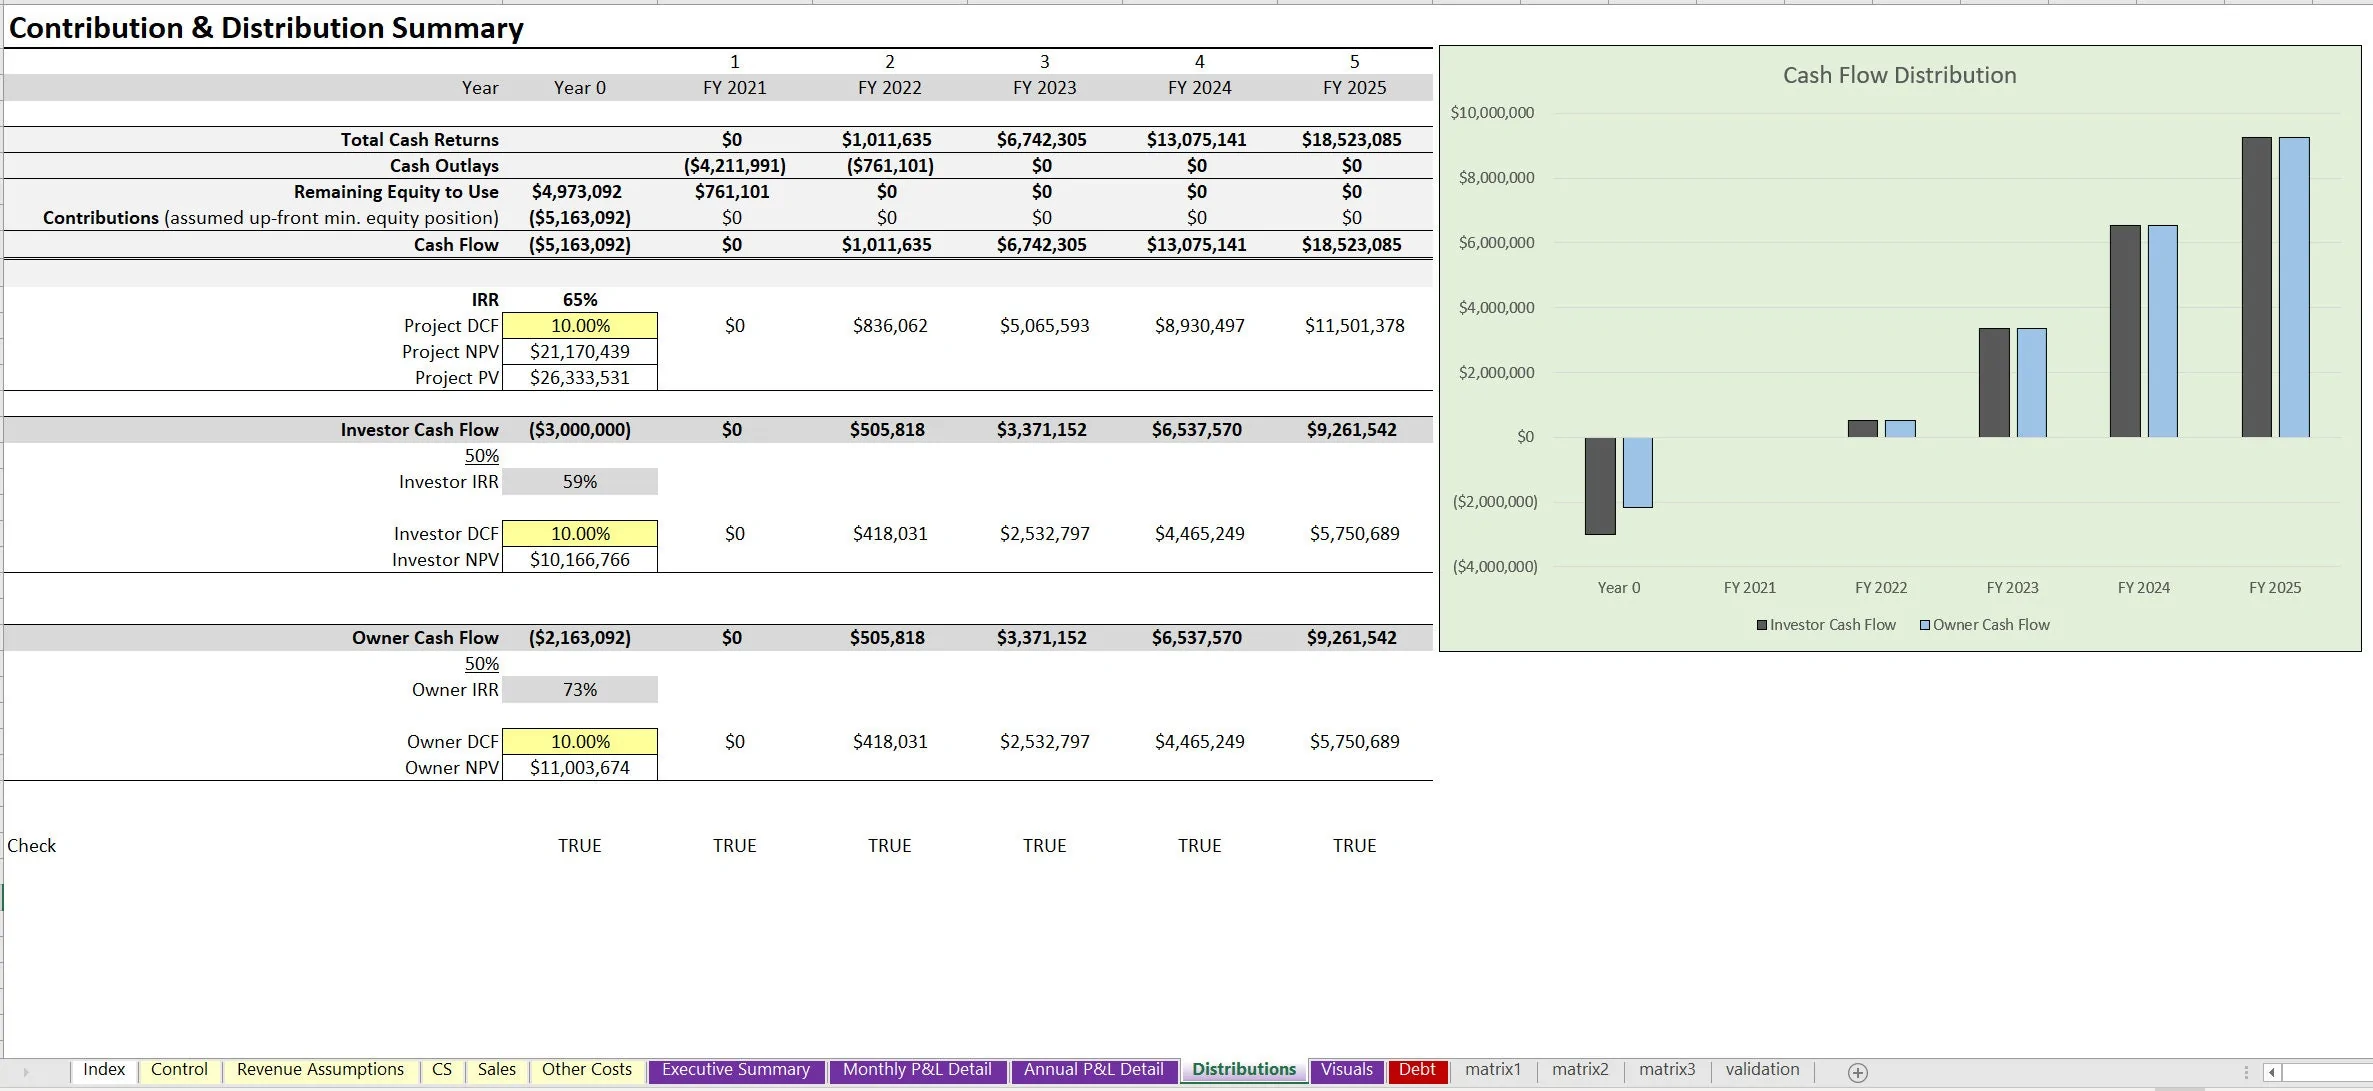
After all assumptions are filled in, the user can go back to the control tab to see minimum equity required and then choose how they plan to finance it (between senior debt, investors, and owner equity). Investors and owners will have their own cash contribution / distribution summary along with an IRR, ROI, DCF Analysis, and equity multiple.
If no investor proceeds are defined, then it all falls to the owner equity or senior debt. Advanced KPI results are displayed and included in visualizations.
They are:
• CaC
• Average monthly value per account
• Average months to repay CaC
• Average monthly churn (customers and $ value)
• Average life of customer
• Average LTV
• LTV to CaC ratio
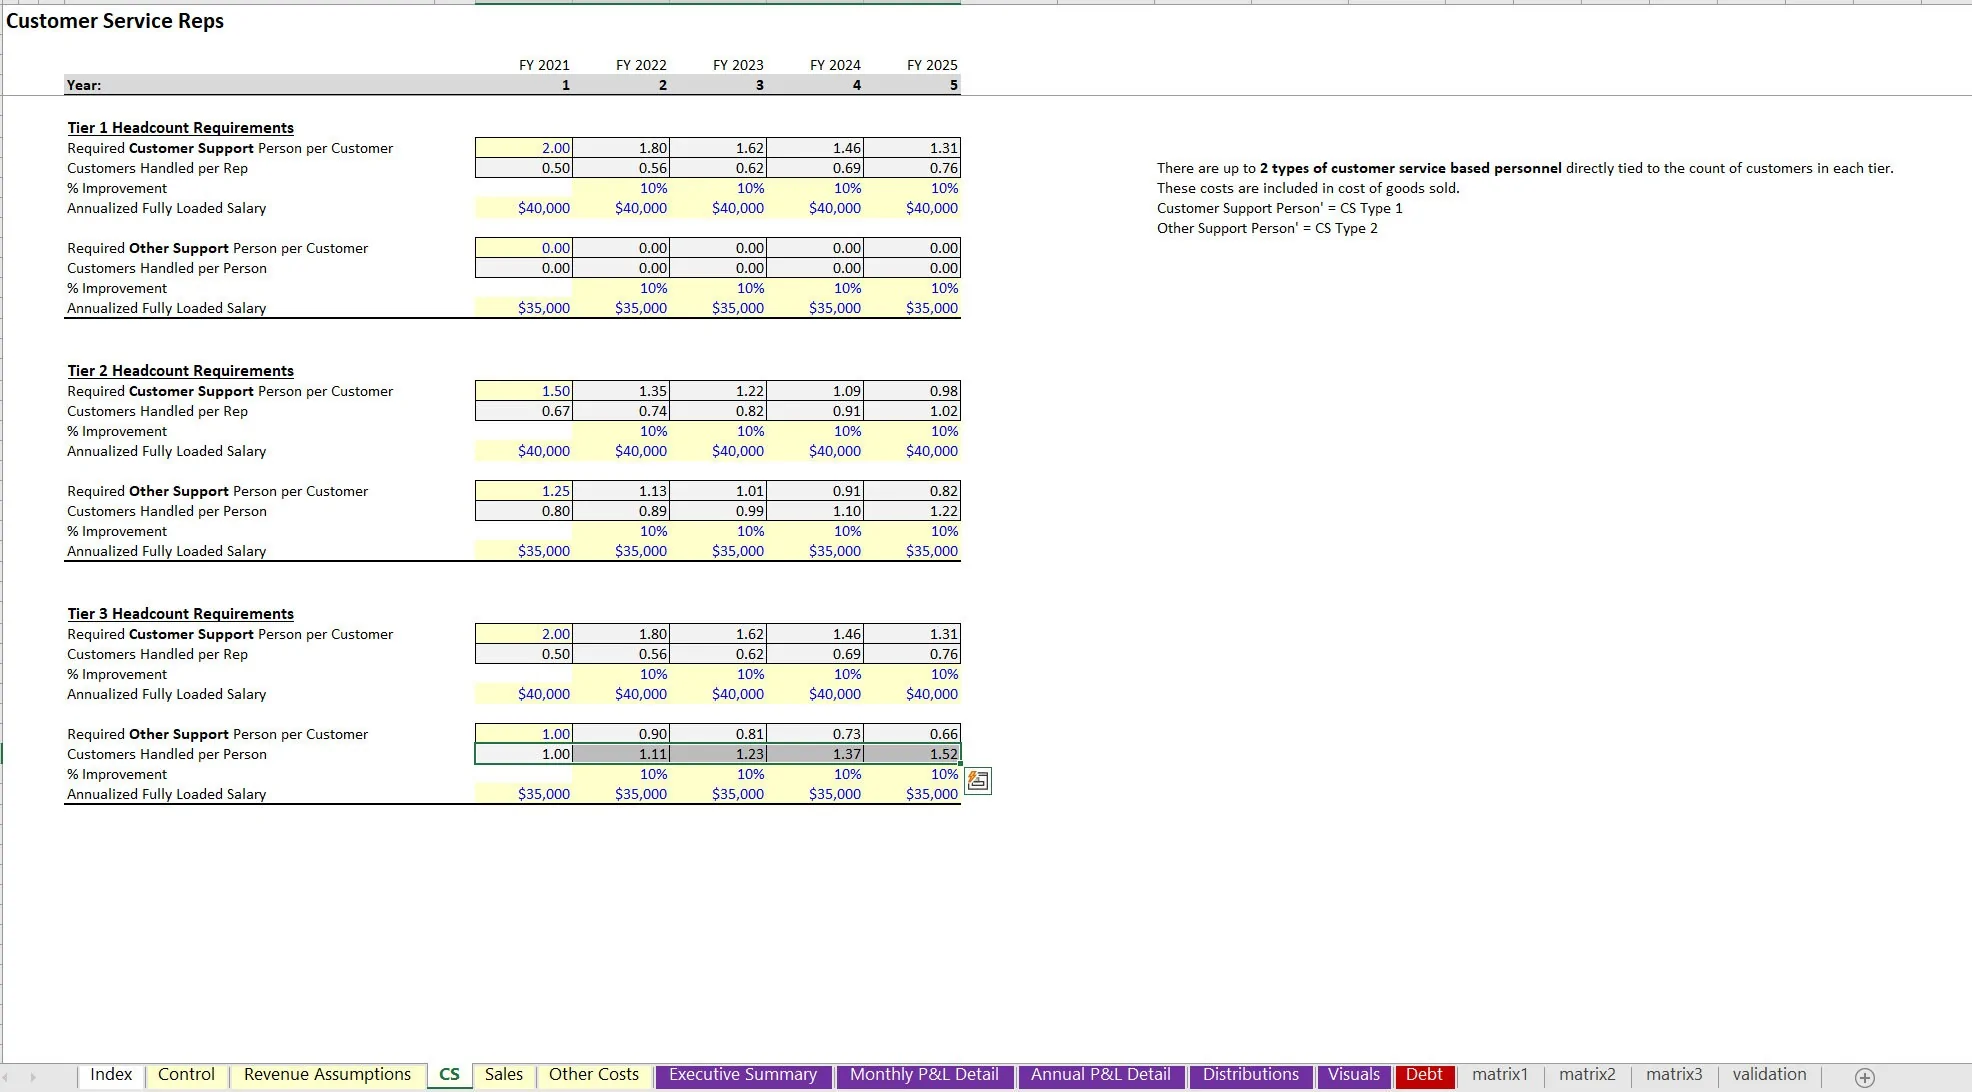
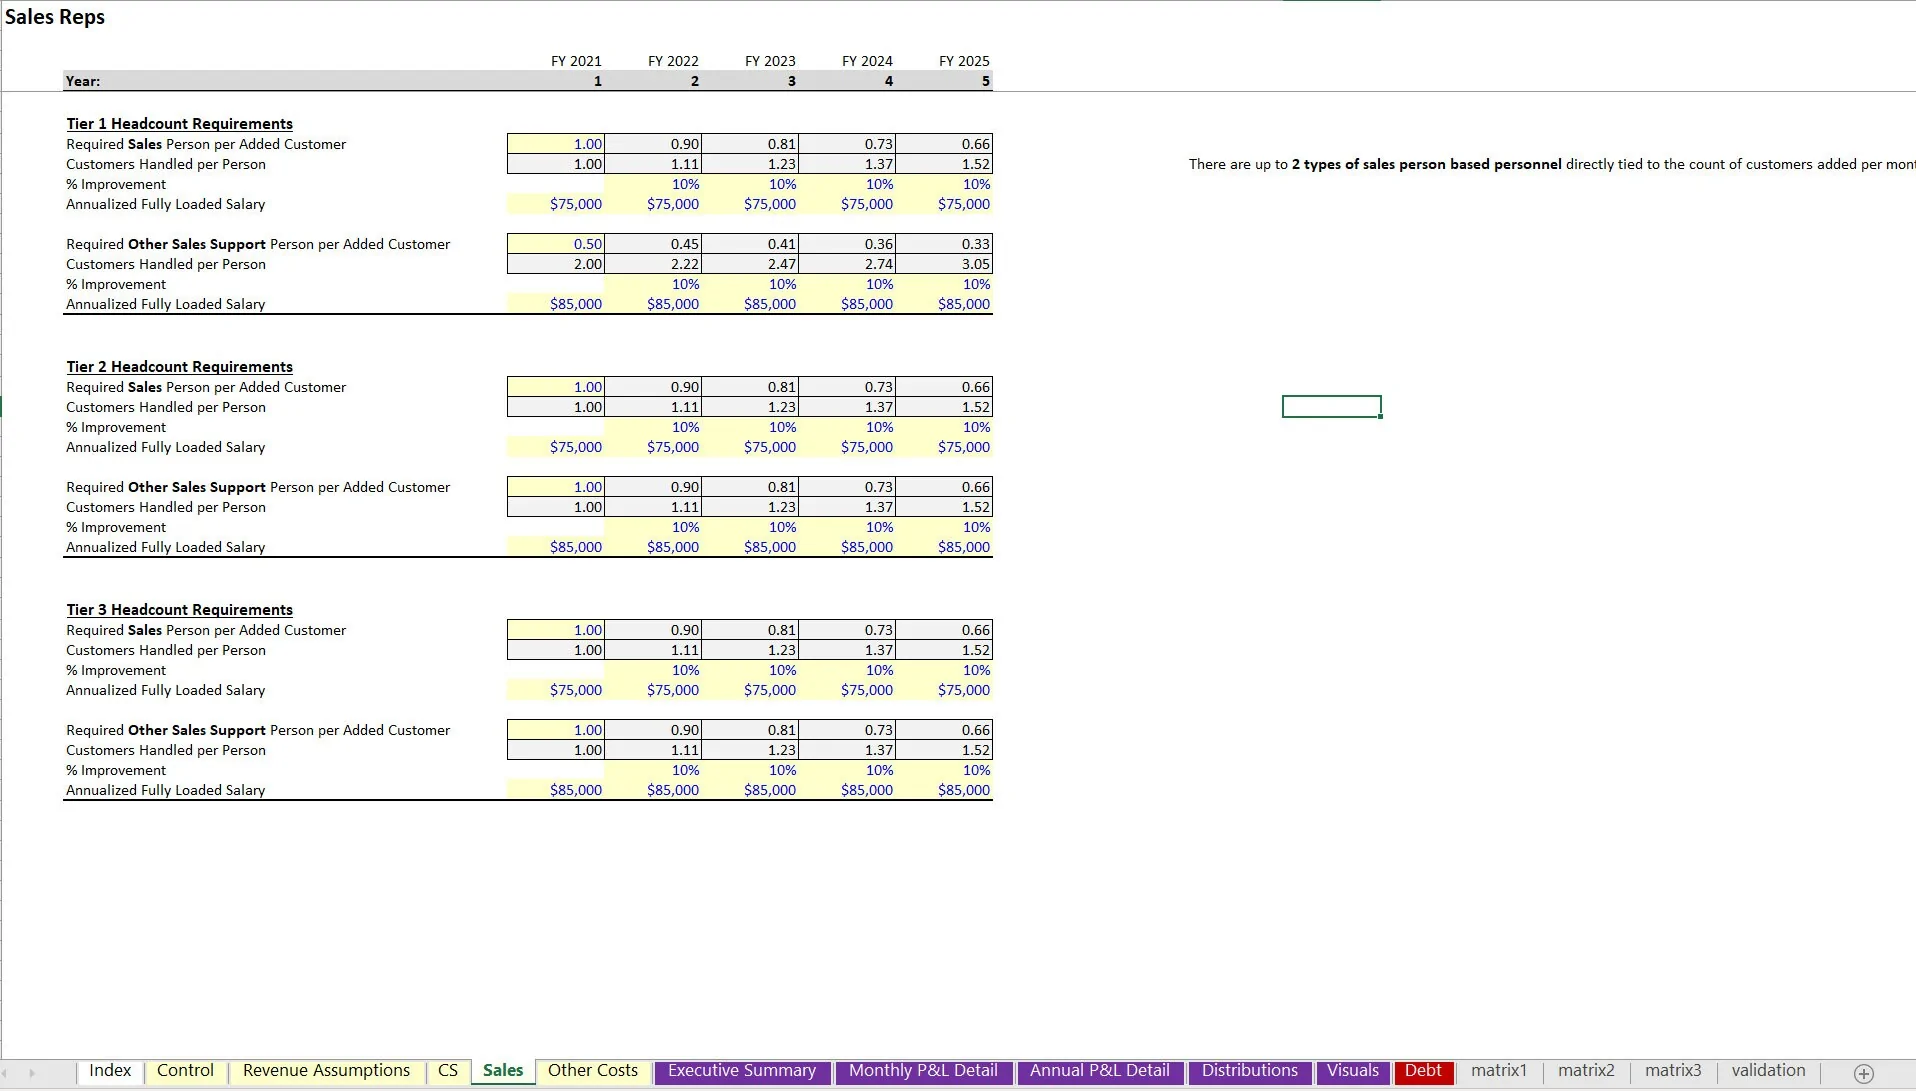
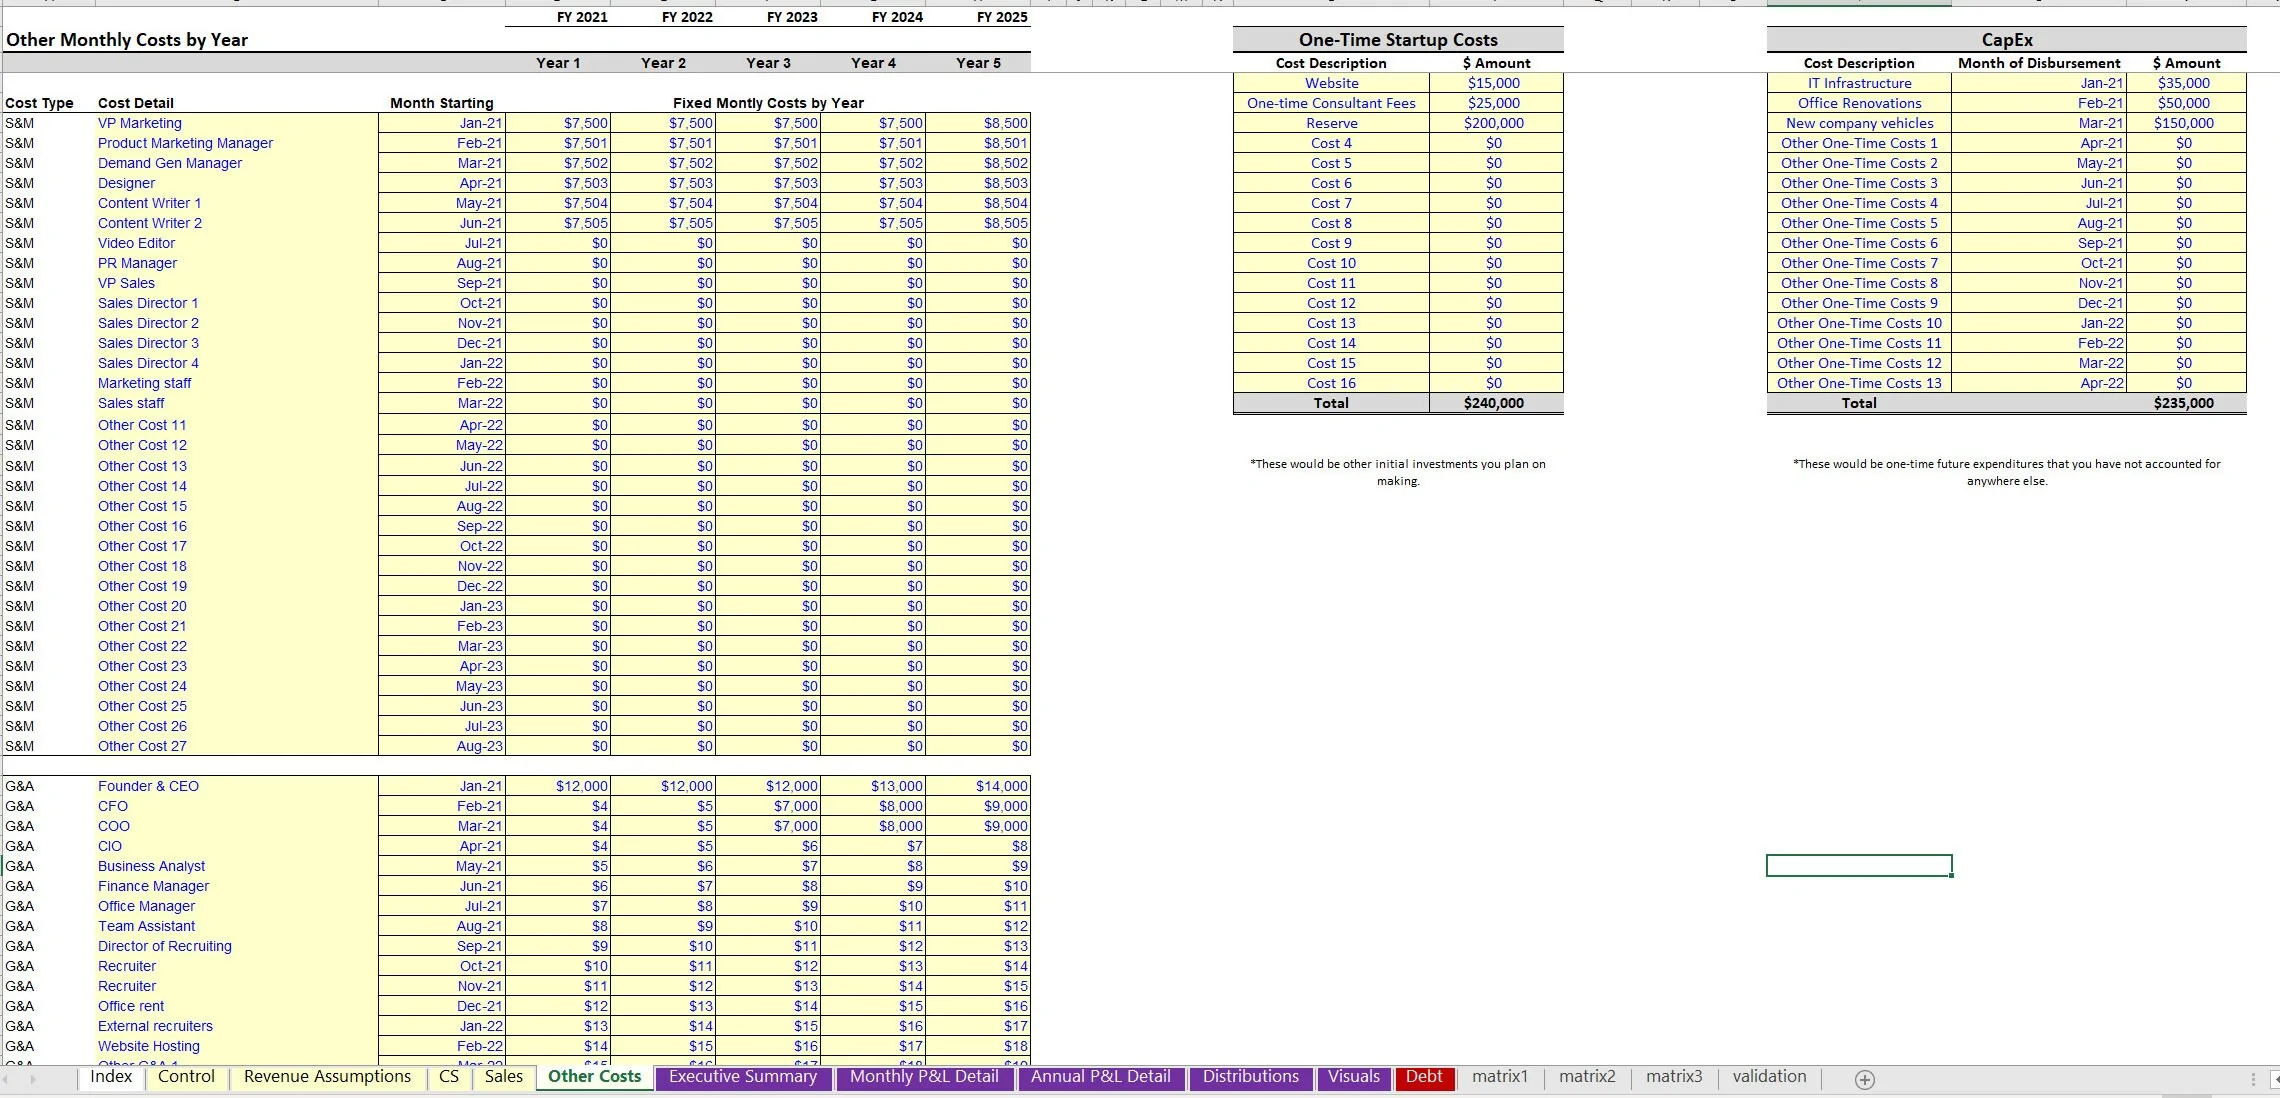
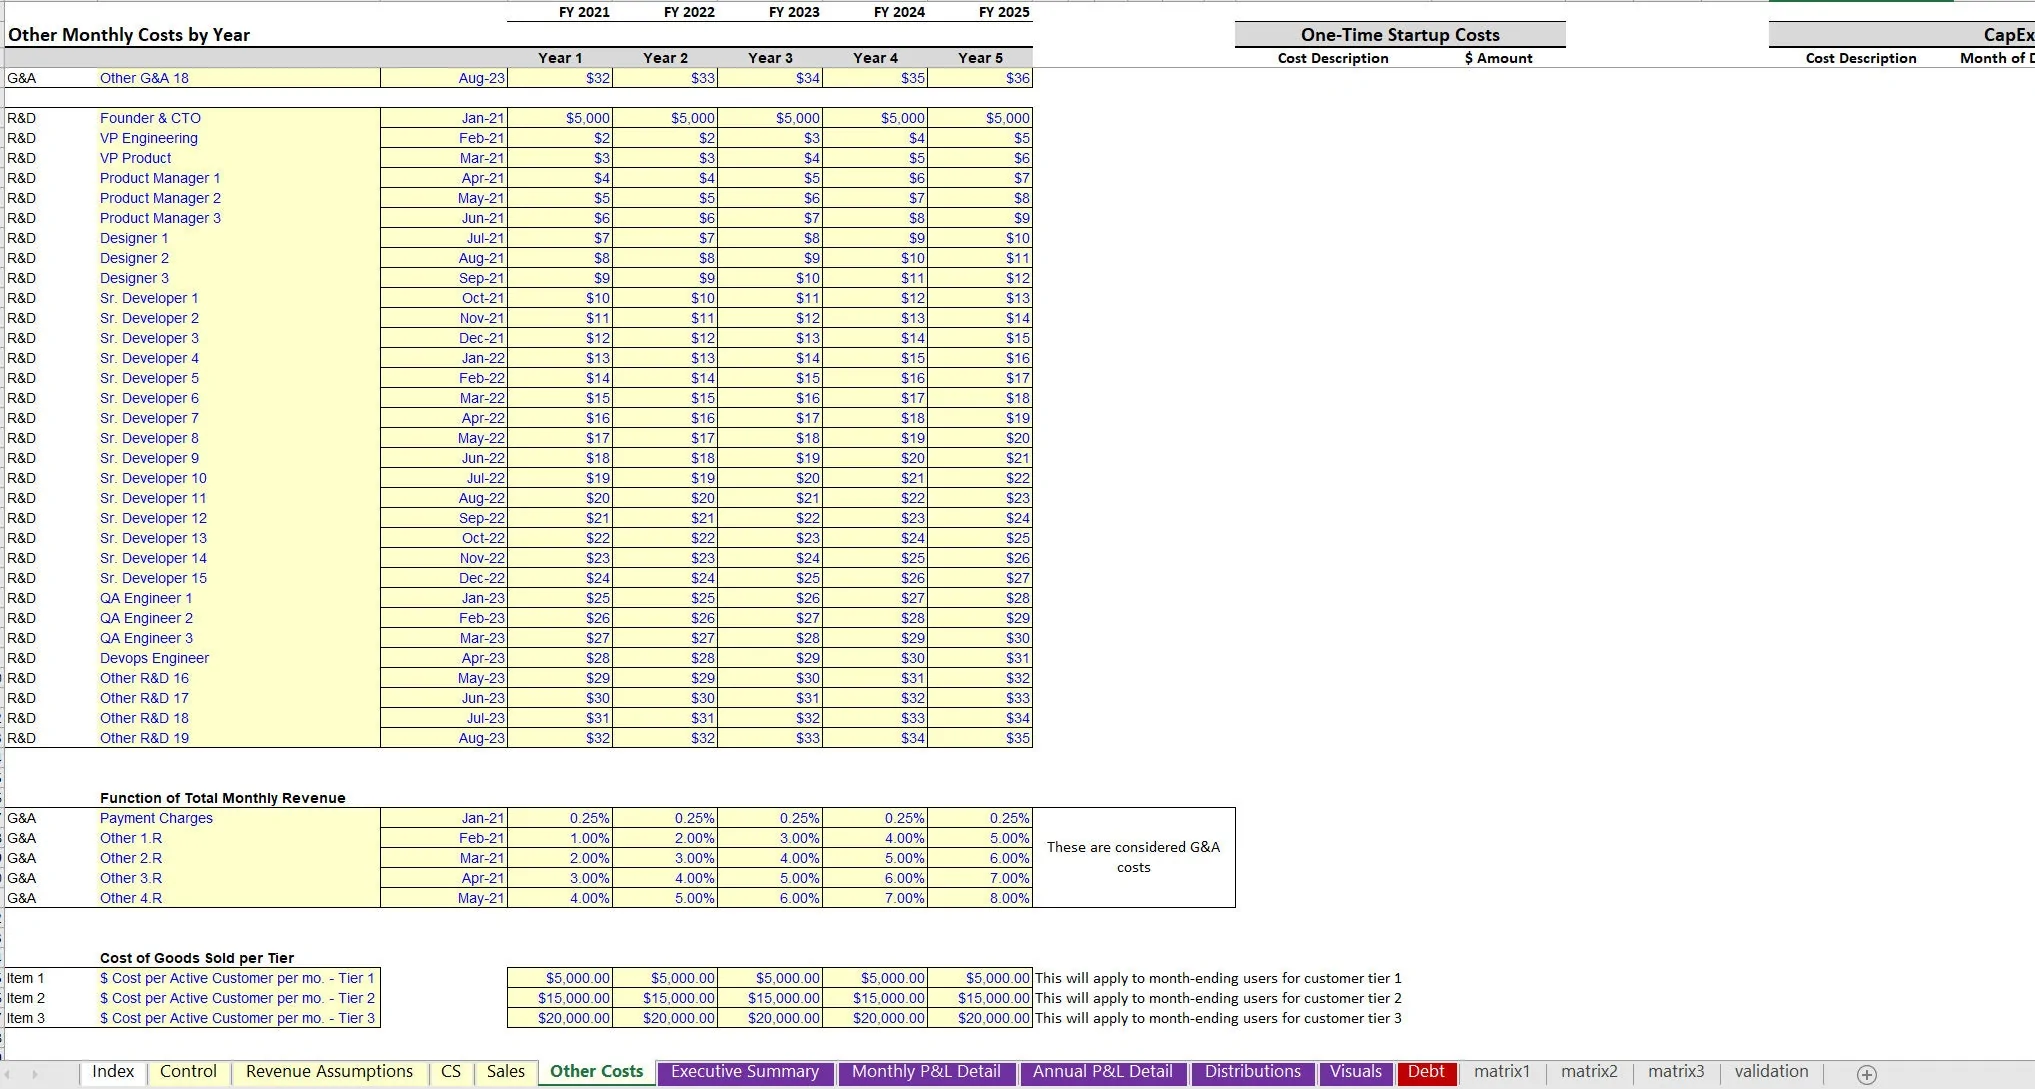
General operating expenses are defined in groups with plenty of data entry slots for S&M, G&A, and R&D as well as cost of goods sold logic that can be driven based on cost per user per month, a direct percentage of revenue, or defined $ cost per month.
Finally, if you want to account for all the cash for a contract to be collected up front, there is a 'yes/no' switch for that and if turned on, the cash flow will account for said logic, otherwise if 'no' then it will amortize the average contract value over the term of the contract, however many months that may be.
Got a question about the product? Email us at support@flevy.com or ask the author directly by using the "Ask the Author a Question" form. If you cannot view the preview above this document description, go here to view the large preview instead.
Source: Best Practices in SaaS, Integrated Financial Model Excel: Enterprise SaaS 5-Year Startup Model Excel (XLSX) Spreadsheet, Jason Varner | SmartHelping
ABOUT THE AUTHOR
I graduated in 2011 with a Bachelor's degree in Accounting and began my career as a financial analyst at a small chain of auto repair shops. After gaining valuable experience, I launched my own practice specializing in real estate underwriting, later expanding into general business modeling.
I honed my spreadsheet modeling expertise by completing over 400 projects on Upwork with a 100% success
... [read more]
Ask the Author a Question
You must be logged in to contact the author.
