
Common Consulting Frameworks (How and When to Use) – PowerPoint PPTX Template
PowerPoint (PPTX) 43 Slides
STRATEGY FRAMEWORKS PPT TEMPLATE DESCRIPTION
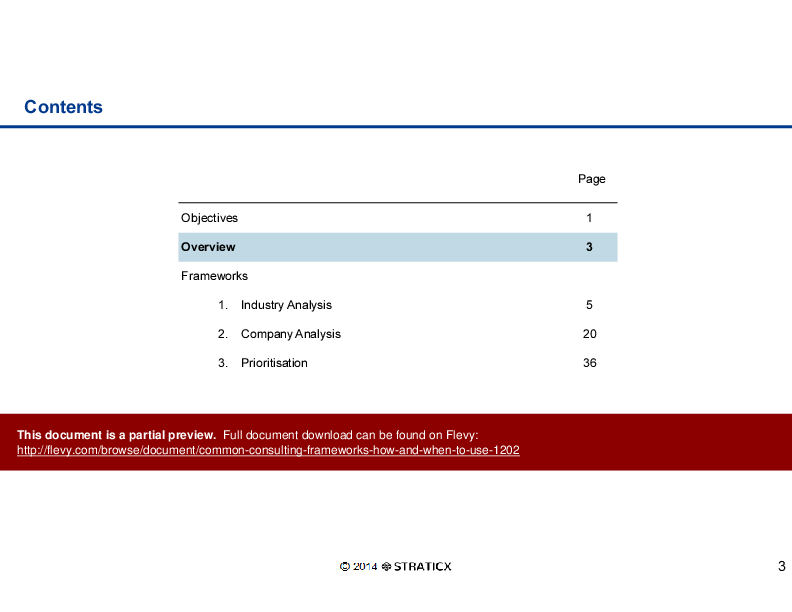
This document provides and overview of over 20 commonly used consulting frameworks. Divided into three sections:
1. Industry Analysis
2. Company Analysis
3. Prioritisation
The objectives of this document are to:
Develop familiarity with common industry / business analysis frameworks
Generate an understanding of advantages / disadvantages of each framework
Provide a starting point for a reference library of commonly used frameworks
This document is equally suitable for those looking to move into consulting, consultants or those in corporate strategy roles.
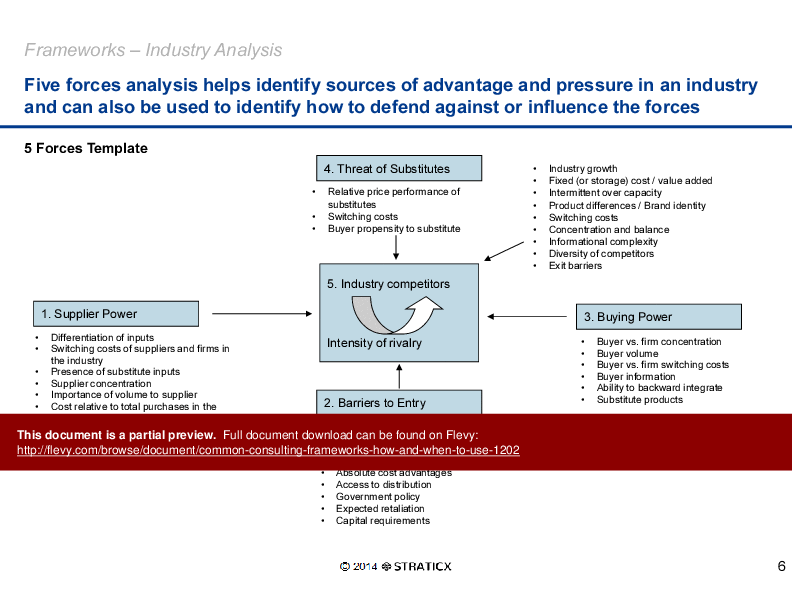
This PPT delves into the intricacies of industry analysis, utilizing frameworks like the Five Forces Analysis to pinpoint sources of competitive pressure and strategic advantage. It provides a comprehensive template to assess supplier power, threat of substitutes, and barriers to entry, among other factors. This analysis is crucial for understanding market dynamics and positioning your company to defend against competitive forces effectively.
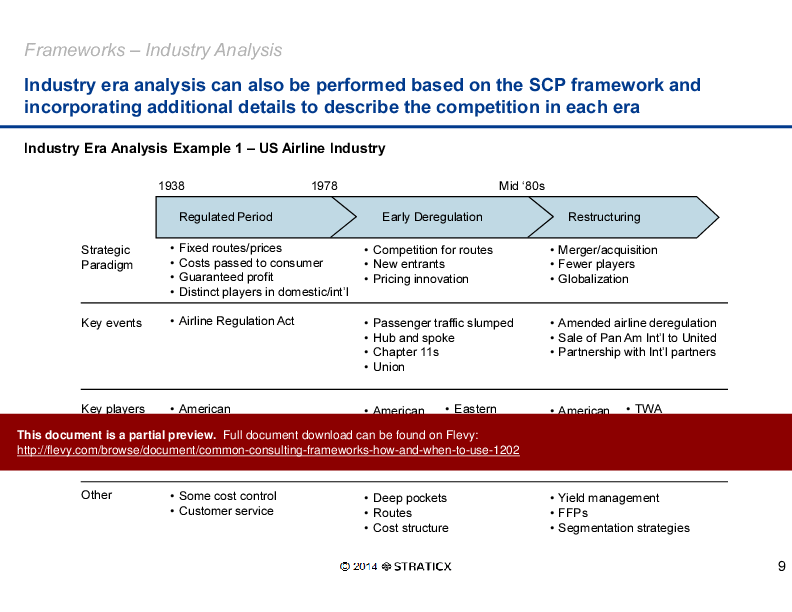
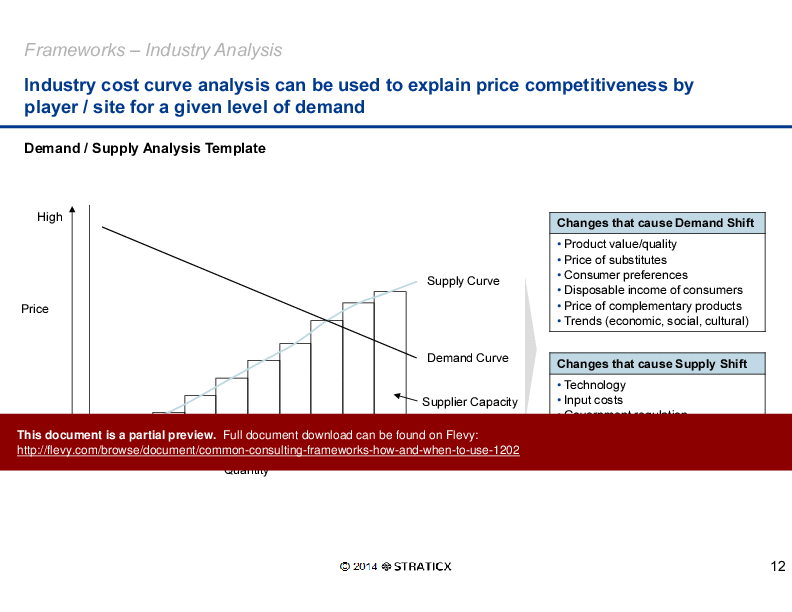
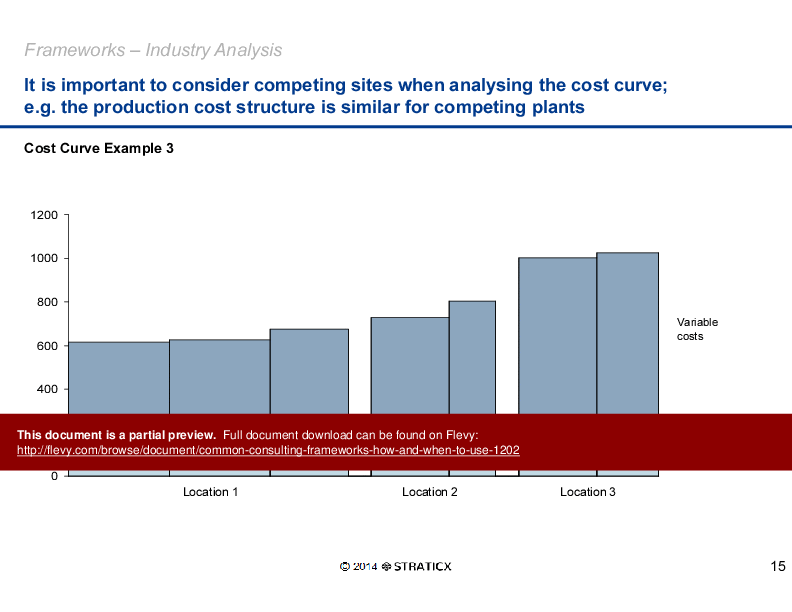
The document also explores the Industry Era Analysis, with a detailed case study on the US airline industry. It examines strategic paradigms, key events, and major players across different regulatory periods. This historical perspective is invaluable for understanding how industry shifts impact competitive strategies and market positioning over time. The inclusion of cost curve analysis further aids in explaining price competitiveness and production cost structures.
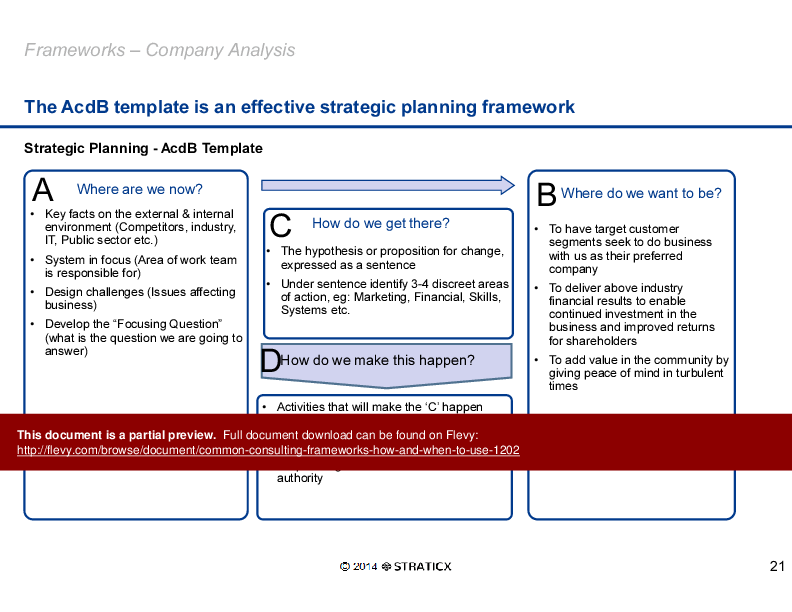
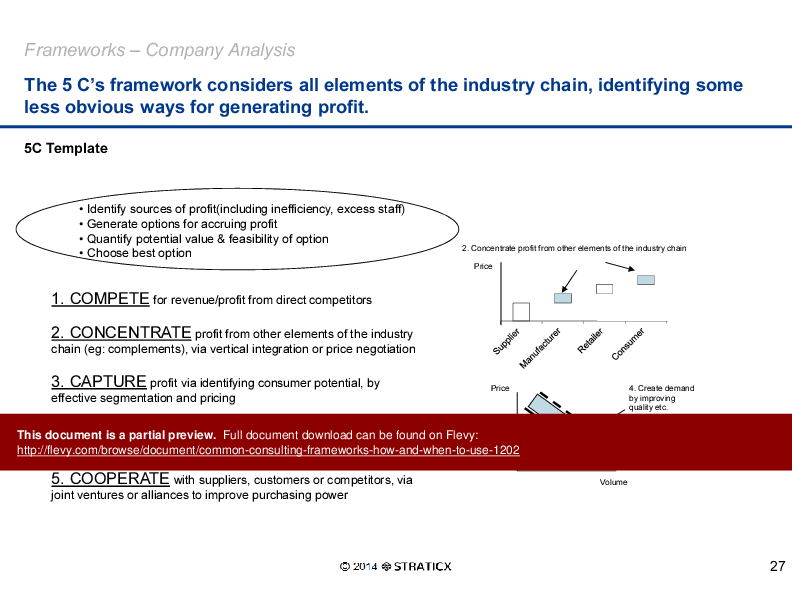
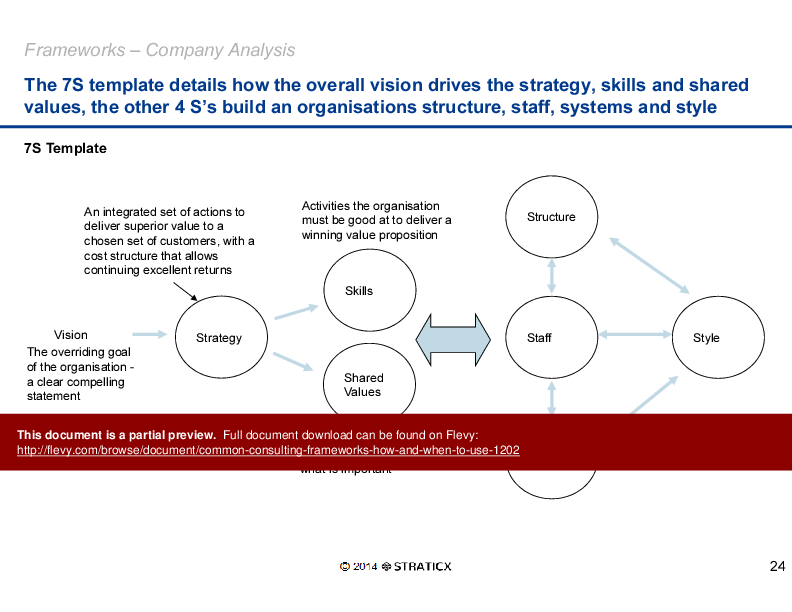
For company analysis, the document introduces frameworks like the AcdB template for strategic planning and the 7S template for organizational alignment. These tools help in defining current status, setting future goals, and devising actionable plans. The 5C's framework is particularly useful for identifying profit generation opportunities across the industry chain. Stakeholder analysis is also covered, providing insights into managing pressures from various constituents and leveraging degrees of freedom available to the company.
Got a question about the product? Email us at support@flevy.com or ask the author directly by using the "Ask the Author a Question" form. If you cannot view the preview above this document description, go here to view the large preview instead.
PRESENTATION DEEP DIVE ANALYSIS
This deep-dive analysis was generated from the full 43-slide PowerPoint presentation.
STRATEGY FRAMEWORKS PPT TEMPLATES
Source: Best Practices in Strategy Frameworks, Consulting Training, Company Analysis, Bain PowerPoint PowerPoint Slides: Common Consulting Frameworks (How and When to Use) PowerPoint (PPTX) Presentation Slide Deck, STRATICX
