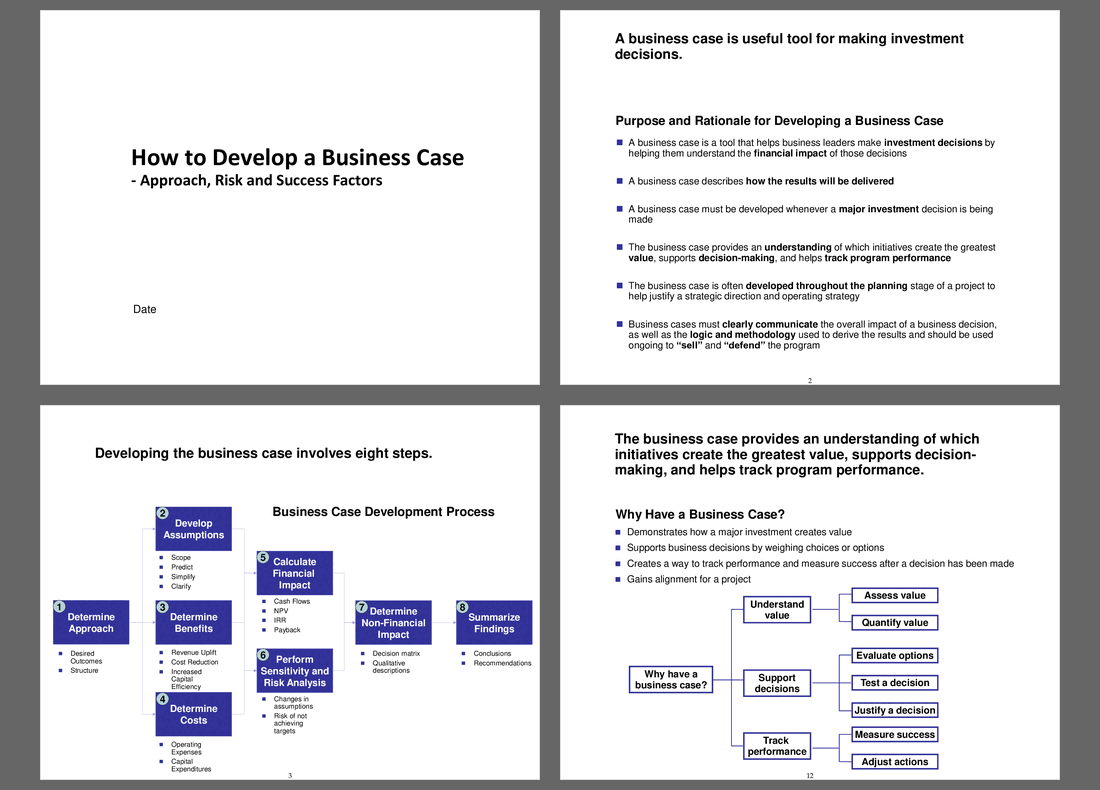

How to Develop a Business Case – PowerPoint PPT Template
PowerPoint (PPT) 105 Slides
BUSINESS CASE DEVELOPMENT PPT TEMPLATE DESCRIPTION
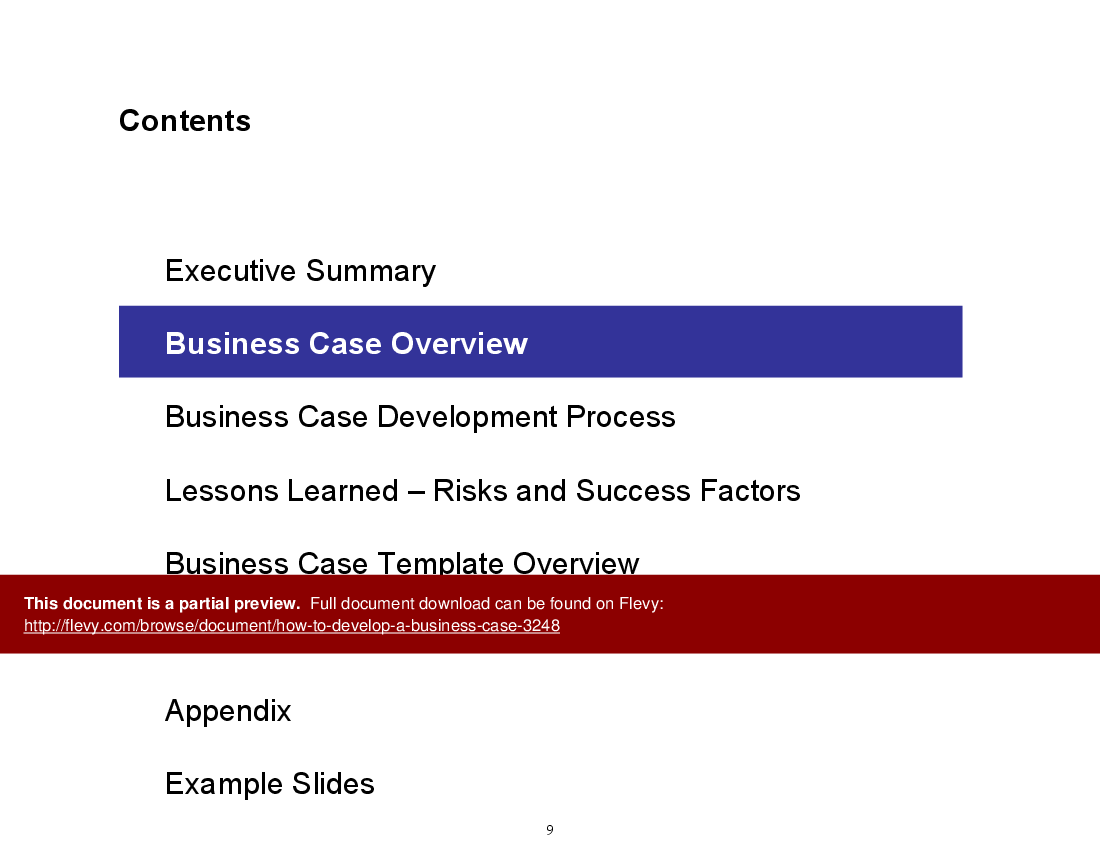
This deck include 7 main sections:
• Executive Summary
• Business Case Overview
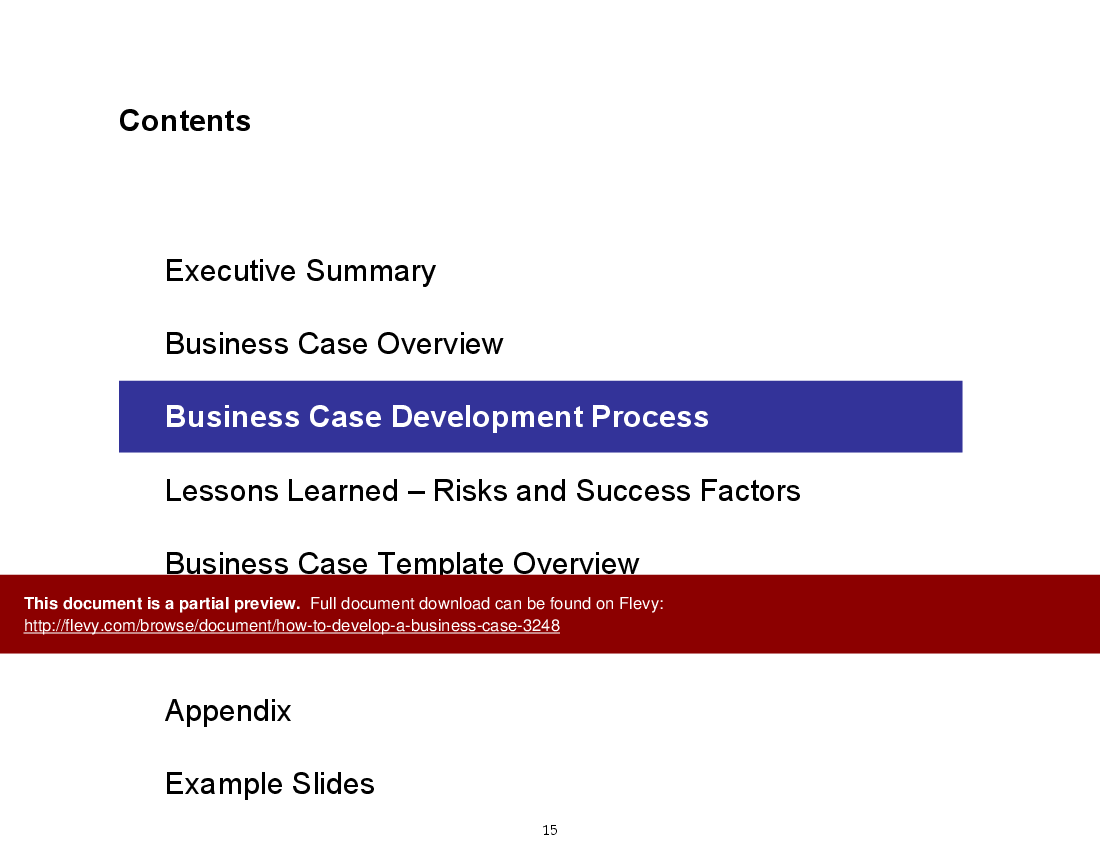
• Business Case Development Process
• Lessons Learned – Risks and Success Factors
• Business Case Template Overview
• Glossary
• Appendix and Example Slides
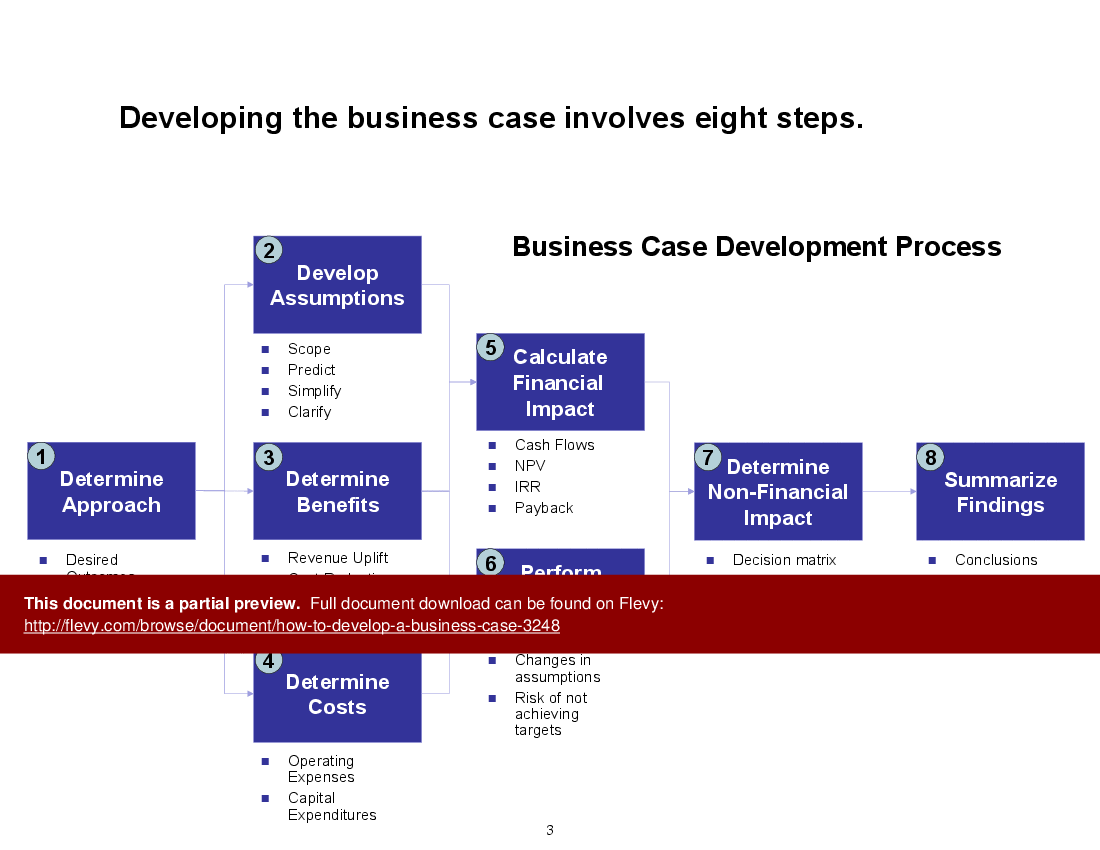
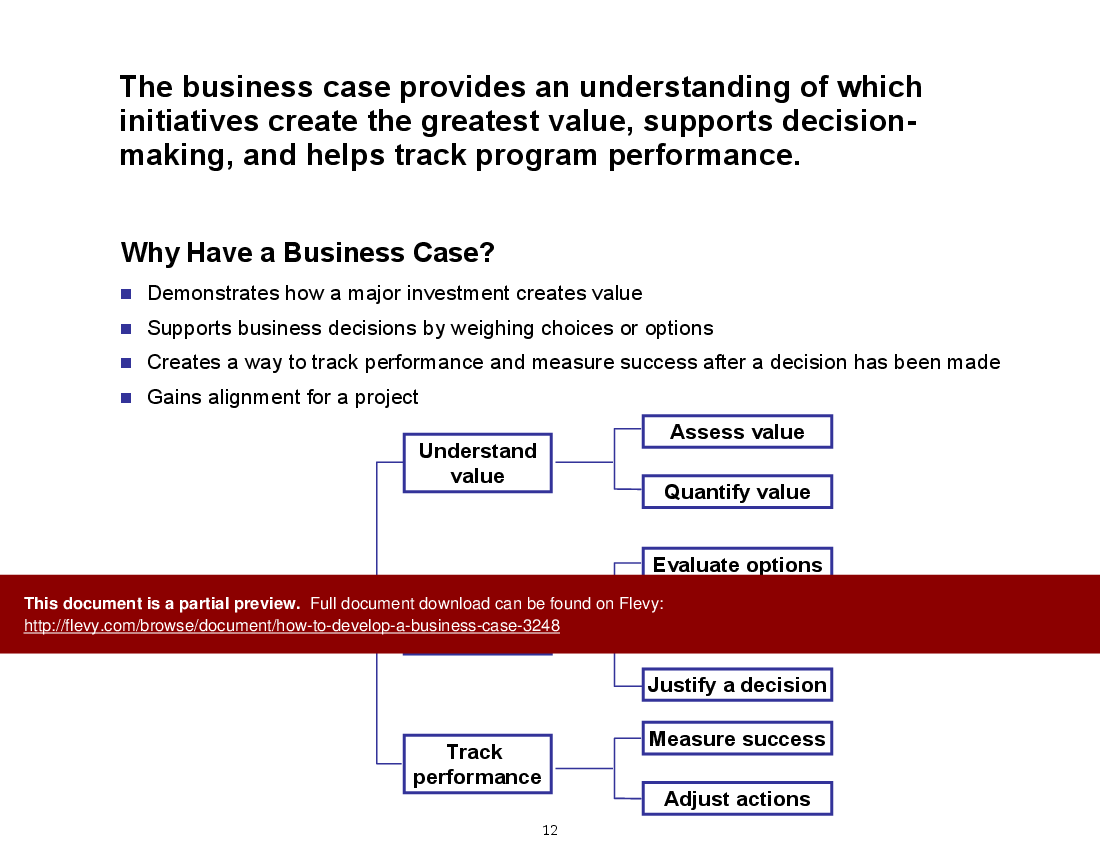
A business case is a tool that helps business leaders make investment decisions by helping them understand the financial impact of those decisions. A business case describes how the results will be delivered. A business case must be developed whenever a major investment decision is being made. The business case provides an understanding of which initiatives create the greatest value; supports decision-making; and helps track program performance.
The business case is often developed throughout the planning stage of a project to help justify a strategic direction and operating strategy. Business cases must clearly communicate the overall impact of a business decision; as well as the logic and methodology used to derive the results and should be used ongoing to "sell" and "defend" the program.
This deck is complemented by a companion document the "Business Case Template" Excel (separate product listing), which provides a step-by-step methodology for developing a high level business case. Explicit instructions on how to use this financial model are in the "Business Case Template Overview" section of this presentation
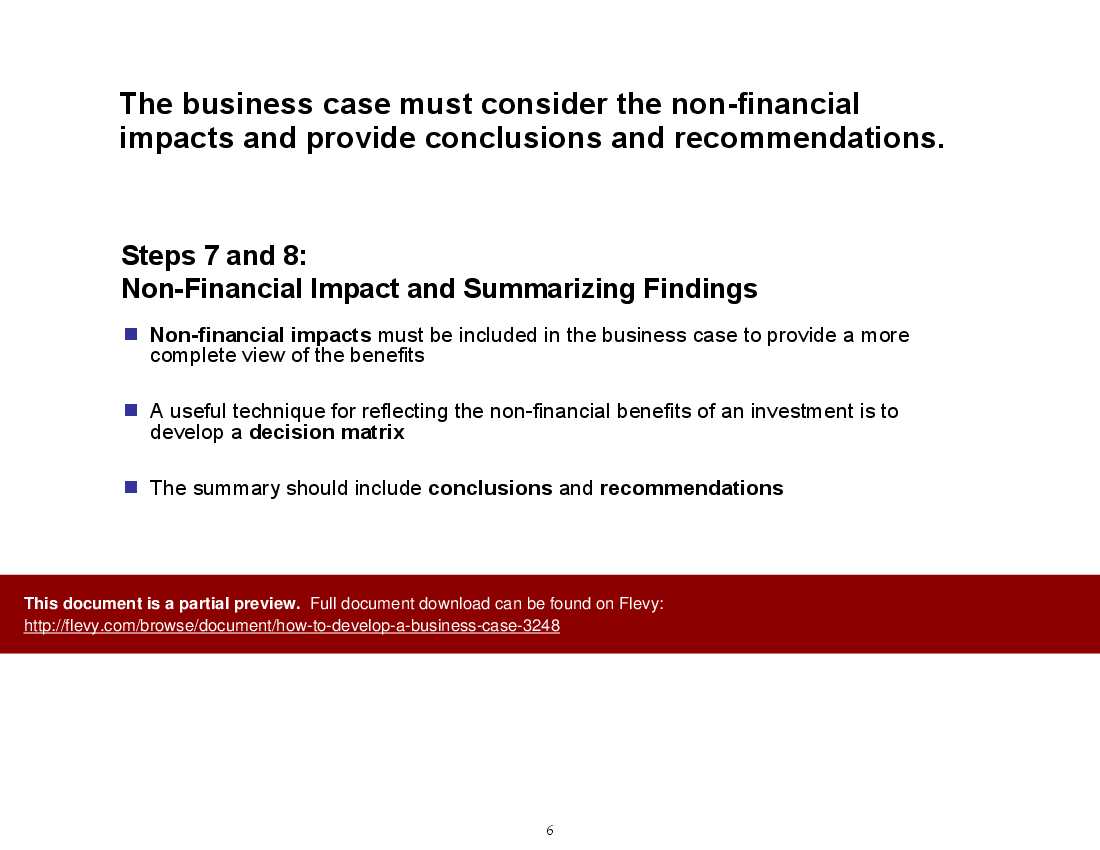
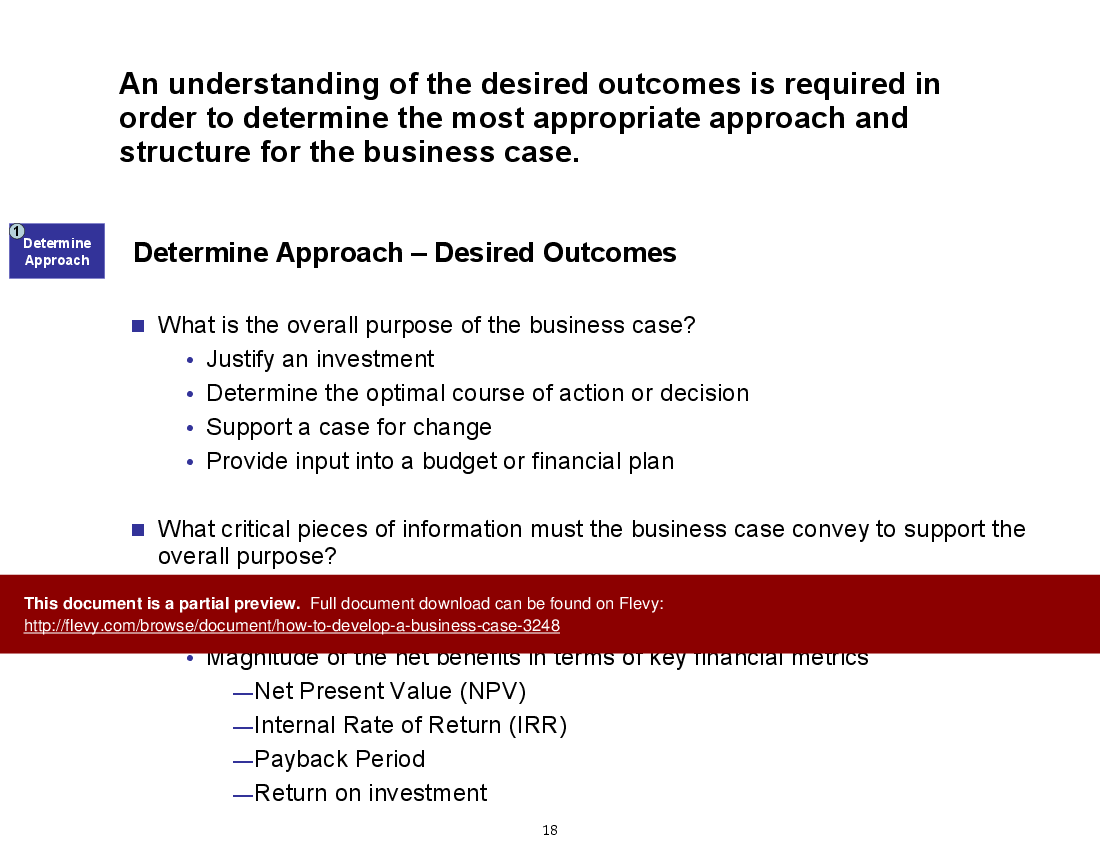
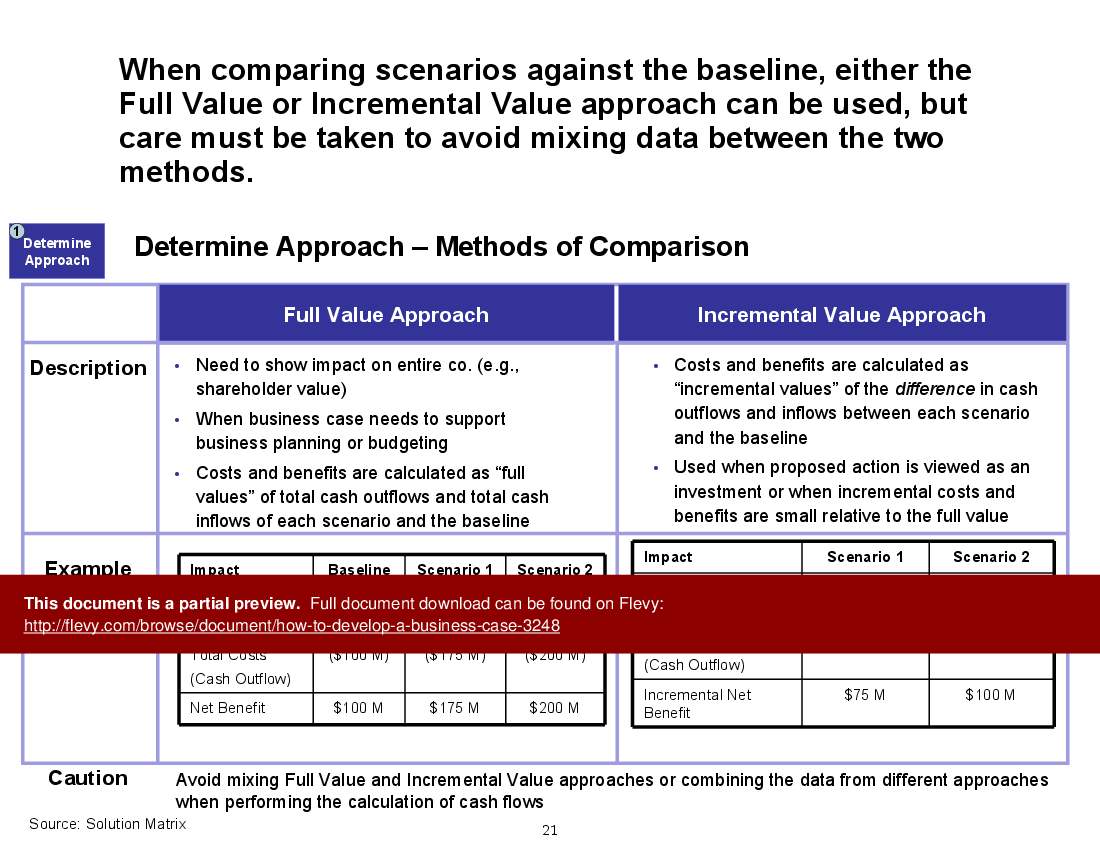
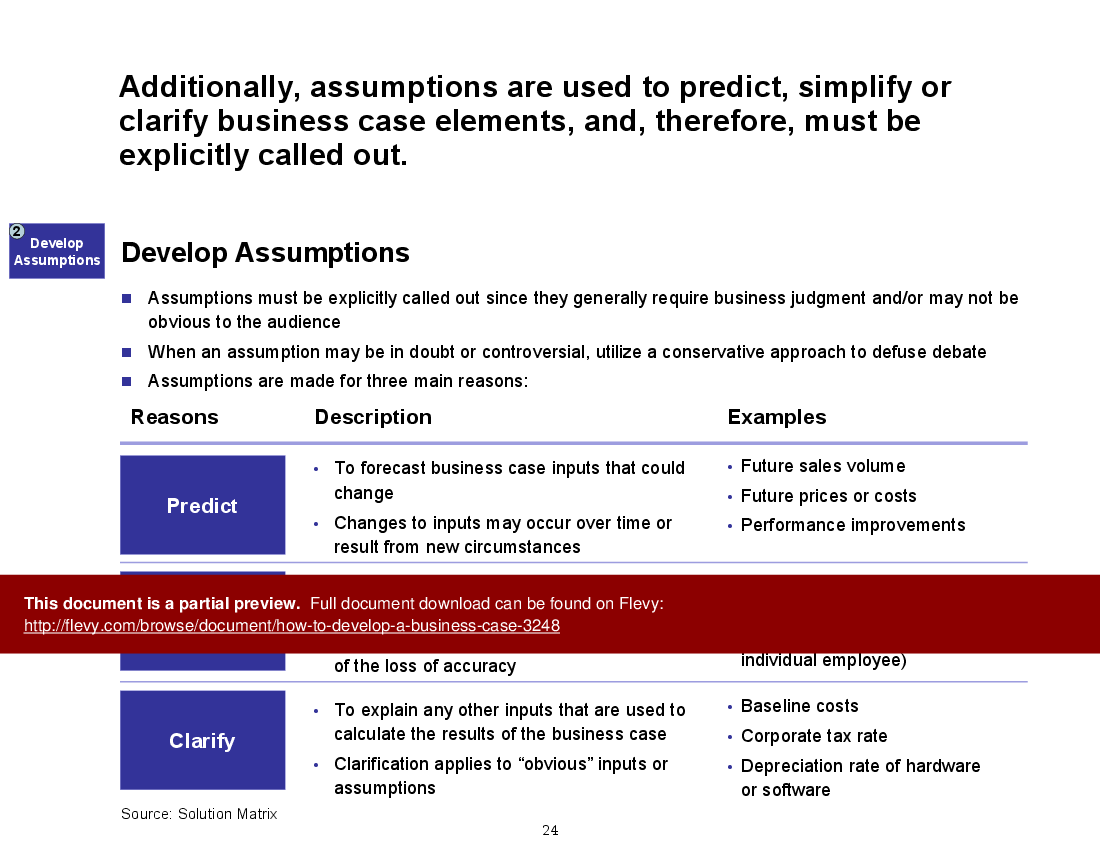
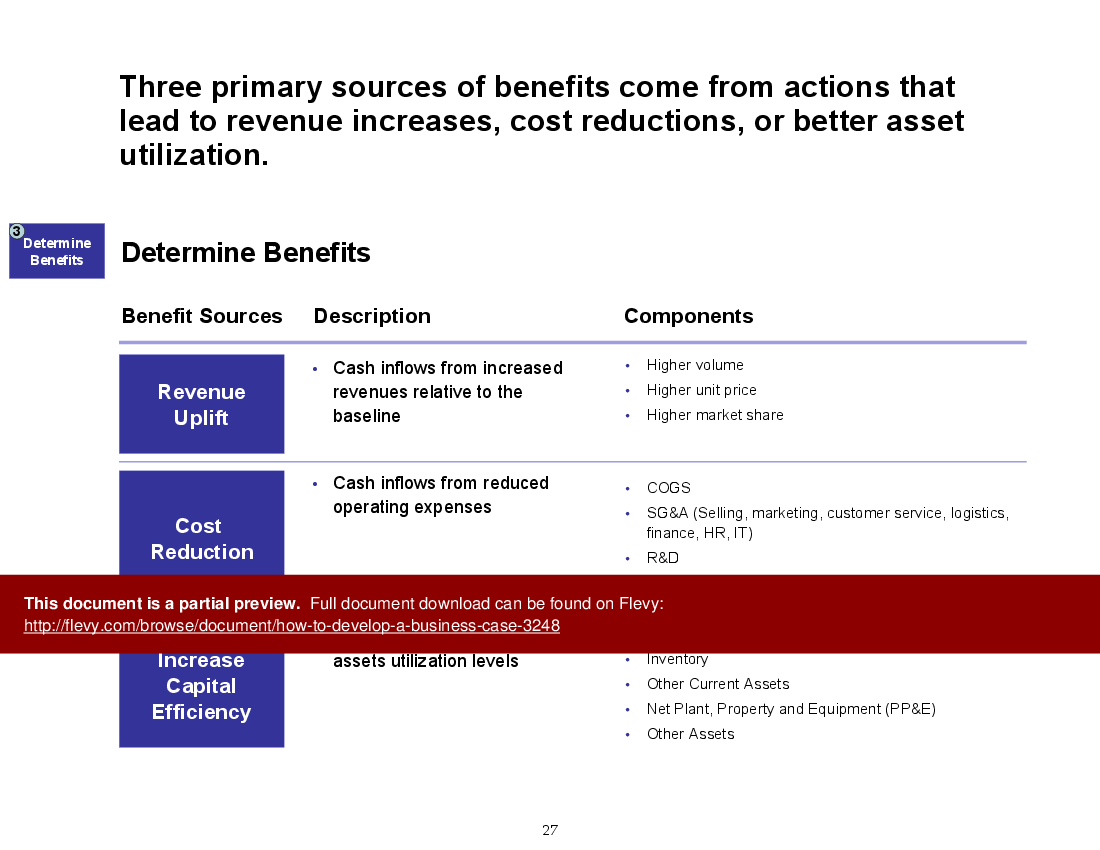
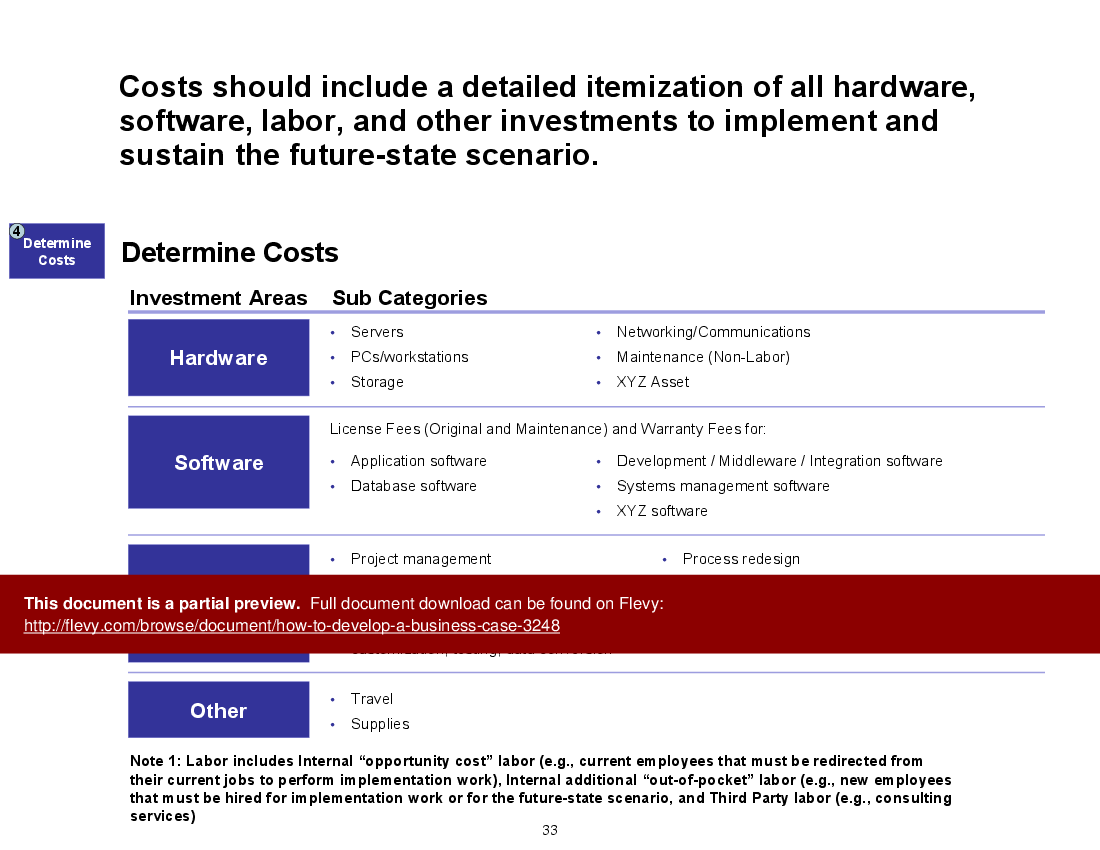
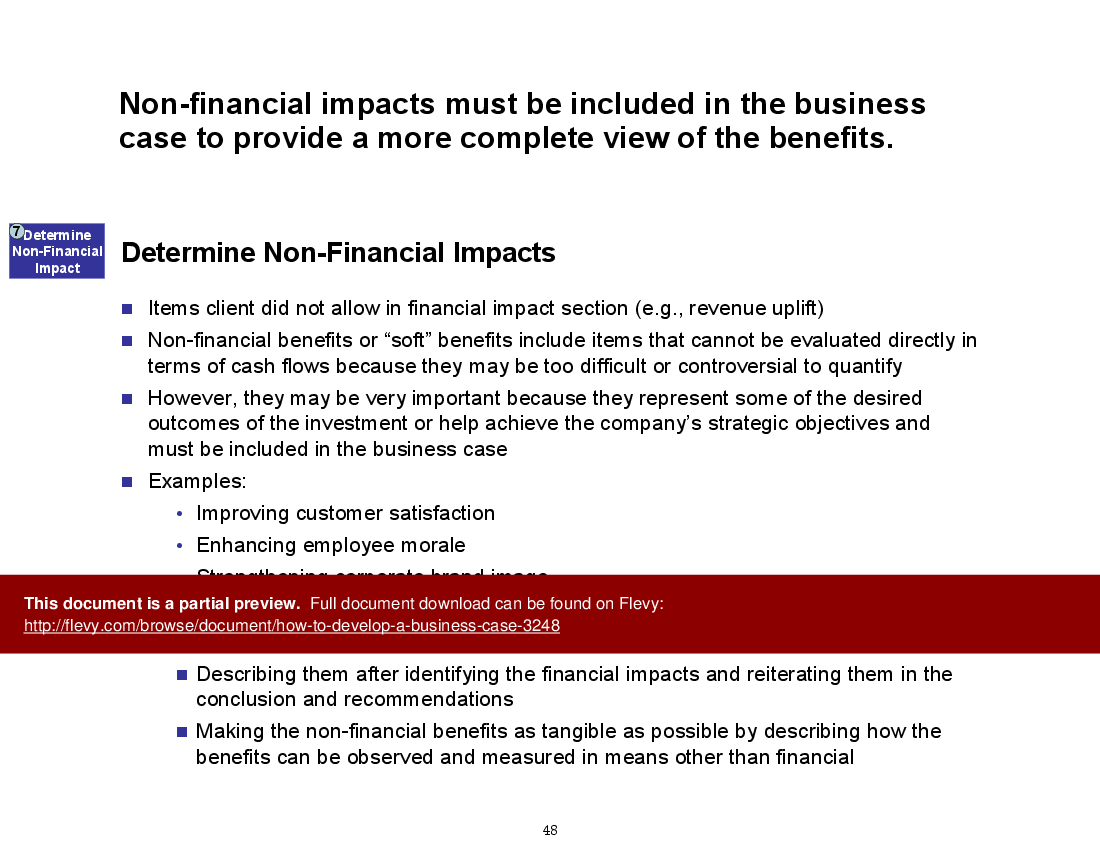
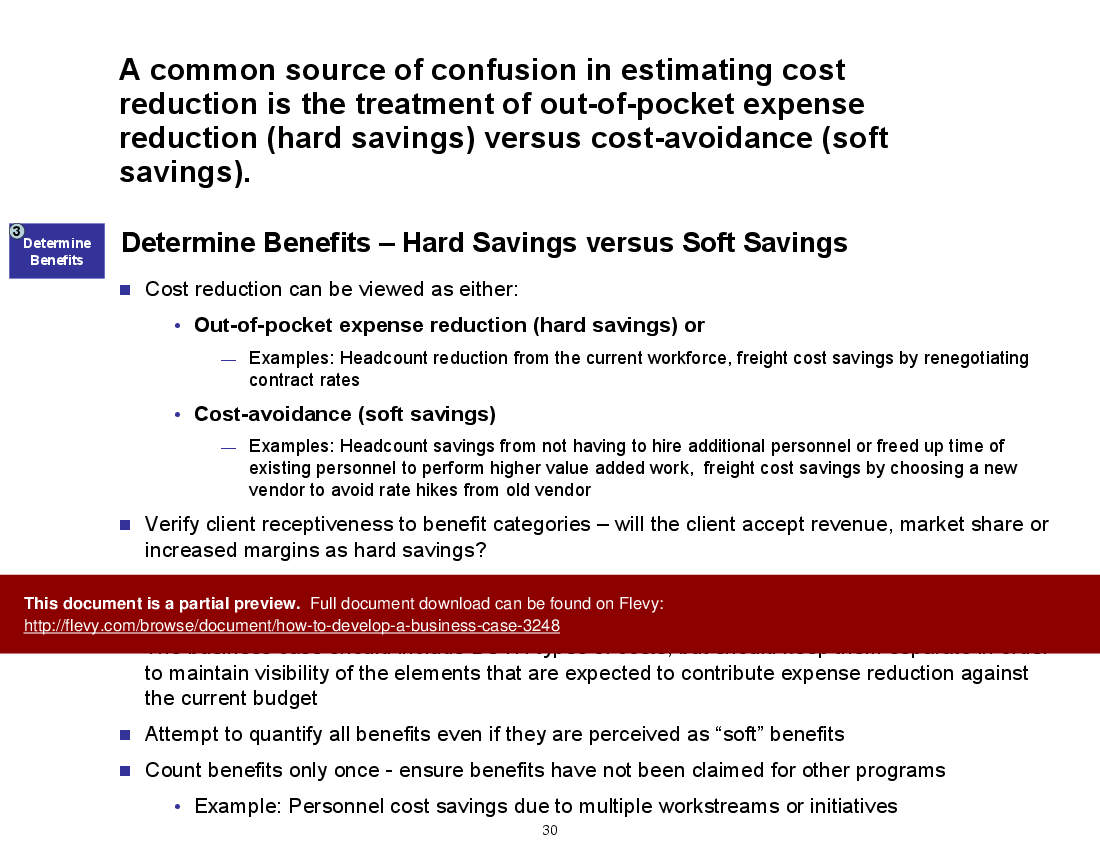
The document also delves into the importance of considering non-financial impacts, such as customer satisfaction and employee morale, to provide a comprehensive view of the benefits. It emphasizes the need for a decision matrix to reflect these benefits effectively. The presentation outlines the eight-step process for developing a business case, including determining approach, developing assumptions, and calculating financial impact. It also highlights the necessity of a detailed itemization of costs, including hardware, software, and labor, to sustain the future-state scenario. This structured approach ensures that all aspects of the business case are meticulously analyzed and presented.
Got a question about the product? Email us at support@flevy.com or ask the author directly by using the "Ask the Author a Question" form. If you cannot view the preview above this document description, go here to view the large preview instead.
PRESENTATION DEEP DIVE ANALYSIS
This deep-dive analysis was generated from the full 105-slide PowerPoint presentation.
BUSINESS CASE DEVELOPMENT PPT TEMPLATES
Source: Best Practices in Business Case Development, Business Case Example PowerPoint Slides: How to Develop a Business Case PowerPoint (PPT) Presentation Slide Deck, Documents & Files
