
Inventory at Multiple Locations Tracker Dashboard – Excel XLSX
Excel (XLSX) + Zip archive file (ZIP)
VIDEO DEMO
INVENTORY MANAGEMENT EXCEL DESCRIPTION
This is a way to track the value and count of units of inventory and balances at a warehouse and at multiple locations (up to 500 total). The data entry is generic and straightforward so it can be compatible with nearly any inventory management use case that has to keep track of where inventory is and how much.
Inventory movements happen with a transaction entry. Those entries are moved with the push of a button to a database tab (editable if you make a data entry error). The database tab is queried with formulas in order to show automated reports about where the inventory is and how much is at the warehouse / locations as well as monthly movements over time.
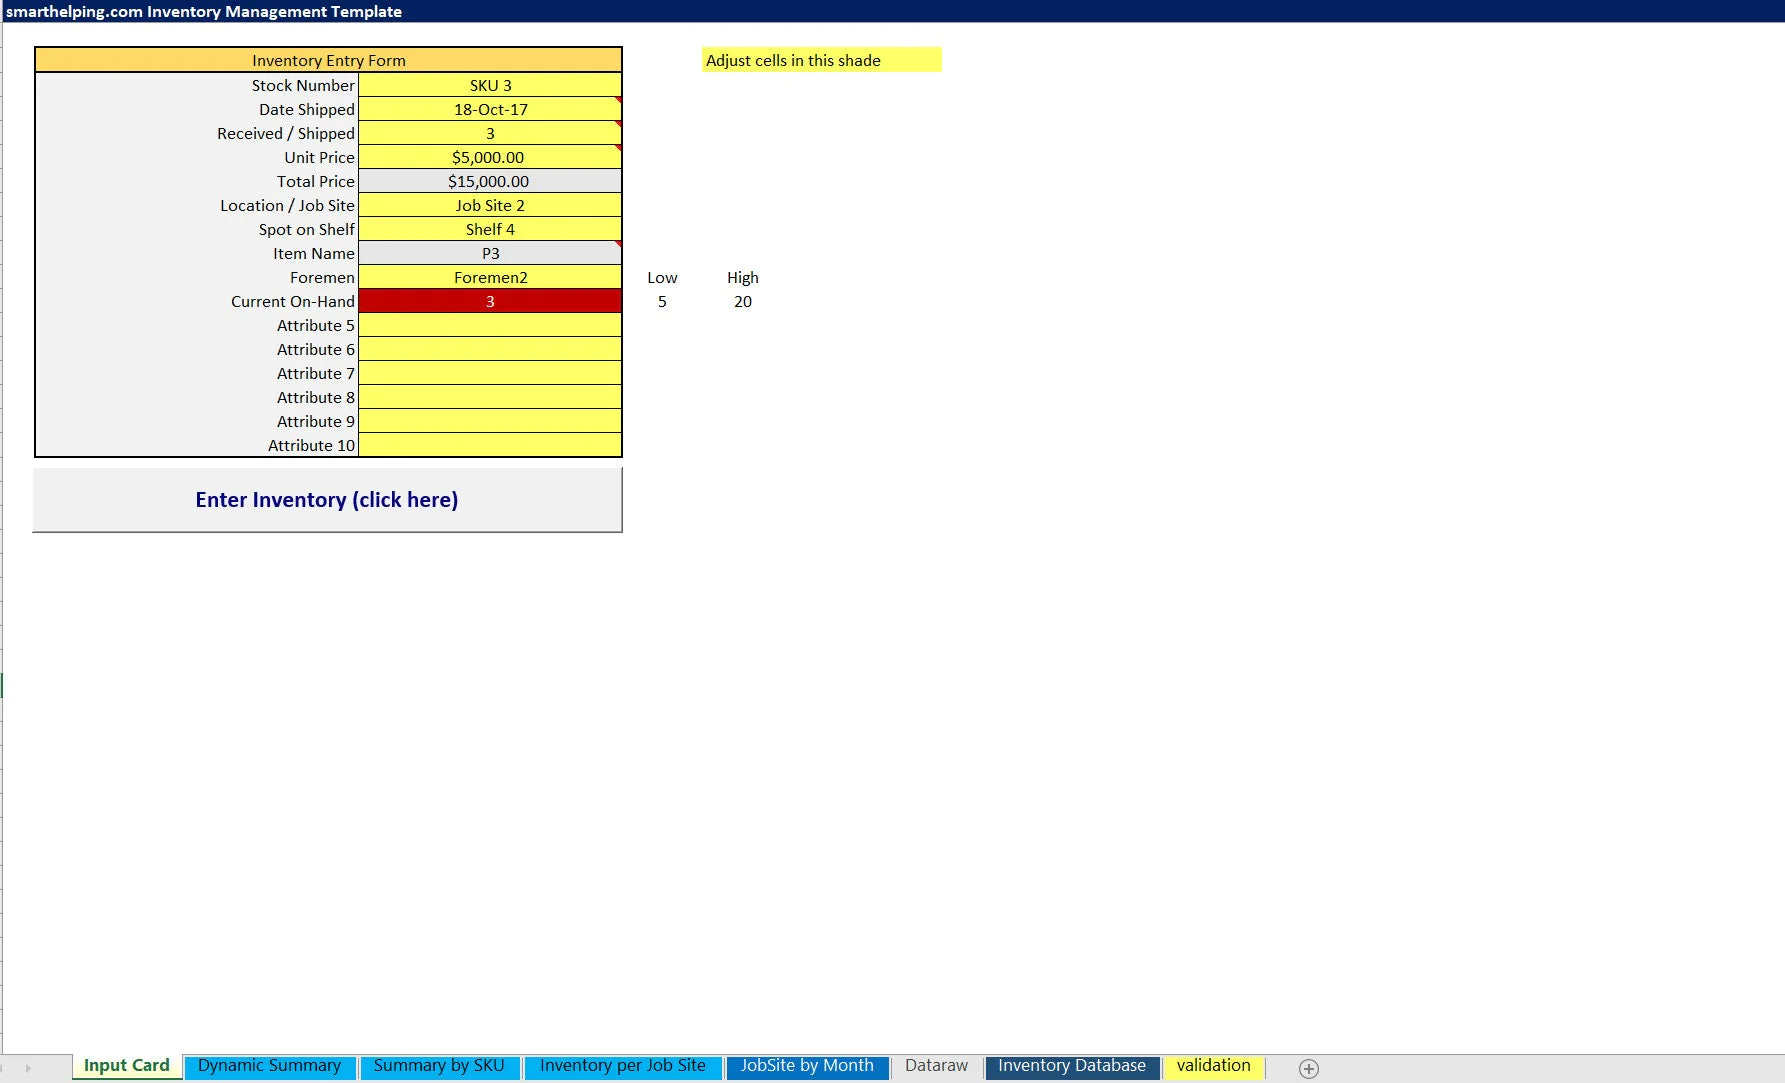
Input Data:
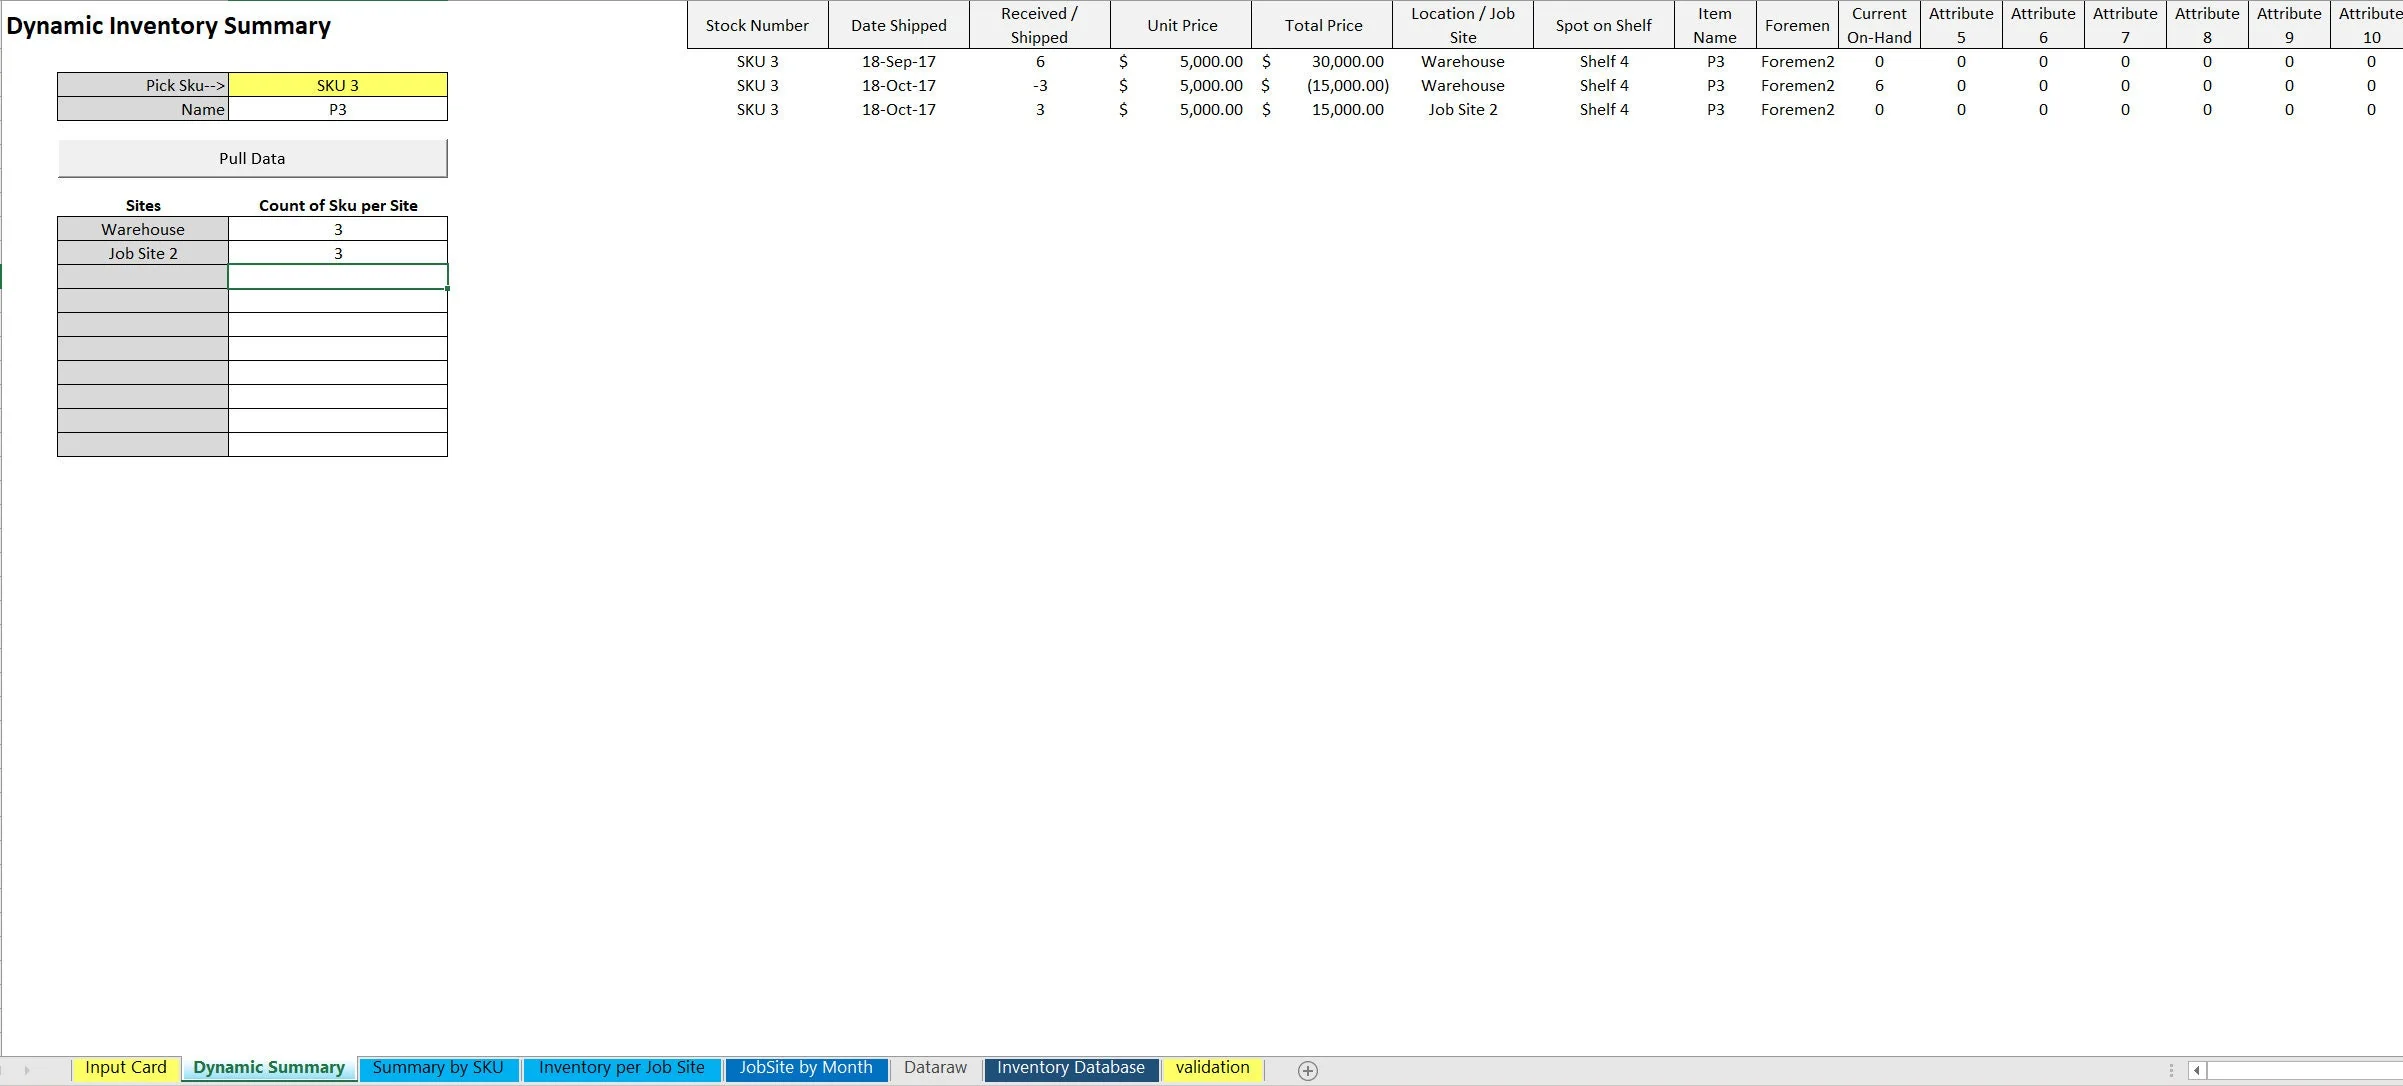
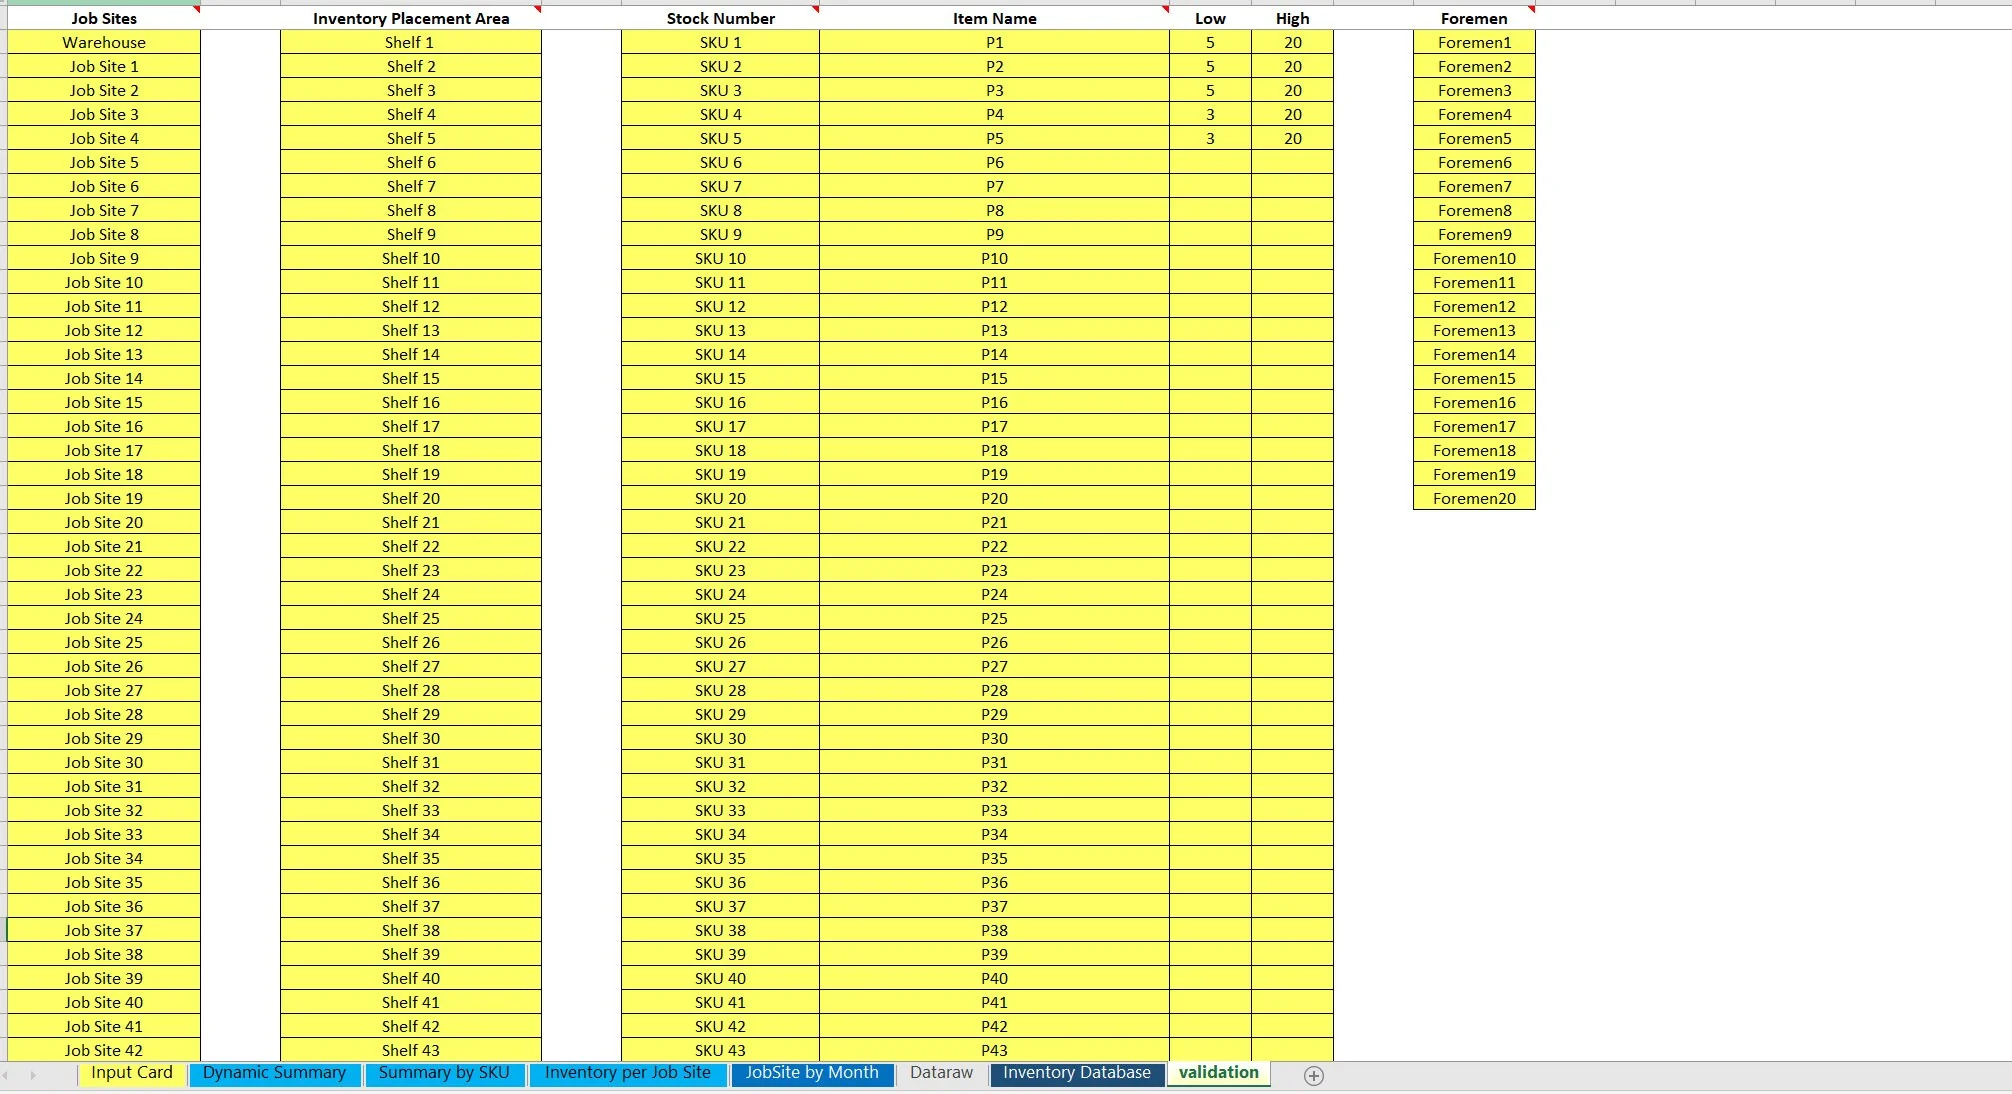
• Stock Number (dropdown per defined validation lists)
• Date Shipped
• # of Units Received / Shipped Unit Price
• Total Price
• Location / Job Site (dropdown per defined validation lists)
• Spot on Shelf (dropdown per defined validation lists)
• Item Name (automated formula based on defined names for each SKU on the validation tab)
• Foremen (dropdown)
• Current On-Hand (formula based on real-time data prior to inventory transaction at hand)
• Attribute 5
• Attribute 6
• Attribute 7
• Attribute 8
• Attribute 9
• Attribute 10
There are multiple summary tabs that let the user dive deeper into what has happened with inventory.
Reports include:
Dynamic Summary – Users can pick a SKU / Stock Item and then hit the ‘Pull Data' button to see all transactions that have happened for that SKU as well as the count of units that are at the warehouse / up to 9 other locations at once. If you want to report the inventory balance at more locations, the formulas can simply be pulled down on this tab as far as you want.
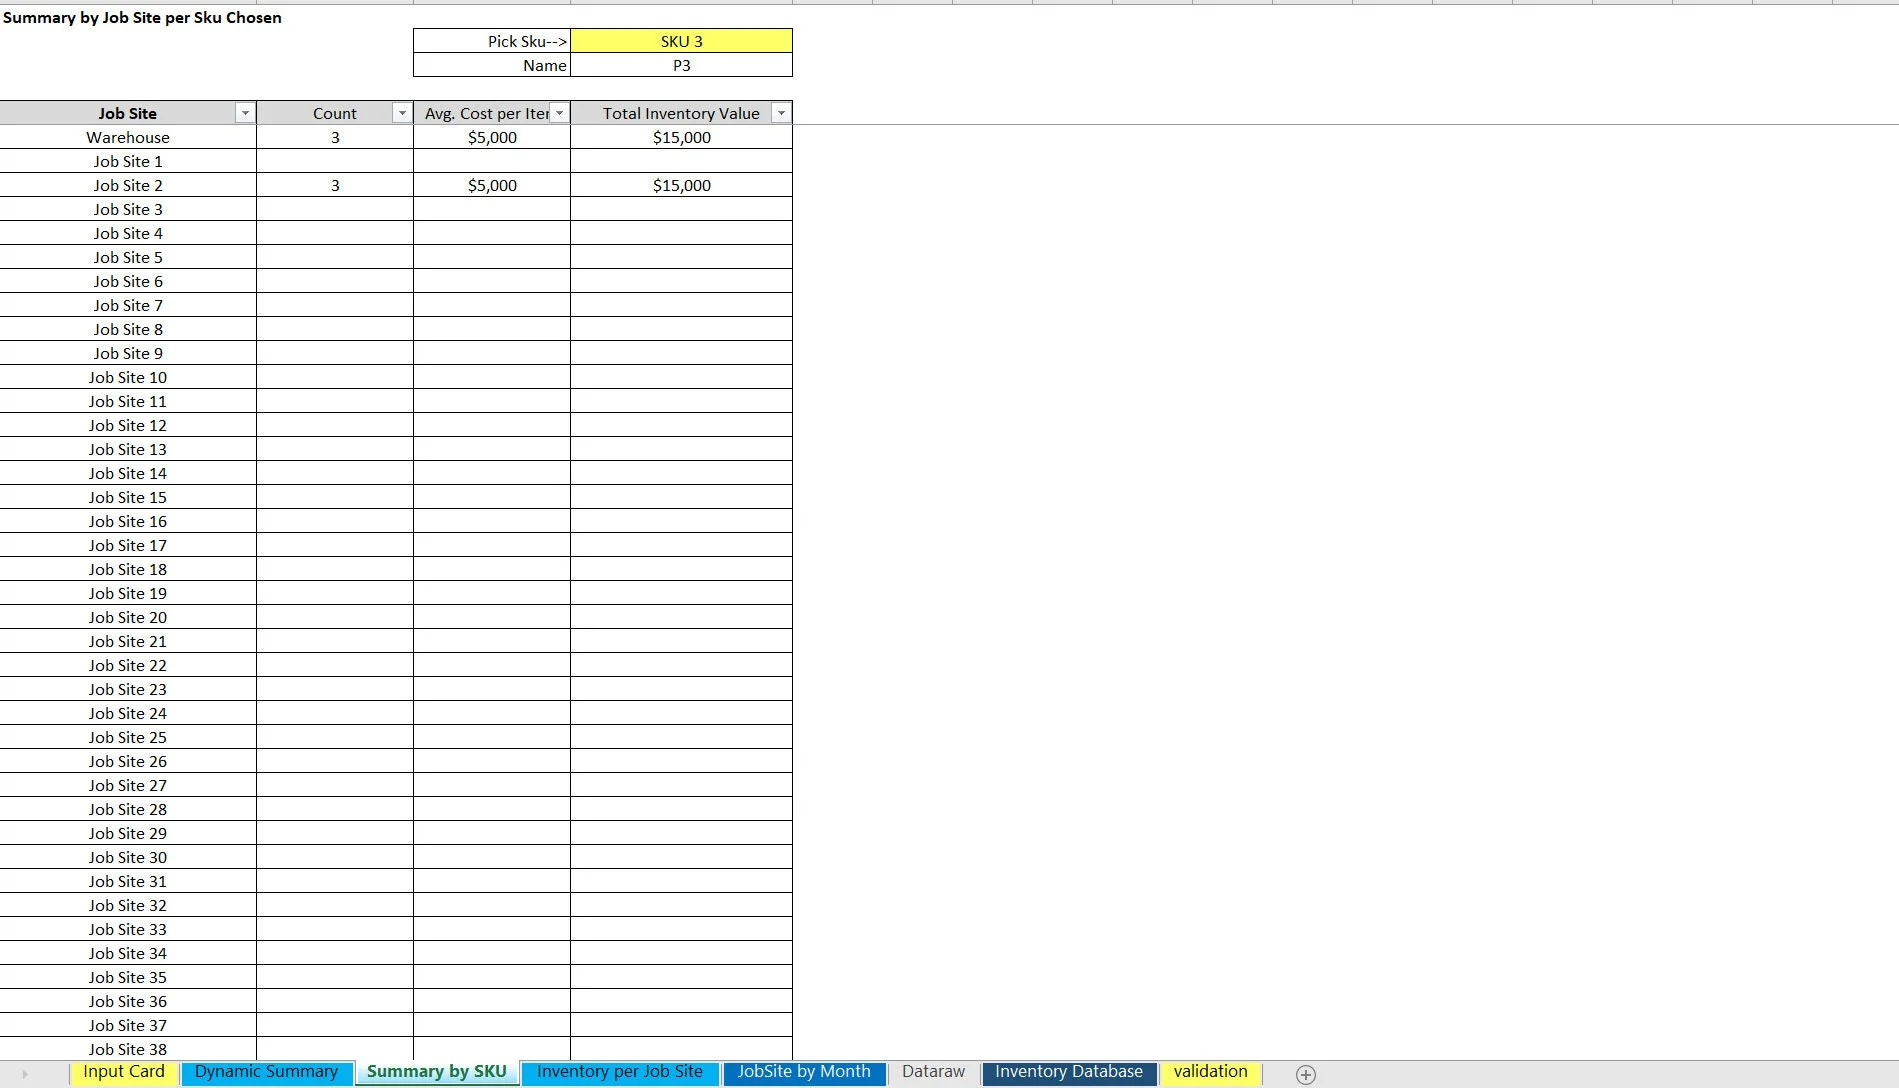
Summary by SKU – This is a static report that shows all 500 locations and based on the SKU selected, it will show the total units, value per unit, and total value of that inventory at each location.
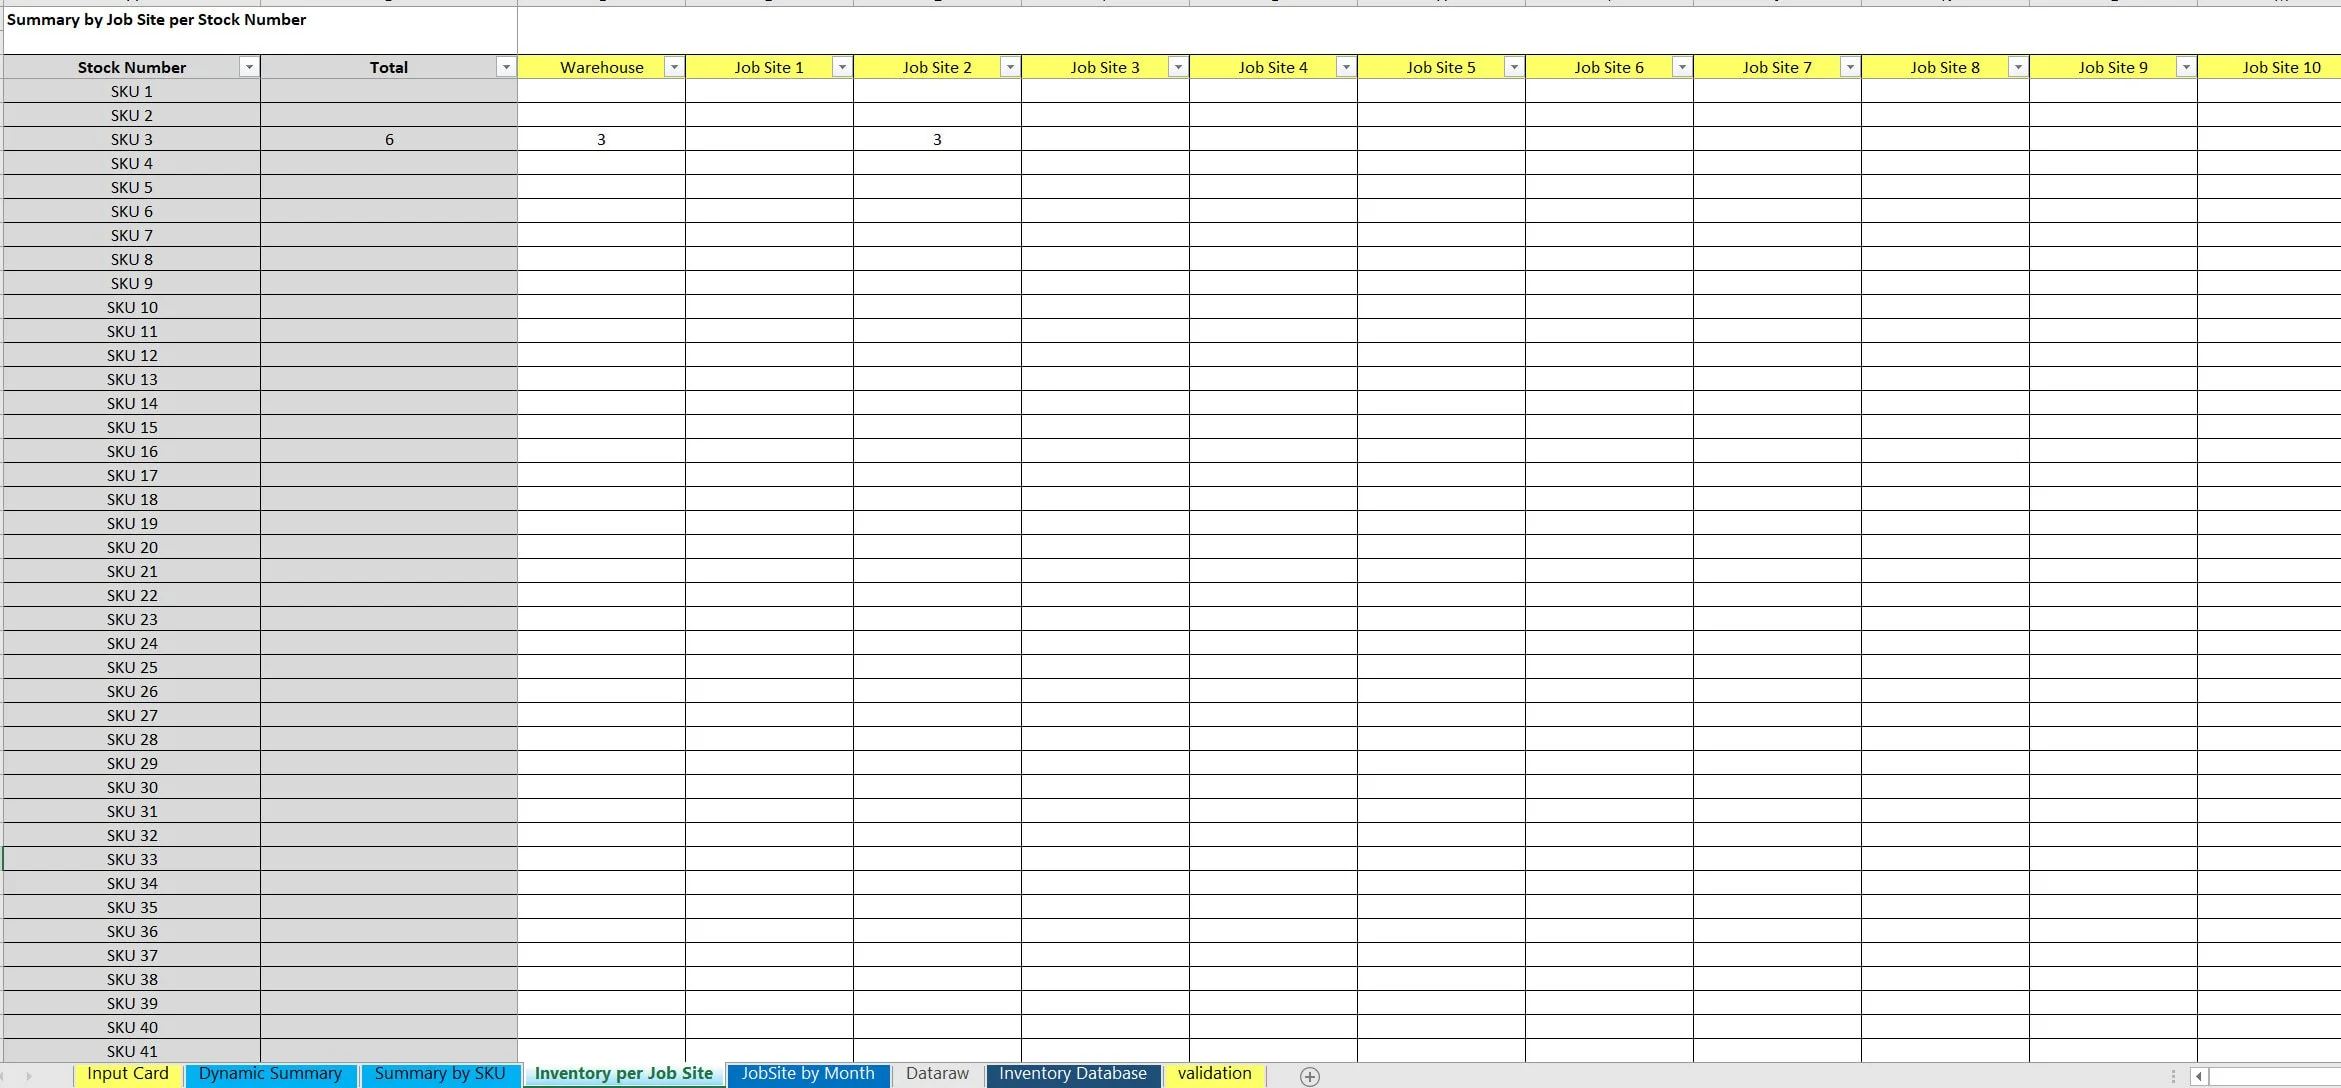
Inventory per Job Site – This lets the user see a cross section of every single SKU and the # of units of each SKU that are in up to 20 locations. The user can report on more than 20 locations by dragging the formulas over to more columns and adding location names to row 3 if desired.
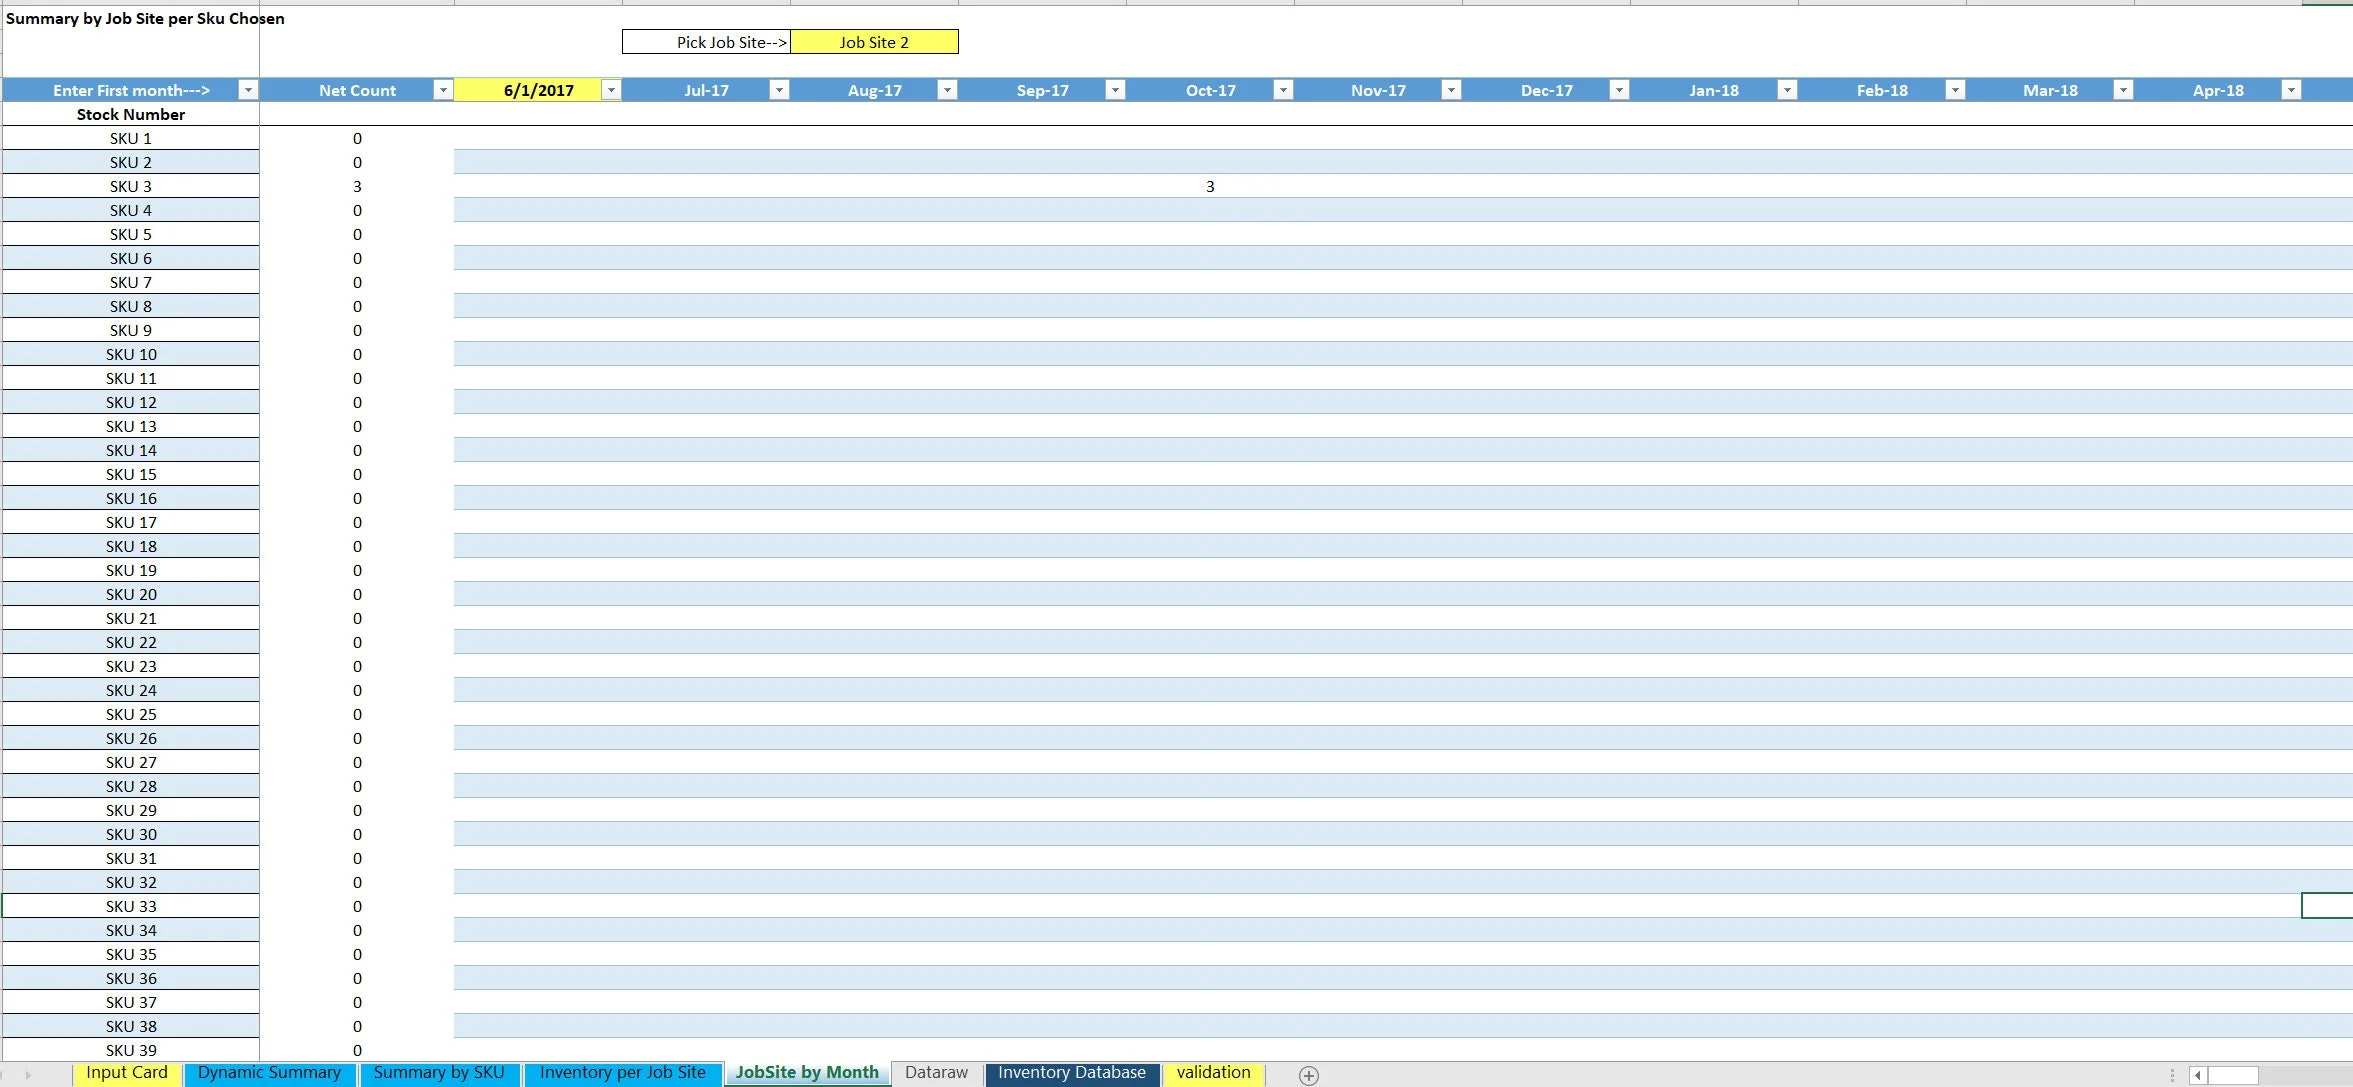
Job Site by Month – This shows a running monthly summary by SKU for a selected location for up to 68 months at once. Be sure not to change any of the tab names as that will break the Macro.
Also, the most important tab is probably the ‘inventory per job site' tab as that will give you a full picture of inventory. If you use more than 20 locations, the formulas are really easy to expand. Just highlight the given row all the way down to the last SKU and then drag the formulas over to account for as many jobs sites as you use.
This was limited to 20 initially so the file was not too big, but it is still workable if you want to report on all SKUS across all 500 locations.
Got a question about the product? Email us at support@flevy.com or ask the author directly by using the "Ask the Author a Question" form. If you cannot view the preview above this document description, go here to view the large preview instead.
TOPIC FAQ
How can I record and move inventory transactions in a spreadsheet so reports update automatically?
Use a transaction-entry sheet where each movement (received or shipped) is entered and then pushed to a central, editable database with a, button. Formulas query that database to produce automated reports such as the Dynamic Summary and Inventory per Job Site, using the database tab.Which data fields are most important to capture for multi-location inventory tracking?
Capture a validated Stock Number dropdown, Date Shipped, Units Received/Shipped, Unit Price, Total Price, Location/Job Site dropdown, Spot on Shelf dropdown, Item Name (automated), Foremen dropdown, plus any custom attributes up to Attribute 10.What report types help show where inventory is across many locations?
Use a Dynamic Summary to pull transactions for a SKU and view counts at the warehouse and up to 9 other locations simultaneously, and use Summary by SKU to display total units and values across all configured locations, including support for up to 500 locations.How can I get a month-by-month view of inventory at a specific job site?
Implement a Job Site by Month report that aggregates transactions into a running monthly summary by SKU for a selected location; this template supports a time span of up to 68 months and relies on intact tab names for its macro to function.What should I look for when selecting a multi-location inventory spreadsheet template?
Prioritize templates that record transactions to an editable database, use validated dropdowns for SKU and location, generate formula-driven summaries, allow expanding location columns, and include a data-pull macro or, button; these features enable scalability up to 500 locations.What level of Excel skill is required to use a template like this effectively?
Basic-to-intermediate Excel skills: entering validated dropdowns, pressing a Pull Data, button to move transactions to a database, editing the database tab if needed, and expanding report formulas by dragging; no advanced coding is required beyond using the provided macro.I manage materials for multiple construction sites — how can a template support job-site tracking?
Use the Inventory per Job Site tab to view a cross-section of every SKU and the units at up to 20 default locations (expandable by dragging formulas and adding location names). Include Foremen and Spot on Shelf fields to map materials to crews and locations.Are there hard limits on locations or time periods in spreadsheet trackers like this?
This tracker is designed for scale: it supports data entry across up to 500 total locations, a default Inventory per Job Site view for 20 locations (expandable by extending formulas), and Job Site by Month reporting for up to 68 months.Source: Best Practices in Inventory Management Excel: Inventory at Multiple Locations Tracker Excel (XLSX) Spreadsheet, Jason Varner | SmartHelping
ABOUT THE AUTHOR
I graduated in 2011 with a Bachelor's degree in Accounting and began my career as a financial analyst at a small chain of auto repair shops. After gaining valuable experience, I launched my own practice specializing in real estate underwriting, later expanding into general business modeling.
I honed my spreadsheet modeling expertise by completing over 400 projects on Upwork with a 100% success
... [read more]
Ask the Author a Question
You must be logged in to contact the author.
