
 Click main image to view in full screen.
Spend Analysis and Spend Cube Toolkit – PowerPoint PPTX Template
PowerPoint (PPTX) + Zip archive file (ZIP) 12 Slides


BENEFITS OF THIS DOWNLOADABLE POWERPOINT DOCUMENT
- Turn a raw ERP extract into a spend cube you can defend, with the twelve data defects tested for before any analysis begins.
- Stop understating concentration, risk and leverage by analysing unnormalised supplier records.
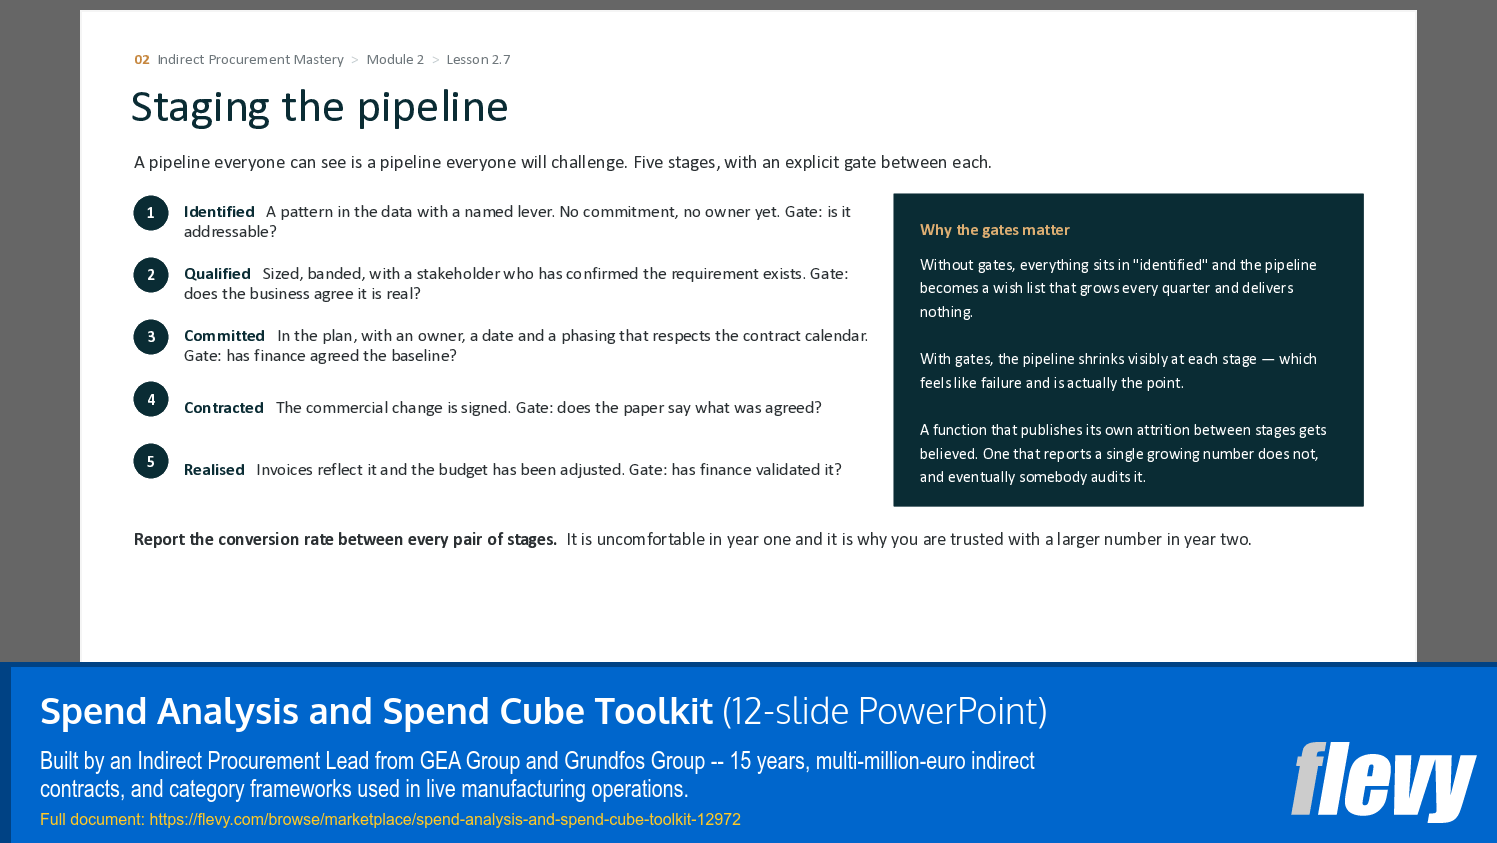
- Convert the analysis into a ranked, sized opportunity pipeline rather than a list of observations.
PROCUREMENT STRATEGY PPT TEMPLATE DESCRIPTION
Everything required to turn a raw ERP extract into a spend cube you can defend in front of a CFO, and then into a ranked opportunity pipeline.
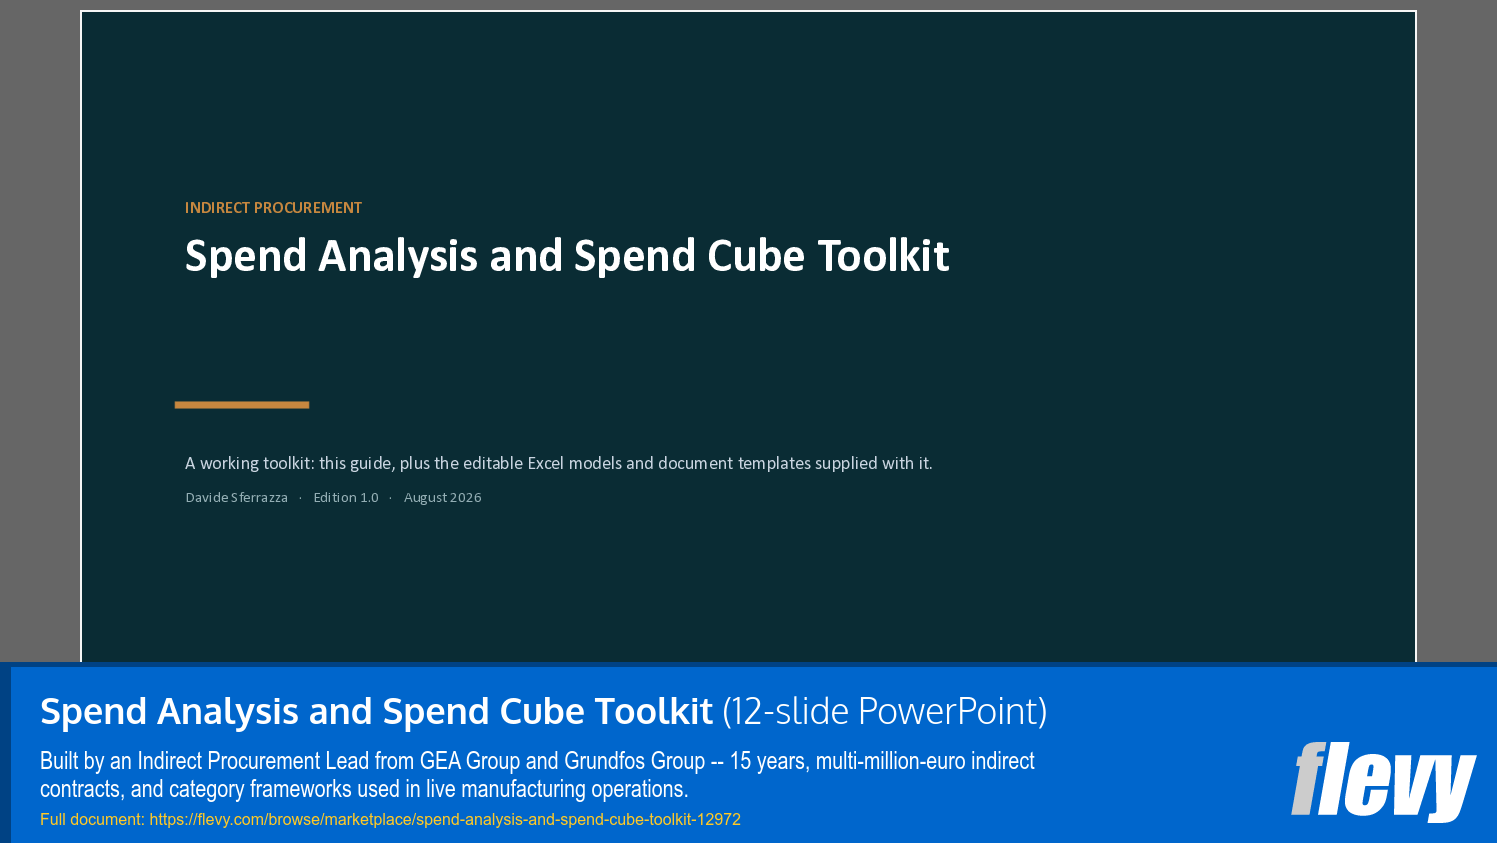
The part most spend analysis templates skip is data quality. This toolkit does not: the diagnostic tests for the twelve defects that a real extract contains – duplicate supplier records, hidden parent-child relationships, uncoded free-text lines, intercompany recharges, one-off settlements that are not addressable – before any analysis begins. Analysis run on unnormalised data systematically understates concentration, risk and leverage.
WHAT IS INCLUDED
• Spend Cube Builder (Excel) – supplier, category and business unit views with live pivot logic.
• Taxonomy Design Guide (Word) – UNSPSC versus custom versus hybrid, and how to choose a structure you will still be able to live with in three years.
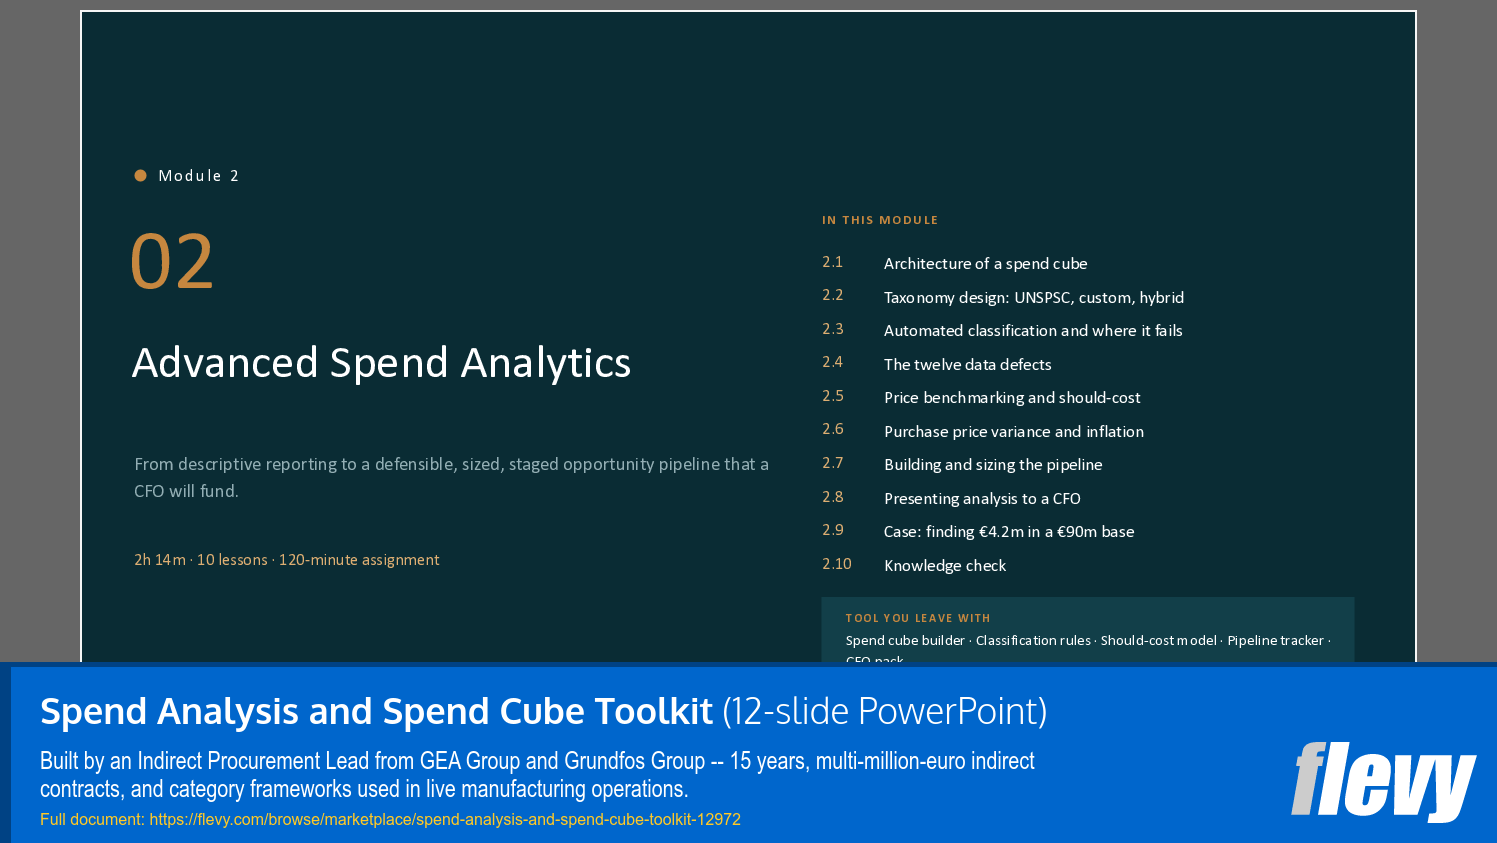
• Classification Rules Library (Excel) – rule-based classification, and an honest account of where automated classification fails.
• Data Quality Diagnostic (Excel) – the twelve defect tests, scored.
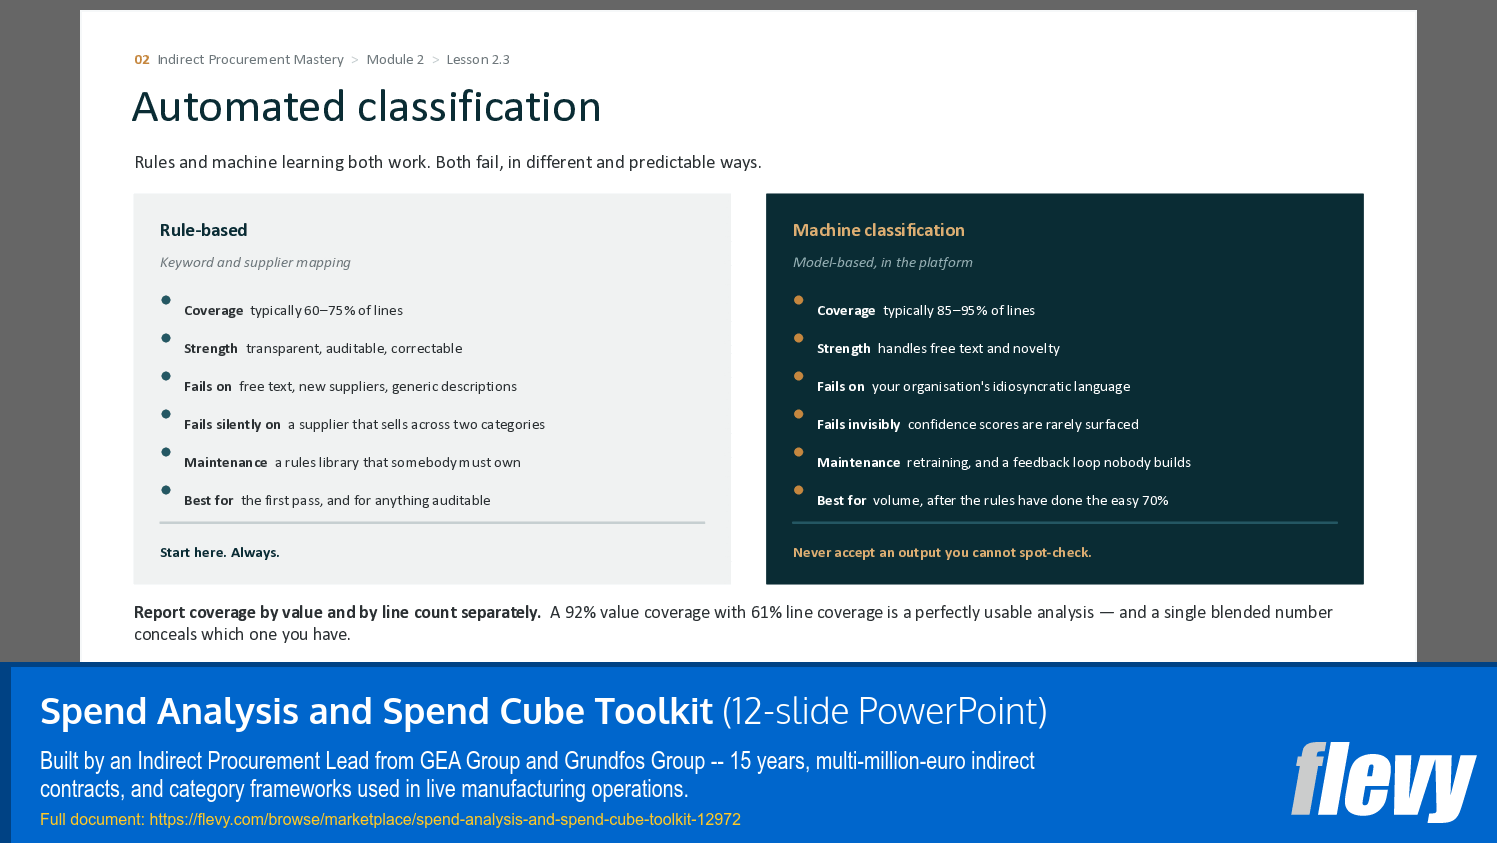
• Opportunity Pipeline Tracker (Excel) – sizing, stage-gating and prioritisation.
• Supplier Normalisation Checklist (Word) – the step everyone skips, in the order it has to be done.
WHO IT IS FOR
Procurement analysts and managers running a first spend analysis, and consultants who need a defensible method rather than a pivot table.
WHAT YOU RECEIVE
The primary document is a 12-slide guide covering the material above, in the same consulting layout used throughout this series: a headline that states the point, a body that evidences it, and a closing line that tells you what to do with it. It is designed to be read on its own or presented internally.
The accompanying archive contains 6 working files – Excel models with live formulas, Word templates and, where relevant, PowerPoint canvases. Nothing is password-protected or locked. A locked template a professional cannot adapt is worth nothing.
HOW THE SPREADSHEETS ARE BUILT
Every workbook uses the standard financial-modelling colour convention, applied consistently: blue text on a pale yellow fill is an input you type over, black text is a formula you should not overwrite, and green text is a reference to another sheet that must be changed at source. Each model carries one worked example row, shaded and italicised, which you delete once your own data is in, and an assumptions block at the top that should be read before any output below it is trusted. Print areas and page setup are configured on every sheet.
WHAT THIS IS NOT
This is educational and commercial material, not legal, tax or financial advice. Contractual content exists so that you can identify what matters commercially and ask better questions of whoever does advise you; contract law and regulatory obligations vary by jurisdiction. All case material is composite – figures are drawn from real engagements, but no case describes a single identifiable organisation and every company name is invented.
A licence page inside each file sets out the terms of use: unrestricted use for your own work and inside your own organisation, no resale or redistribution outside it.
Got a question about the product? Email us at support@flevy.com or ask the author directly by using the "Ask the Author a Question" form. If you cannot view the preview above this document description, go here to view the large preview instead.
Source: Best Practices in Procurement Strategy PowerPoint Slides: Spend Analysis and Spend Cube Toolkit PowerPoint (PPTX) Presentation Slide Deck, Davide Sferrazza
ABOUT THE AUTHOR

Indirect Procurement Lead, with 15 years spent in the categories most organisations manage least well: MRO, facilities, utilities and energy, marketing services, IT and software, professional services, logistics and CapEx.
That career has been inside manufacturing groups -- Pavan (GEA Group) and DAB Pumps (Grundfos Group) -- leading procurement transformation projects, negotiating
... [read more]
Ask the Author a Question
You must be logged in to contact the author.




























