
Agile Scrum Sprint Burn Down Chart & Burn Up Chart Template – Excel XLSM
Excel (XLSM)
BENEFITS OF THIS DOWNLOADABLE EXCEL DOCUMENT
- A quick and easy way to construct burn down and burn up tables and charts for your Agile Scrum project.
- Very useful for client and internal stakeholder reporting or as part of status reports especially when tools like Jira not installed.
- Editable and tailorable for your own Agile Scrum Project Sprint lengths and saves time building from scratch.
PROJECT MANAGEMENT EXCEL DESCRIPTION
An example MS Excel template (editable) Agile Burn Down Chart and Burn Up Chart where there is no access to Agile tools like Jira. Tailor this Excel spreadsheet as appropriate for your Agile Scrum project.
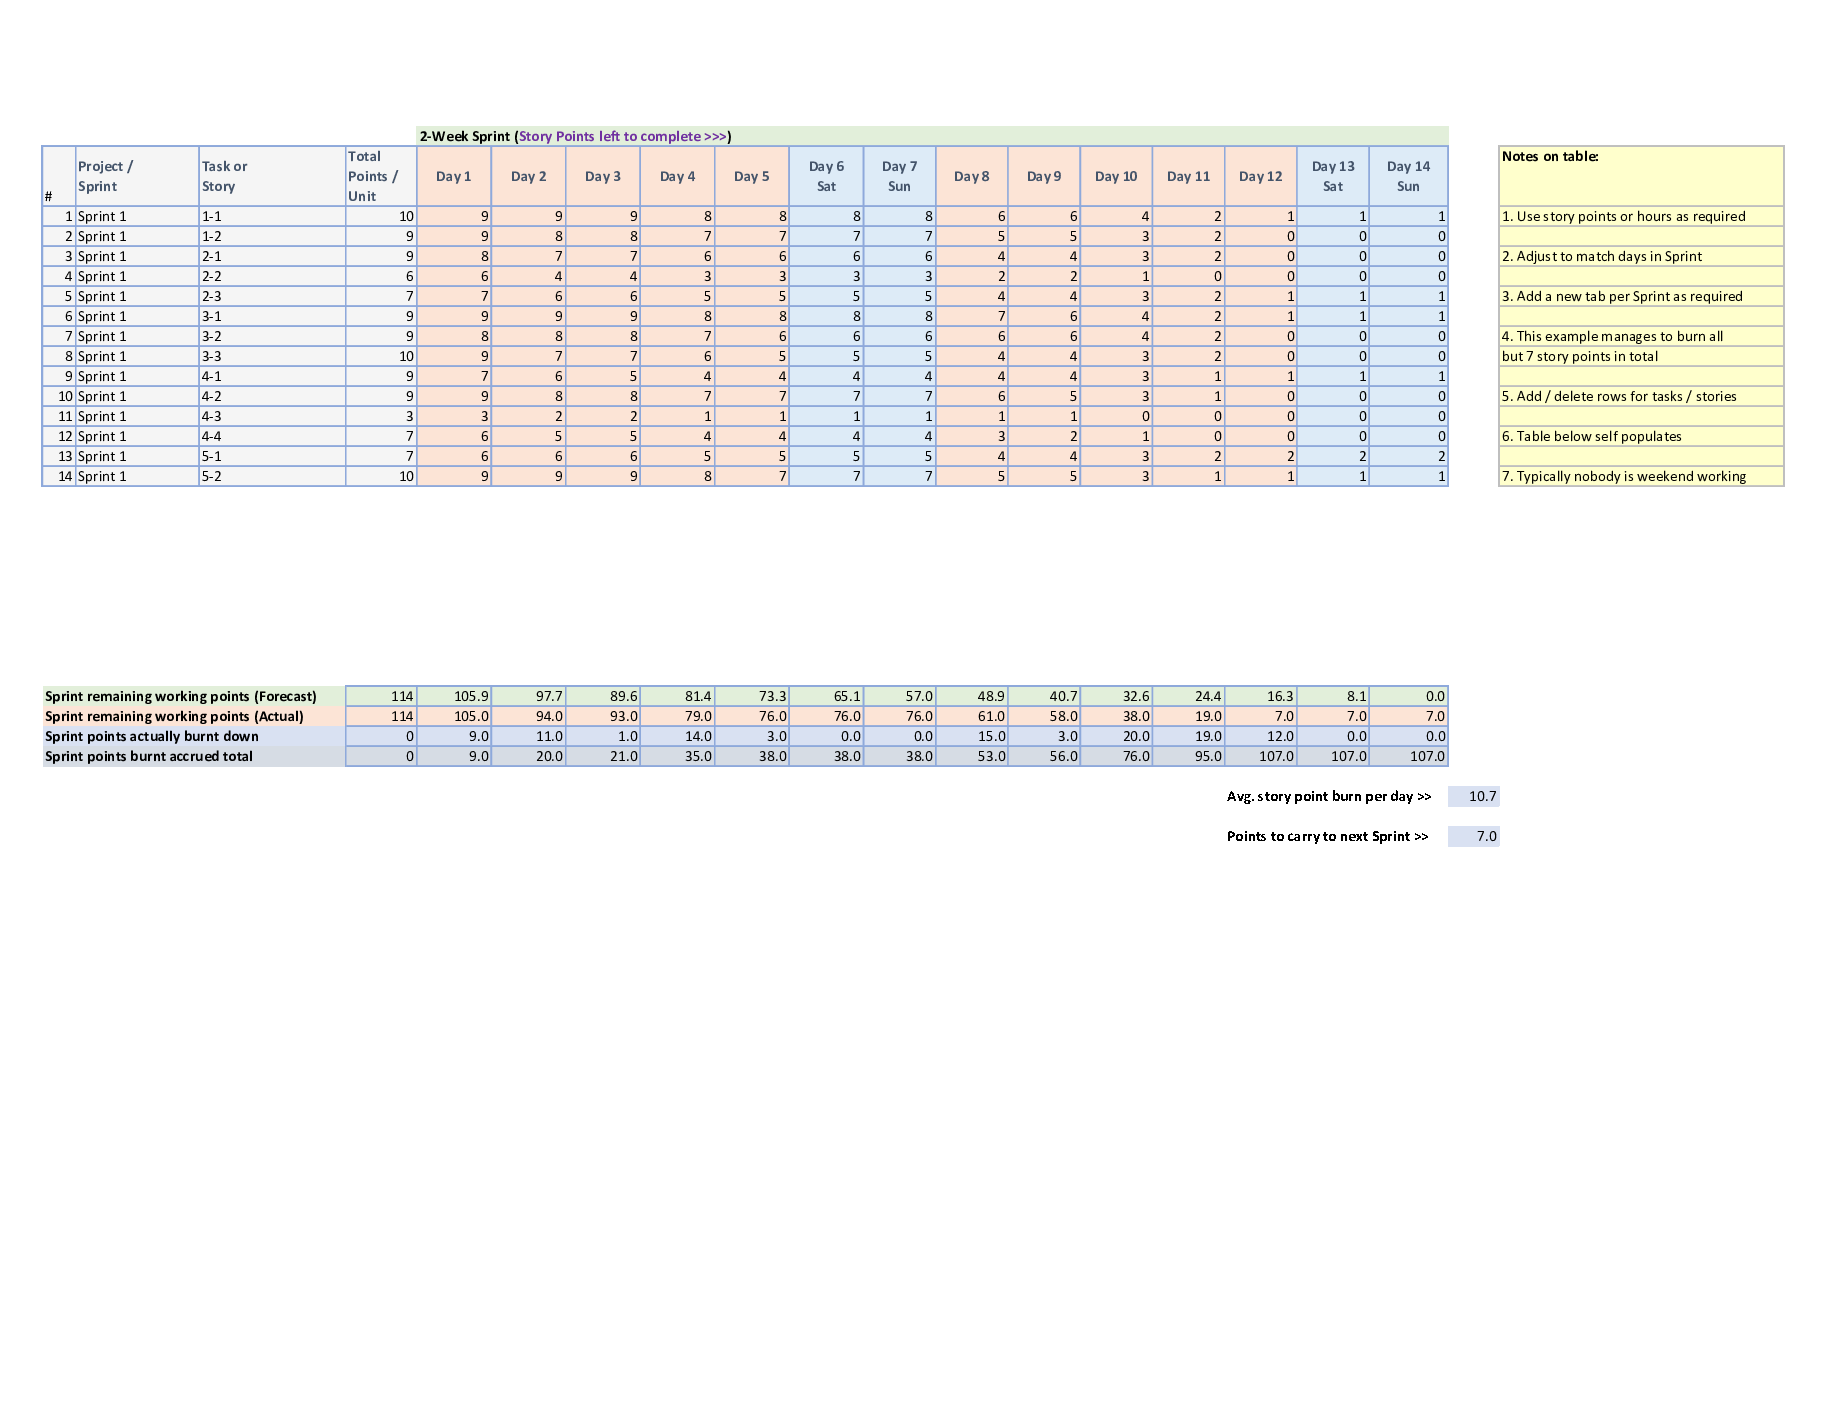
Tab 1: Contains the Agile Sprint burn down chart table of points burned for a particular Sprint. The Sprint shown is a 2-week duration (probably the most typical duration for a Sprint). Amend this for Sprint length and add the context of the tasks and points per task as appropriate. For each Sprint in the Agile project, just copy this tab and increment to next Sprint cycle and repeat.
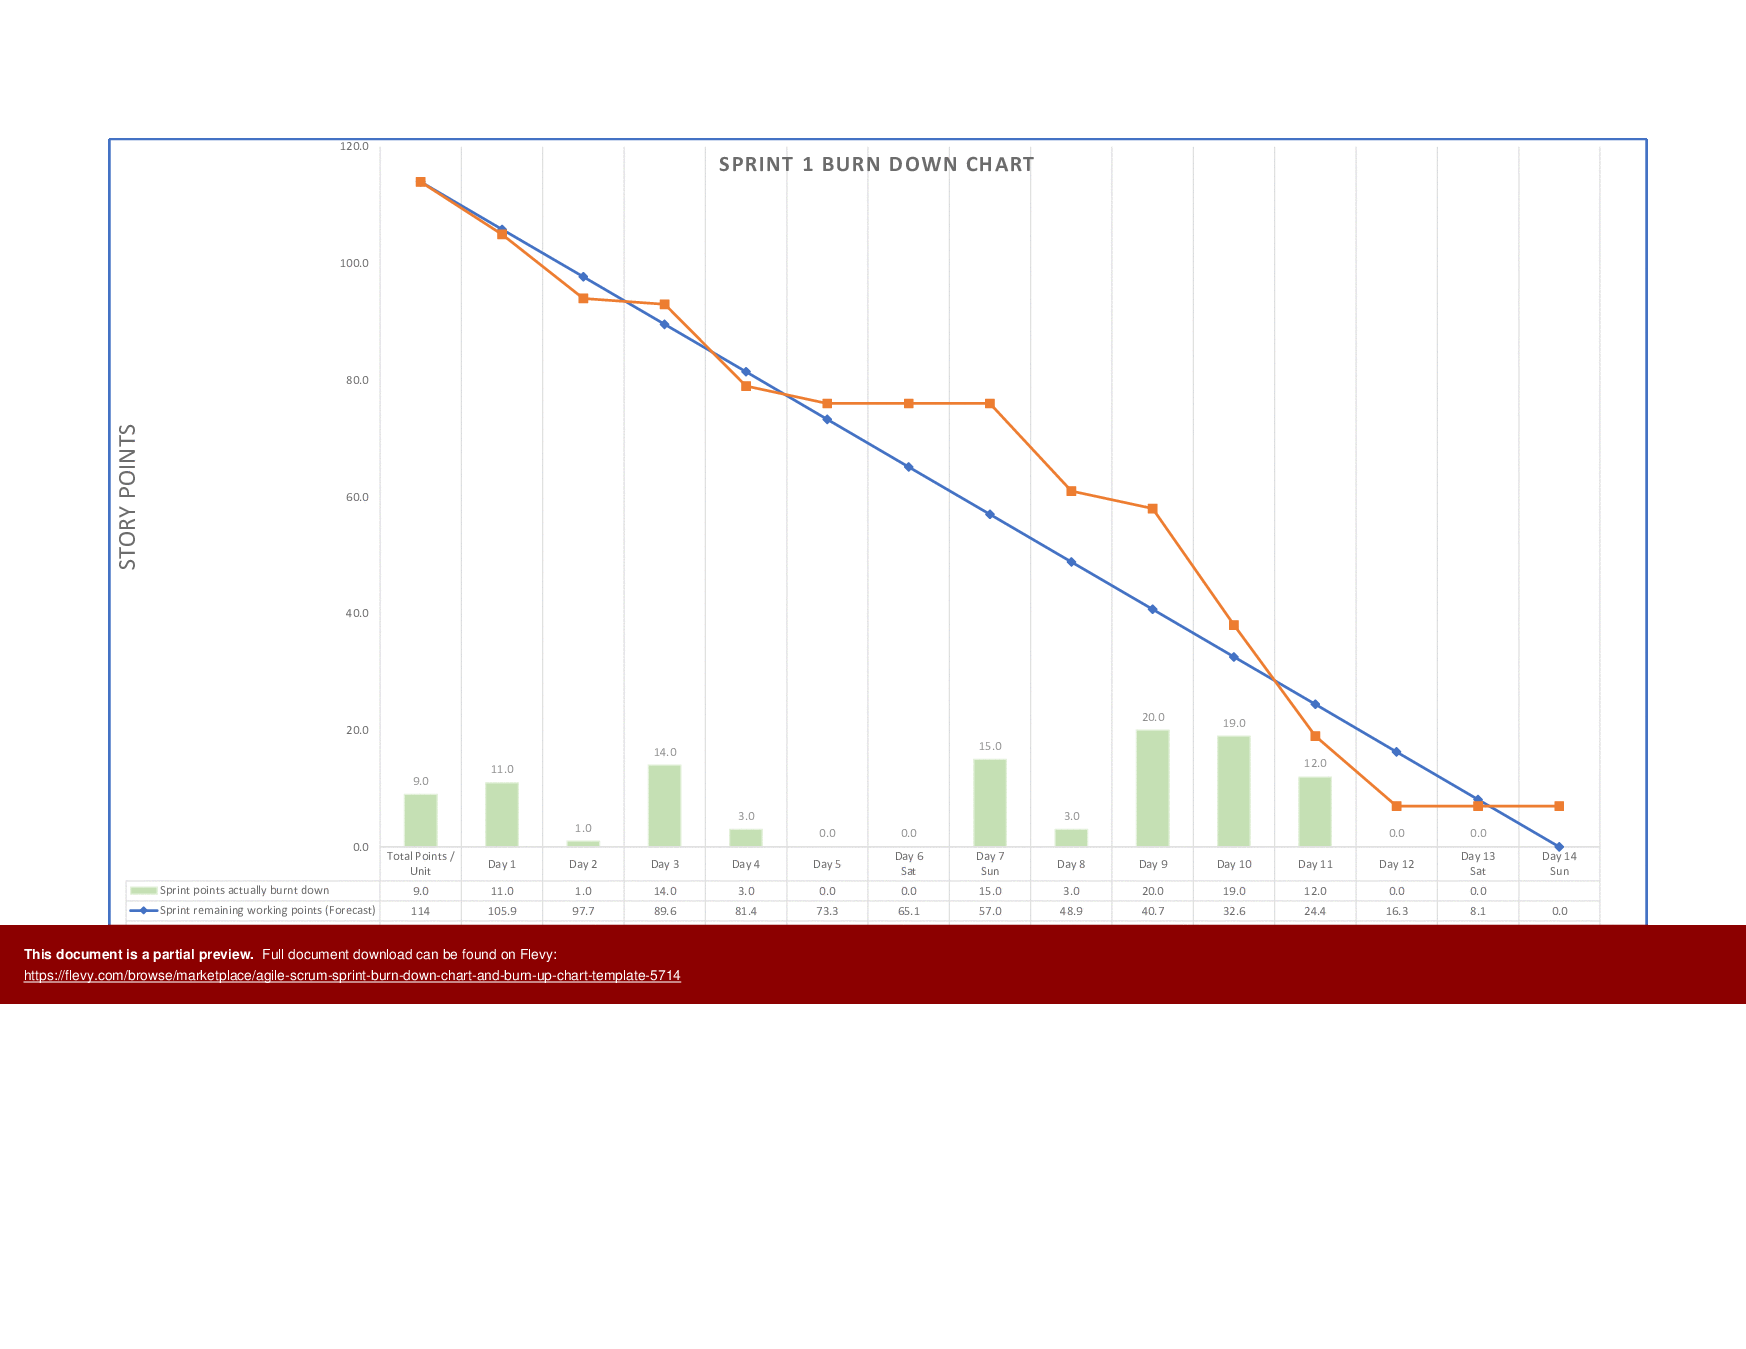
Tab 2: The Sprint burn down chart for the table in Tab 1 above. This provides the graphical view of the Sprint in terms of forecast and actual story points burned. Copy and rename to the subsequent Sprint as required by creating a new worksheet tab.
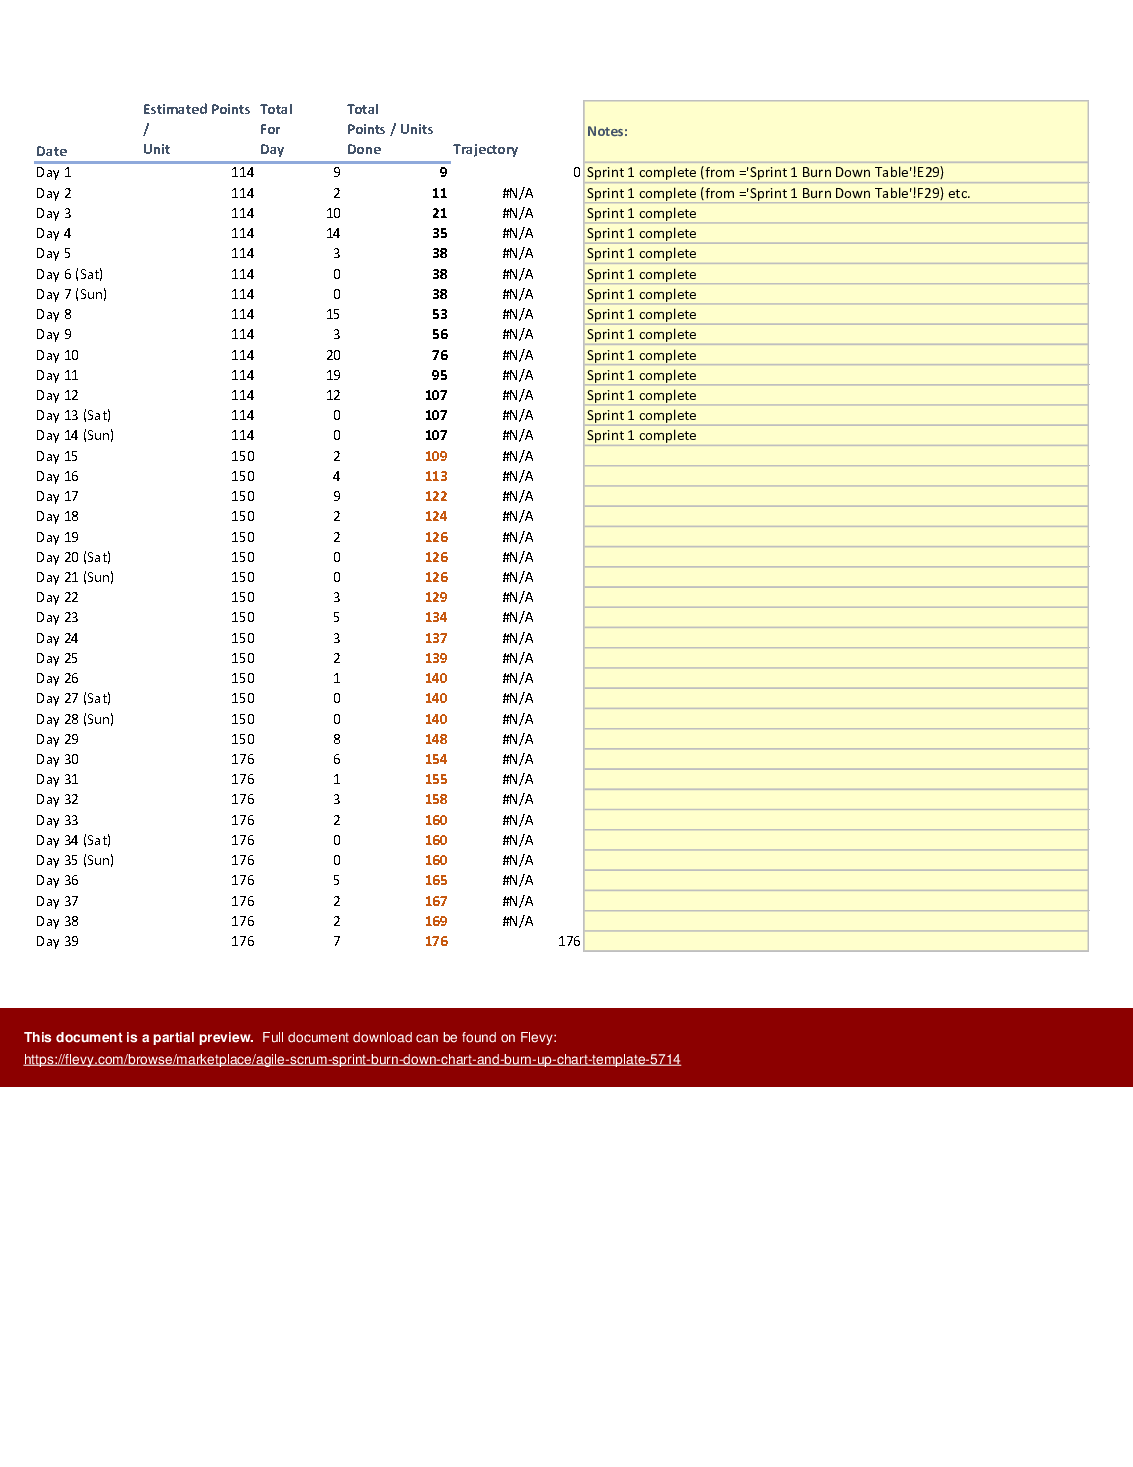
Tab 3: The burn up table represents the forecast and actuals across the whole Agile Scrum project by story points.
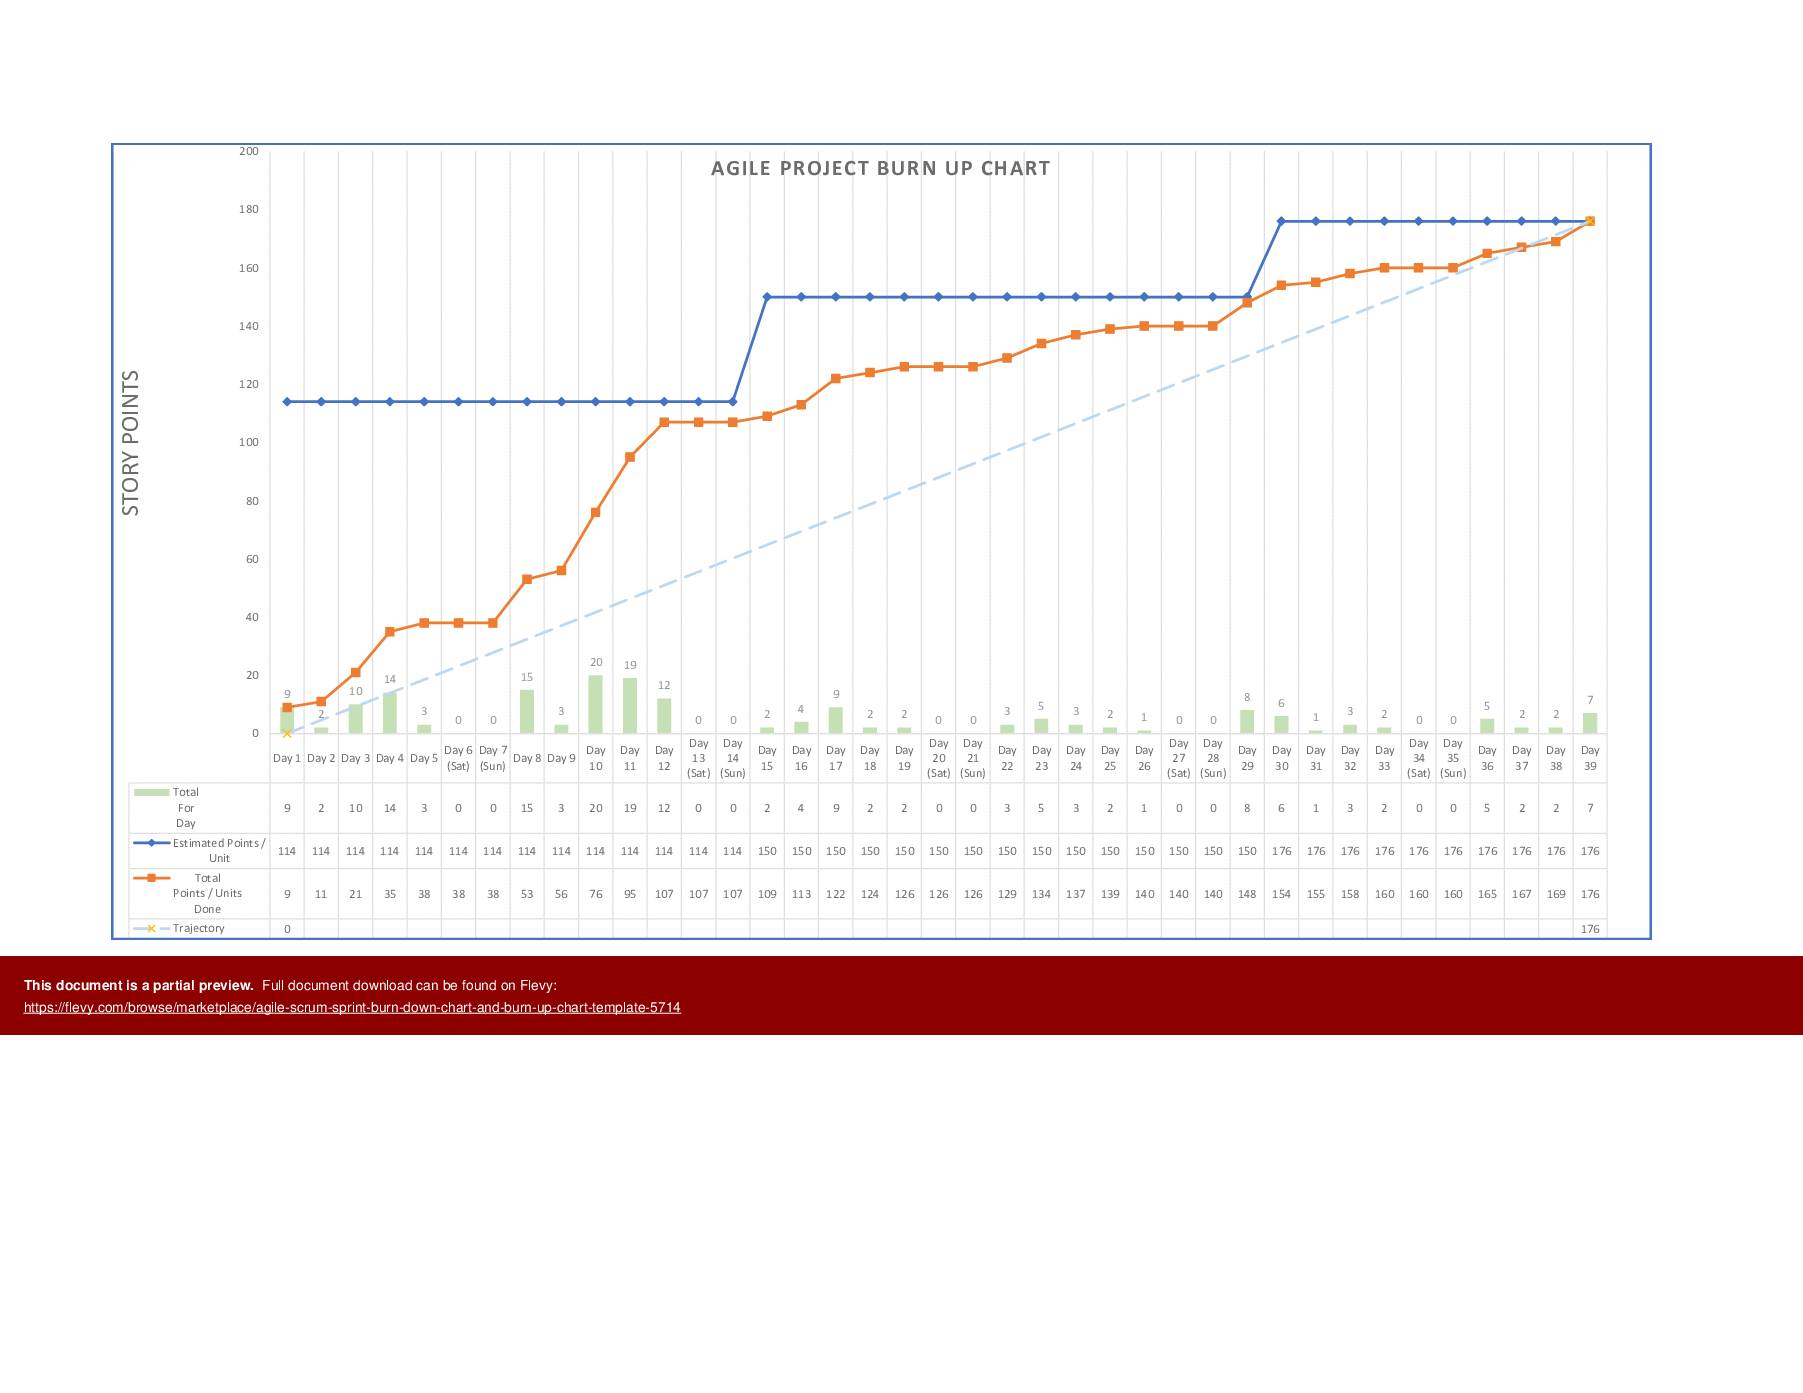
Tab 4: The burn up chart for Tab 3.
Got a question about the product? Email us at support@flevy.com or ask the author directly by using the "Ask the Author a Question" form. If you cannot view the preview above this document description, go here to view the large preview instead.
TOPIC FAQ
What is the difference between a burn down chart and a burn up chart?
A burn down chart tracks story points burned over the course of a sprint to show remaining work; in this template the sprint burn down is represented by a table (Tab 1) and a chart (Tab 2). A burn up chart shows cumulative forecast versus actual completion across the whole project (Tab 3 and Tab 4), across 4 worksheet tabs.How do I use a burn down chart for a two-week sprint in Excel?
Enter tasks and story points in the sprint burn down table on Tab 1 using the included 2-week sprint example, update daily with points burned, and view the graphical forecast vs actual on Tab 2. For subsequent sprints, copy and rename the sprint tabs to create new cycles using the 2-week example.Can I replace Jira with an Excel template to track sprint metrics?
When no access to Agile tools like Jira is available, an editable Excel workbook can capture sprint and project metrics; Flevy's Agile Scrum Sprint Burn Down Chart & Burn Up Chart Template provides this as an XLSM file with a sprint table/chart and a project-level burn-up across 4 worksheet tabs.How should I extend a sprint worksheet to cover multiple sprints?
Use the provided sprint tab layout as a template: copy the sprint burn down table tab (Tab 1) and its corresponding chart tab (Tab 2), increment the sprint identifiers and dates, and repeat this pattern for each sprint to accumulate multi-sprint data across separate worksheet tabs.What features matter when buying an Excel burn down/burn up template on a limited budget?
Prioritize an editable Excel format (XLSM) that includes both sprint-level table/chart and project-level burn-up table/chart, and that lets you amend sprint length and task point allocations; Flevy's template supplies these elements across 4 worksheet tabs.How long does it take to set up an Excel burn down template for my next sprint?
Setup time depends on how quickly you can map tasks and assign story points,, but this template requires entering tasks/points into the sprint table, adjusting sprint length if needed, and copying the sprint tabs; the package includes 4 worksheet tabs to start with.Should I use a burn up chart to show scope changes across a release?
Yes; a burn up chart is suited to showing cumulative forecast and actuals and makes scope changes visible over time. The template’s project-level burn up table and chart (Tab 3 and Tab 4) are designed for release- or project-level tracking across the whole Agile Scrum project.How do I adapt the provided 2-week sprint example to different sprint lengths and task granularity?
Amend the sprint duration and adjust the tasks and points per task in the sprint burn down table (Tab 1), and update the related chart (Tab 2). For multiple sprints, copy and rename the sprint tabs after tailoring the example 2-week duration and point allocations.Source: Best Practices in Project Management, Agile, Scrum Excel: Agile Scrum Sprint Burn Down Chart & Burn Up Chart Template Excel (XLSM) Spreadsheet, i_Pro_PM_Templates
ABOUT THE AUTHOR
i_Pro_PM_Templates is an Flevy seller and an experienced Senior Project Manager, who has been working at ascending points in software development lifecycle projects for over 30 years.
The Flevy seller has impressive credentials in the delivery of highly complex projects in challenging conditions. The seller has held senior Project Management positions and helped to drive significant business
... [read more]
Ask the Author a Question
You must be logged in to contact the author.
