
 Click main image to view in full screen.
SAP OCM Executive Dashboard – Excel XLSX
Excel (XLSX) + PowerPoint (PPTX)


CHANGE MANAGEMENT EXCEL DESCRIPTION
Reporting on an SAP OCM program to executives typically means manually rebuilding
a status slide every period from scratch, copying numbers out of several
different trackers. This listing solves that with a live, self-updating Excel
dashboard, plus a companion PowerPoint template for the moments a formal,
presentable slide is specifically needed.
This addresses the reporting questions every change manager faces: How do we show
program status without rebuilding a report every single period? How do we avoid
reporting a metric that doesn't even exist yet at the current project phase
(login frequency or support ticket volume before go-live, for instance)? How do
we keep an executive slide visually consistent with our internal tracking?
What's included in the primary Excel workbook (XLSX):
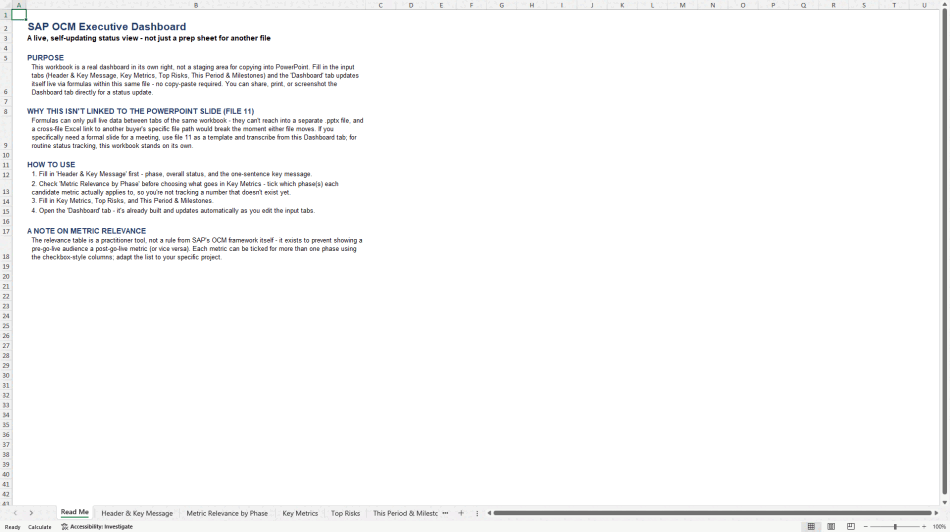
• Read Me tab explaining how the dashboard is structured
• Header & Key Message tab: current phase, overall status, and a one-sentence
key message, entered once
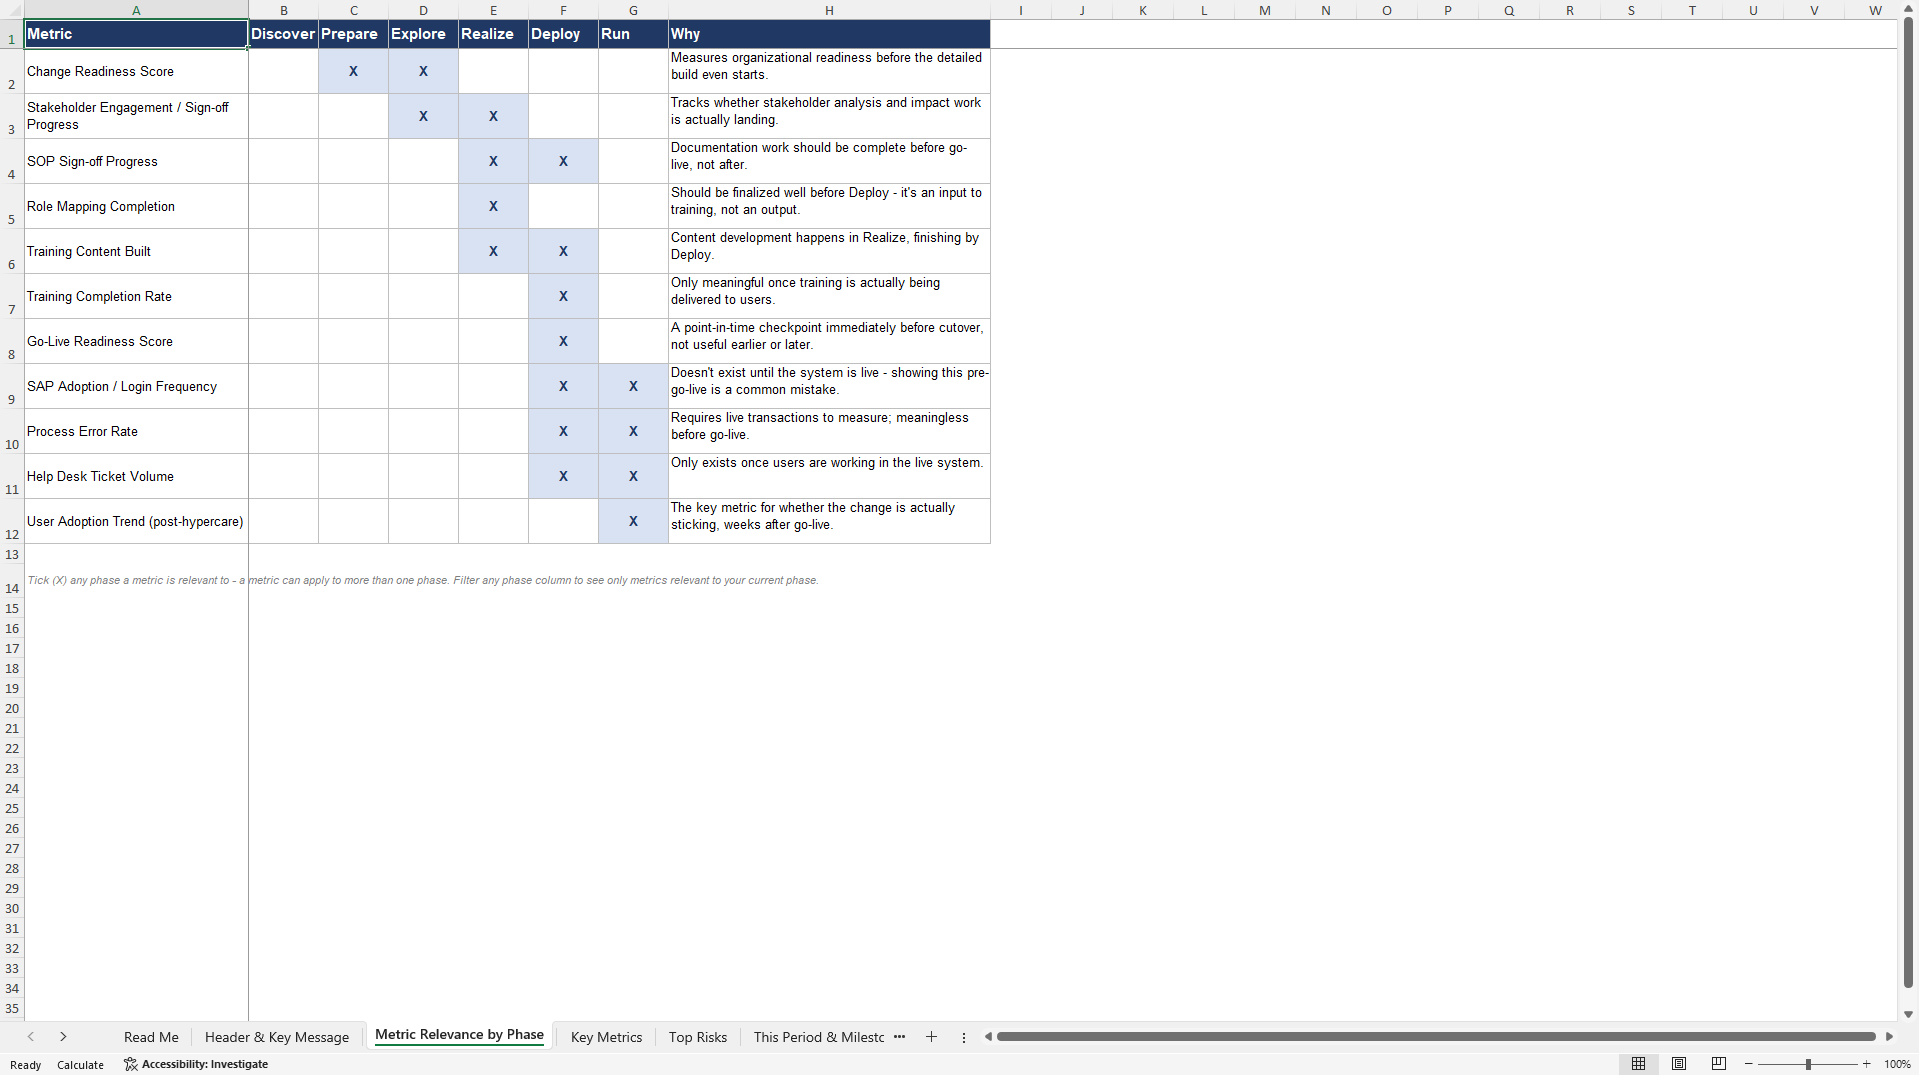
• Metric Relevance by Phase tab: a checkbox-style reference table tagging which
project phase(s) each candidate metric actually applies to, preventing the
common mistake of reporting the wrong metric at the wrong phase
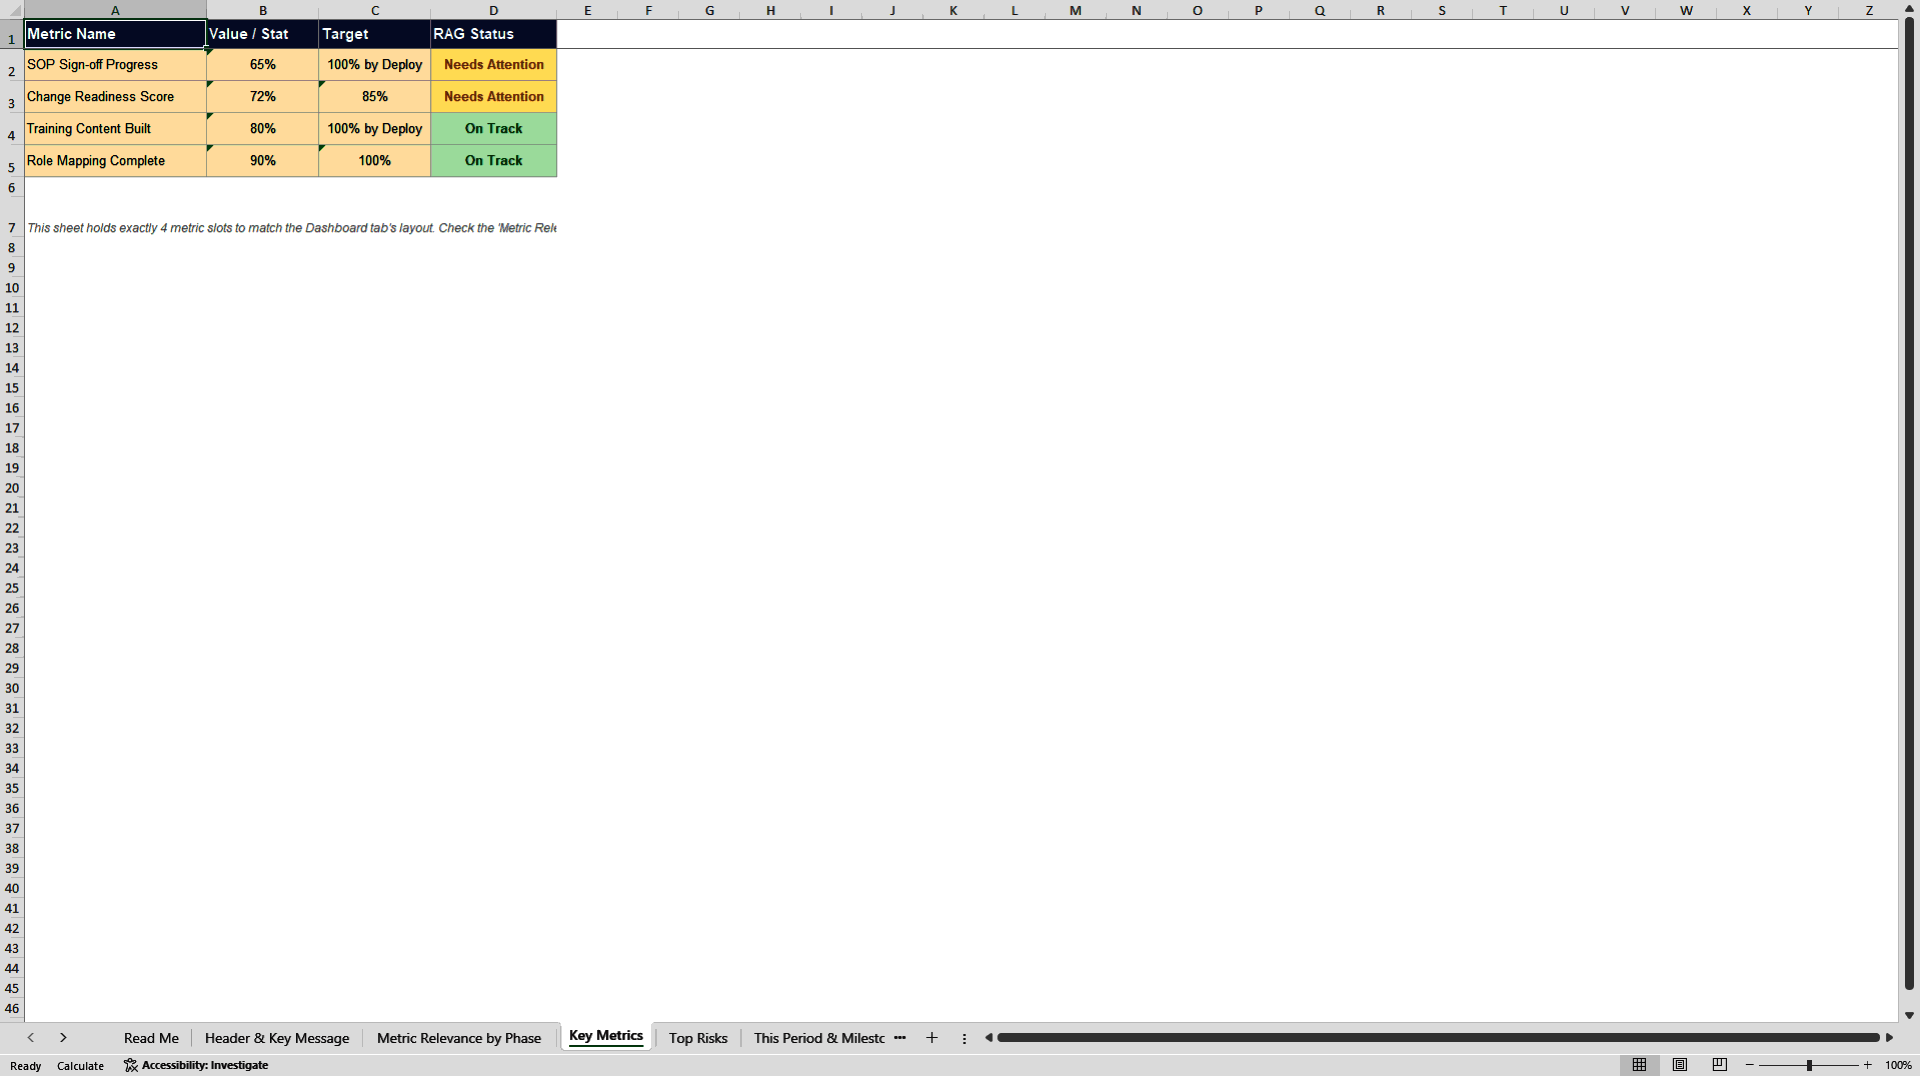
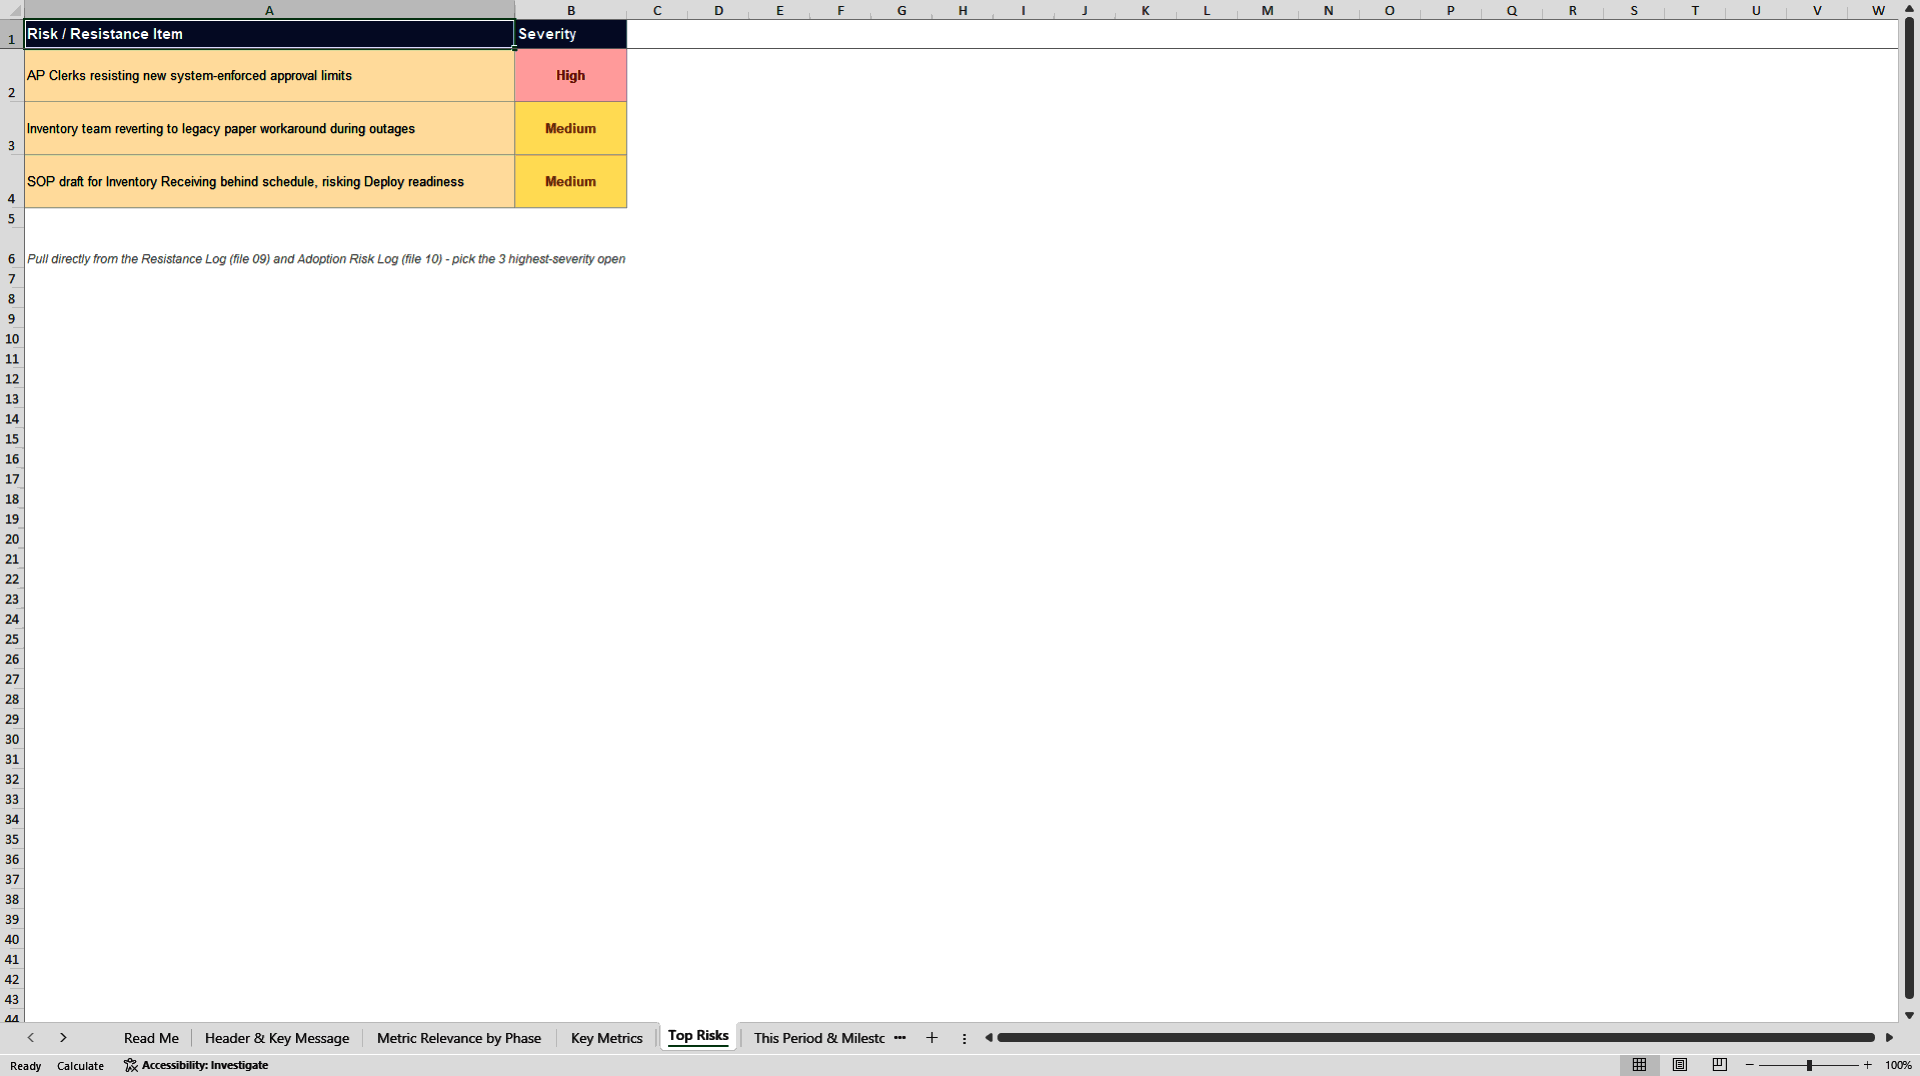
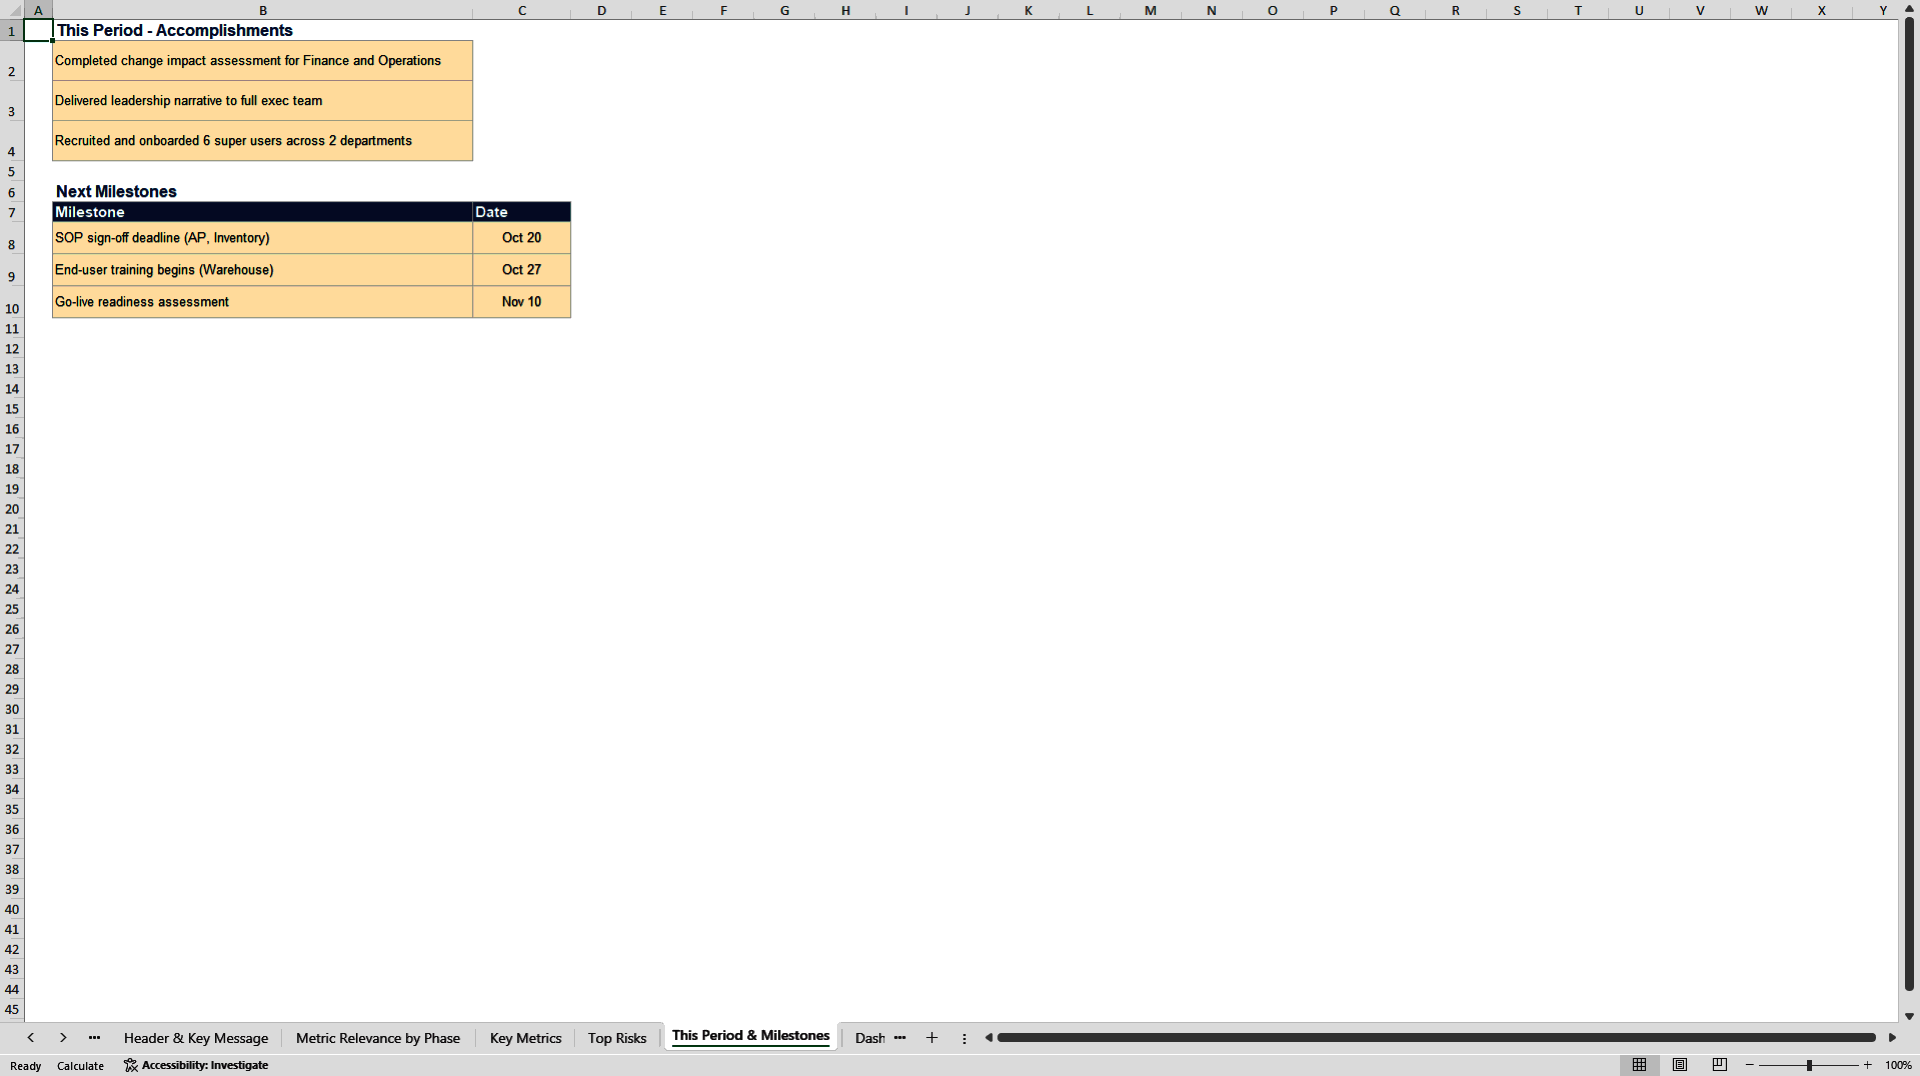
• Key Metrics, Top Risks, and This Period & Milestones tabs: structured input
areas for the period's data
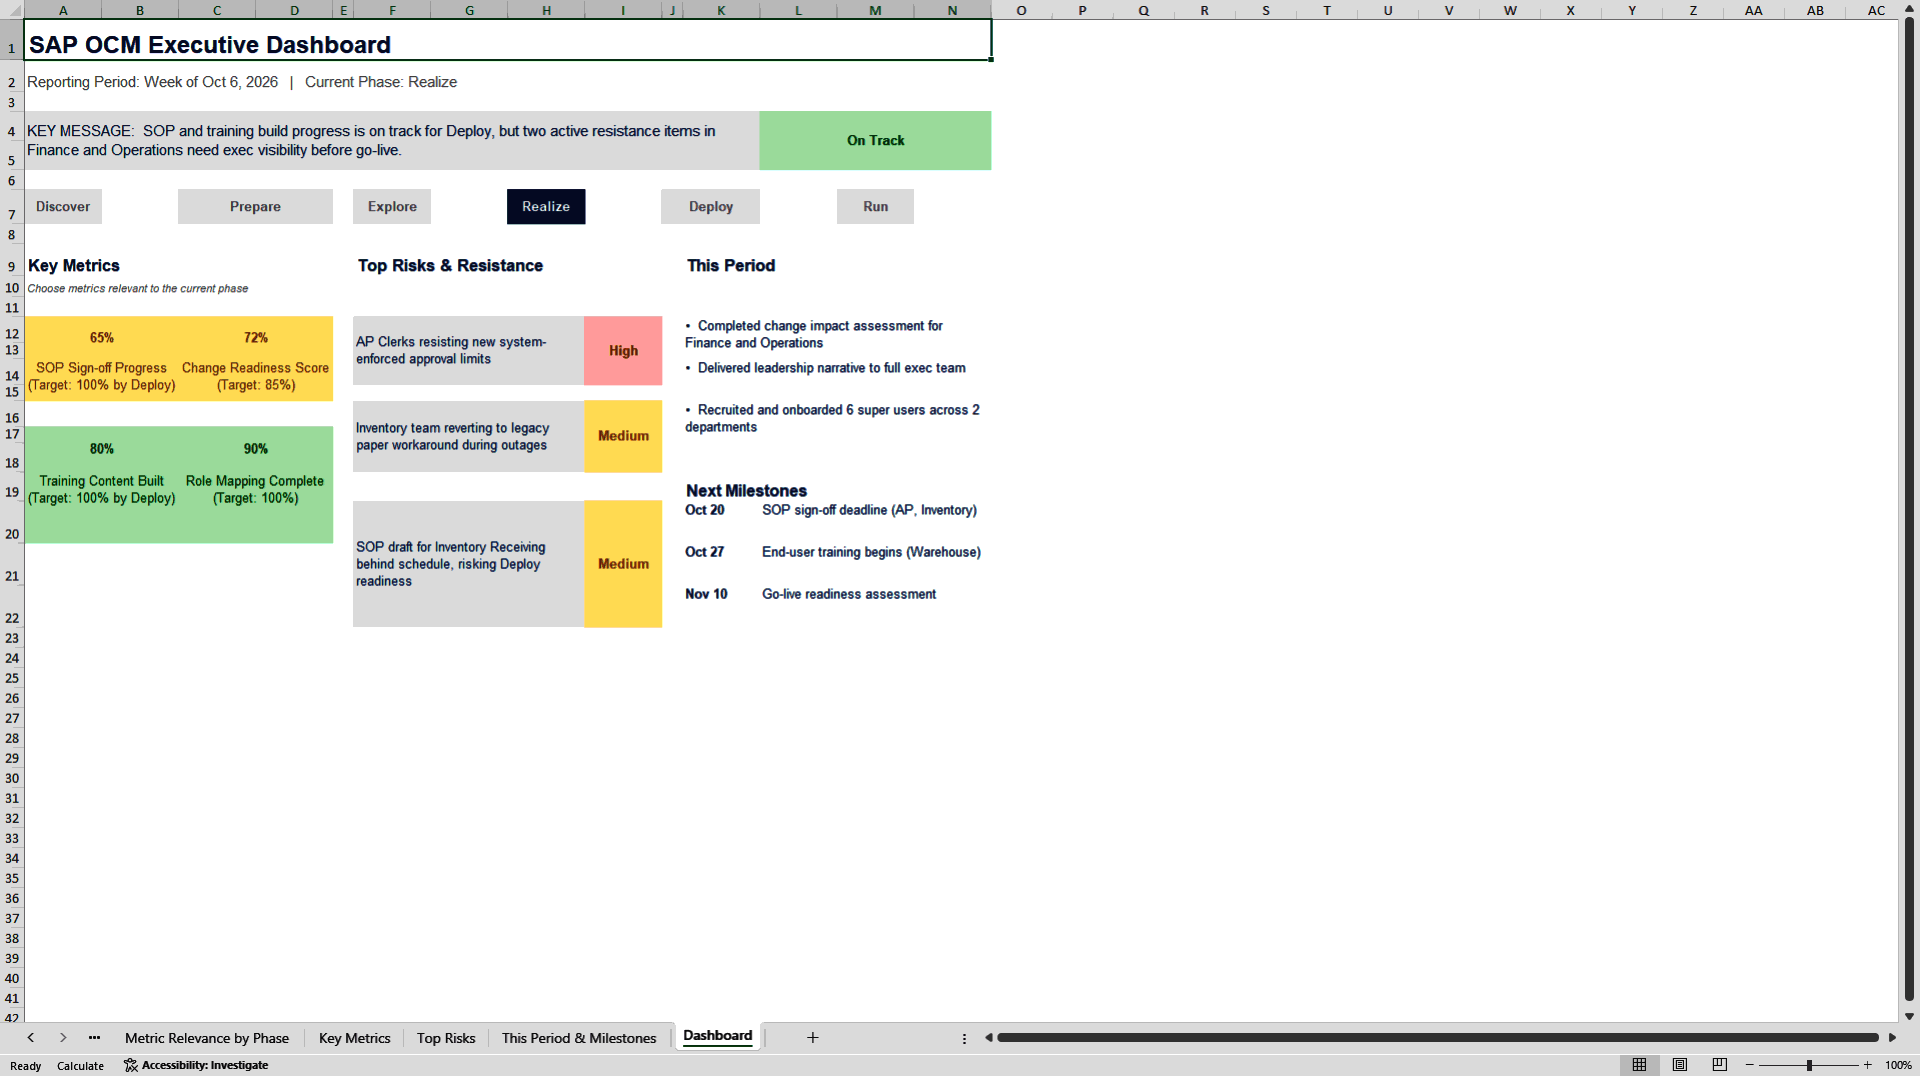
• Dashboard tab: pulls automatically, via formulas and conditional formatting,
from all of the above, updating its values, color coding, and phase-progress
indicator immediately when any input tab is edited
The secondary document is a single-slide PowerPoint template matching the
dashboard's exact visual language, same status colors, same phase-stepper
treatment, with a Key Message callout, phase progress stepper, key metric
callouts, a top risks panel, and an accomplishments and milestones section.
Because PowerPoint cannot pull live data from a separate Excel file, the slide is
meant to be populated by hand each period, transcribed from the Dashboard tab,
not linked automatically.
Delivered as a fully editable Excel workbook plus a companion PowerPoint file, no
macros required. An SAP OCM executive dashboard and status reporting template
suited to change managers and PMOs who want a genuine working dashboard for
ongoing tracking, with a polished slide ready for the moments that call for one.
Usage tip: fill in the Metric Relevance by Phase tab before choosing which four
metrics to feature each reporting period, resist the temptation to reuse the same
four every time regardless of how far the project has actually progressed.
Got a question about the product? Email us at support@flevy.com or ask the author directly by using the "Ask the Author a Question" form. If you cannot view the preview above this document description, go here to view the large preview instead.
Source: Best Practices in Change Management, Key Performance Indicators Excel: SAP OCM Executive Dashboard Excel (XLSX) Spreadsheet, SAP Planning Pro
ABOUT THE AUTHOR

With 30+ years of progressive experience leading enterprise SAP transformations, I specialize in the strategic planning and end-to-end execution of complex, multi-million-dollar global SAP programs.
My career bridges the gap between technical architecture, project governance, and human adoption. As a triple-certified SAP professional and PMP, I have engineered and overseen large-scale
... [read more]
Ask the Author a Question
You must be logged in to contact the author.




























