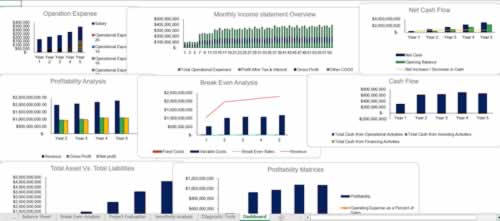
Editor's Note: Take a look at our featured best practice, Manufacturing Company Financial Model - Dynamic 10 Year Forecast (Excel workbook). Highly sophisticated and user-friendly Financial Model providing advanced financial & planning analysis for a Startup Manufacturing Company. Suitable for any type of industry, the model is a flexible tool for CEO/CFO's to control and improve daily operations and forecast financial and [read more]
Do You Know All the KPIs for a Manufacturing Operations Manager?
Also, if you are interested in becoming an expert on Supply Chain Management (SCM), take a look at Flevy's Supply Chain Management (SCM) Frameworks offering here. This is a curated collection of best practice frameworks based on the thought leadership of leading consulting firms, academics, and recognized subject matter experts. By learning and applying these concepts, you can you stay ahead of the curve. Full details here.
* * * *
![]() This is an exhaustive list of Key Performance Indicators (KPIs) for a Manufacturing Operations Manager.
This is an exhaustive list of Key Performance Indicators (KPIs) for a Manufacturing Operations Manager.
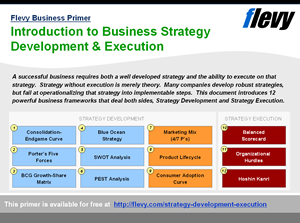
These KPIs are aligned with Lean initiatives–specifically, Cultural Transformation, Continuous Improvement, elimination of all Wastes, associates becoming process and problem solvers at Gemba. The tools to be implemented after Lean culture change include 6S, Kanban, Kaizen, and Lean Six Sigma. Our goal is to bring value beyond the customers’ expectations.
Improving Customer Experience & Responsiveness
1. On-Time Delivery to Commit – This metric is the percentage of time that manufacturing delivers a completed product on the schedule that was committed to customers.
2. Manufacturing Cycle Time – Measures the speed or time it takes for manufacturing to produce a given product from the time the order is released to production, to finished goods.
3. Time to Make Changeovers – Measures the speed or time it takes to switch a manufacturing line or plant from making one product over to making a different product.
Improving Quality: Six Sigma
4. Yield – Indicates a percentage of products that are manufactured correctly and to specifications the first time through the manufacturing process without scrap or rework.
5. Customer Rejects/Return Material Authorizations/Returns – A measure of how many times customers reject products or request returns of products based on receipt of a bad or out of specification product.
6. Suppliers Incoming Quality – A measure of the percentage of good quality materials coming into the manufacturing process from a given supplier.
Improving Efficiency: Eliminate all waste
7. Throughput – Measures how much product is being produced on a machine, line, unit, or plant over a specified period of time.
8. Capacity Utilization – Indicates how much of the total manufacturing output capacity is being utilized at a given point in time.
9. Overall Equipment Effectiveness (OEE) – This multi-dimensional metric is a multiplier of Availability x Performance x Quality , and it can be used to indicate the overall effectiveness of a piece of production equipment, or an entire production line.
10. Schedule or Production Attainment – A measure of what percentage of time a target level of production is attained within a specified schedule of time.
Reducing Inventory: Consider Kanban “pull” system
11. WIP Inventory/Turns – A commonly used ratio calculation to measure the efficient use of inventory materials. It is calculated by dividing the cost of goods sold by the average inventory used to produce those goods.
Ensuring Compliance
12. Reportable Health and Safety Incidents – A measure of the number of health and safety incidents that were either actual incidents or near misses that were recorded as occurring over a period of time. (OSHA: Occupational Safety and Health Association.)
13. Reportable Environmental Incidents – A measure of the number of health and safety incidents that were recorded as occurring over a period of time.
14. Number of Non-Compliance Events / Year – A measure of the number of times a plant or facility operated outside the guidelines of normal regulatory compliance rules over a one-year period. These non-compliances need to be fully documented as to the specific non-compliance time, reasons, and resolutions.
Reducing Maintenance/Preventative Maintenance (PM)
15. Percentage Planned vs. Emergency Maintenance Work Orders – This ratio metric is an indicator of how often scheduled maintenance takes place, versus more disruptive/un-planned maintenance.
16. Downtime in Proportion to Operating Time – This ratio of downtime to operating time is a direct indicator of asset availability for production.
Increasing Flexibility & Innovation: Continuous Improvement
17. Rate of New Product Introduction – Indicates how rapidly new products can be introduced to the marketplace and typically includes a combination of design, development and manufacturing ramp up times.
18. Engineering Change Order Cycle Time – A measure of how rapidly design changes or modifications to existing products can be implemented all the way through documentation processes and volume production.
Reducing Costs & Increasing Profitability
19. Total Manufacturing Cost per Unit Excluding Materials – This is a measure of all potentially controllable manufacturing costs that go into the production of a given manufactured unit, item or volume.
20. Manufacturing Cost as a Percentage of Revenue – A ratio of total manufacturing costs to the overall revenues produced by a manufacturing plant or business unit.
21. Net Operating Profit – Measures the financial profitability for all investors/shareholders/debt holders, either before or after taxes, for a manufacturing plant or business unit.
22. Productivity in Revenue per Employee – This is a measure of how much revenue is generated by a plant, business unit or company, divided by the number of employees.
23. Average Unit Contribution Margin – This metric is calculated as a ratio of the profit margin that is generated by a manufacturing plant or business unit, divided into a given unit or volume of production.
24. Return on Assets/Return on Net Assets – A measure of financial performance calculated by dividing the net income from a manufacturing plant or business unit by the value of fixed assets and working capital deployed.
25. Energy Cost Per Unit – A measure of the cost of energy (electricity, steam, oil, gas, etc.) required to produce a specific unit or volume of production.
26. Cash-to-Cash Cycle Time – This metric is the duration between the purchase of a manufacturing plant or business unit’s inventory, and the collection of payments/accounts receivable for the sale of products that utilize that inventory – typically measured in days.
27. EBITDA – This metric acronym stands for Earnings Before Interest, Taxes, Depreciation, and Amortization. It is a calculation of a business unit or company’s earnings, prior to having any interest payments, tax, depreciation, and amortization subtracted for any final accounting of income and expenses. EBITDA is typically used as top-level indication of the current operational profitability of a business.
28. Customer Fill Rate/On-Time delivery/Perfect Order Percentage – This metric is the percentage of times that customers receive the entirety of their ordered manufactured goods, to the correct specifications, and delivered at the expected time.
167-slide PowerPoint presentation
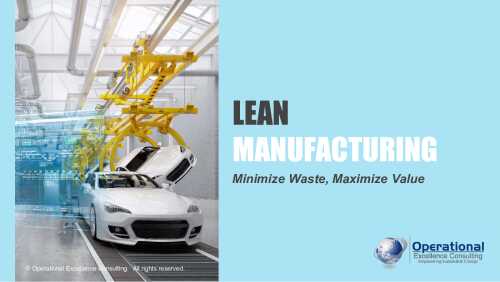
In this Lean Manufacturing presentation, we explore the Lean philosophy, which is rooted in the Toyota Production System (TPS). Lean aims to enhance customer value by optimizing processes and eliminating waste, ultimately increasing productivity and value with fewer resources.
A key [read more]
Want to Achieve Excellence in Supply Chain Management (SCM)?
Gain the knowledge and develop the expertise to become an expert in Supply Chain Management (SCM). Our frameworks are based on the thought leadership of leading consulting firms, academics, and recognized subject matter experts. Click here for full details.
Supply Chain Management (SCM) is the design, planning, execution, control, and monitoring of Supply Chain activities. It also captures the management of the flow of goods and services.
In February of 2020, COVID-19 disrupted—and in many cases halted—global Supply Chains, revealing just how fragile they have become. By April, many countries experienced declines of over 40% in domestic and international trade.
COVID-19 has likewise changed how Supply Chain Executives approach and think about SCM. In the pre-COVID-19 era of globalization, the objective was to be Lean and Cost-effective. In the post-COVID-19 world, companies must now focus on making their Supply Chains Resilient, Agile, and Smart. Additional trends include Digitization, Sustainability, and Manufacturing Reshoring.
Learn about our Supply Chain Management (SCM) Best Practice Frameworks here.
Readers of This Article Are Interested in These Resources
Excel workbook
The Manufacturing Startup Feasibility Model Excel Template is made for business owners who are engaged in the manufacturing business and want to know their future projections. There is a huge potential for manufacturers to grow in the future and earn reasonable profits. Hence one must plan [read more]
|
|
371-slide PowerPoint presentation
|
|
326-slide PowerPoint presentation
| |||
About Charles Intrieri
Charles Intrieri is subject matter expert on Cost Reduction, Supply Chain, and 3rd Party Logistics. He is also an author on Flevy (view his documents materials). Managing his own consultancy for the past 25 years, Charles has helped dozens of clients achieve leaner and more efficient operations. You can connect with him here on LinkedIn or email him directly (cmiconsulting93@gmail.com). Charles also has a presentation Why Lean Fails in a Company? available for free download here.