Assessing growth opportunities made easy with this Growth Opportunity Assessment PPT. Get clear market analysis, opportunity matrices, and prioritization frameworks. Download now. Growth Opportunity Assessment is a 76-slide PPT PowerPoint presentation slide deck (PPT) available for immediate download upon purchase.
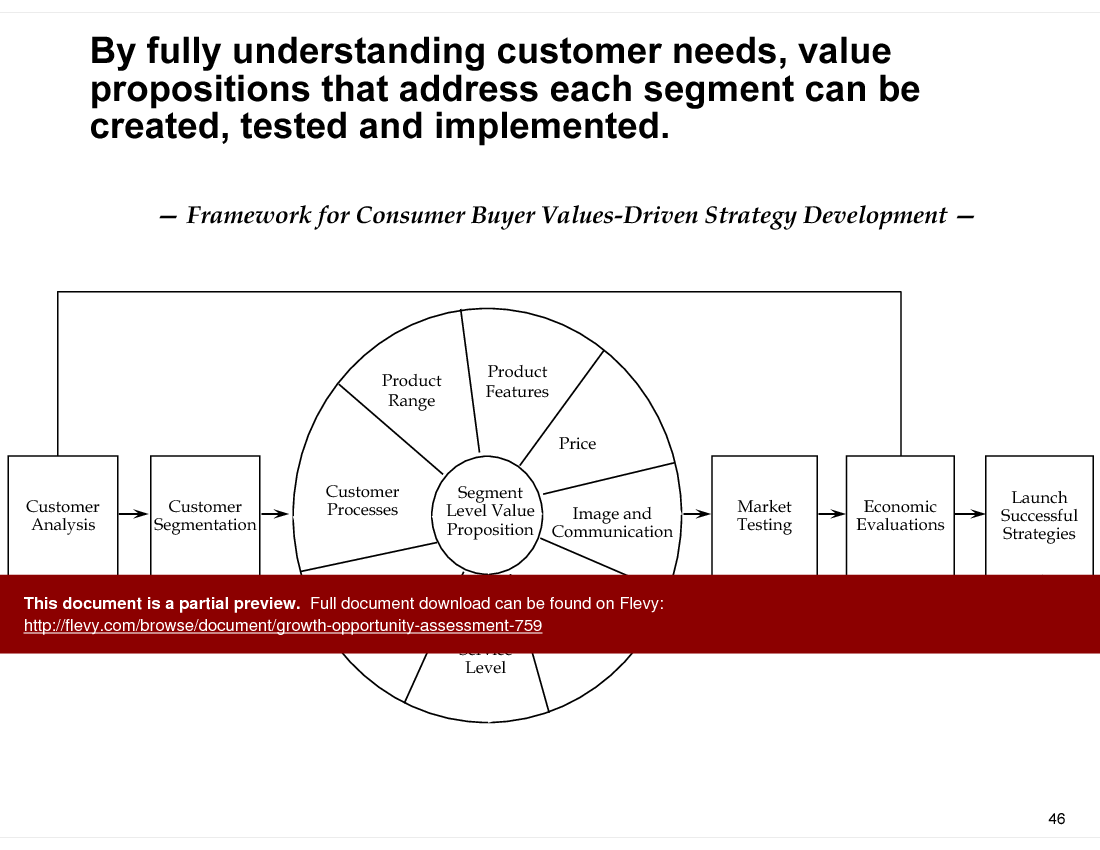
This document is a growth opportunity assessment approach. The approach is made up of the following steps:
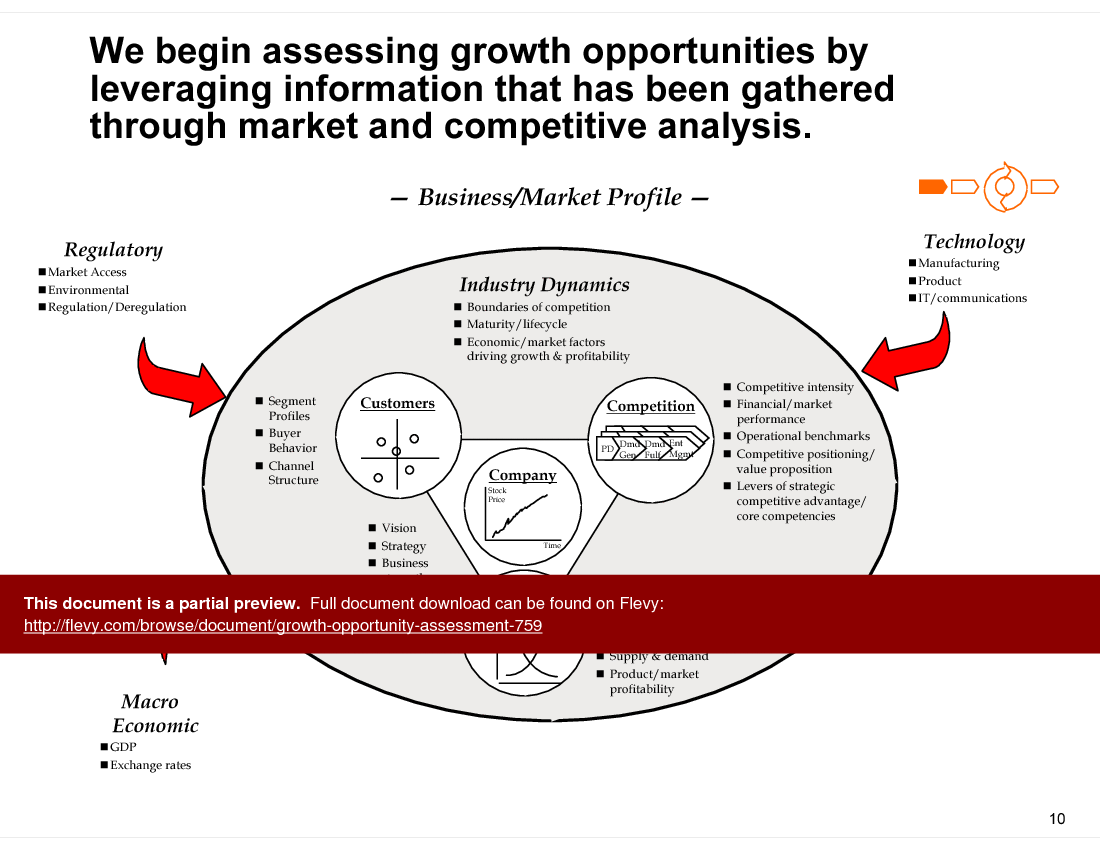
• Understand business/market profile (industry dynamics, customers, competition, company, economics)
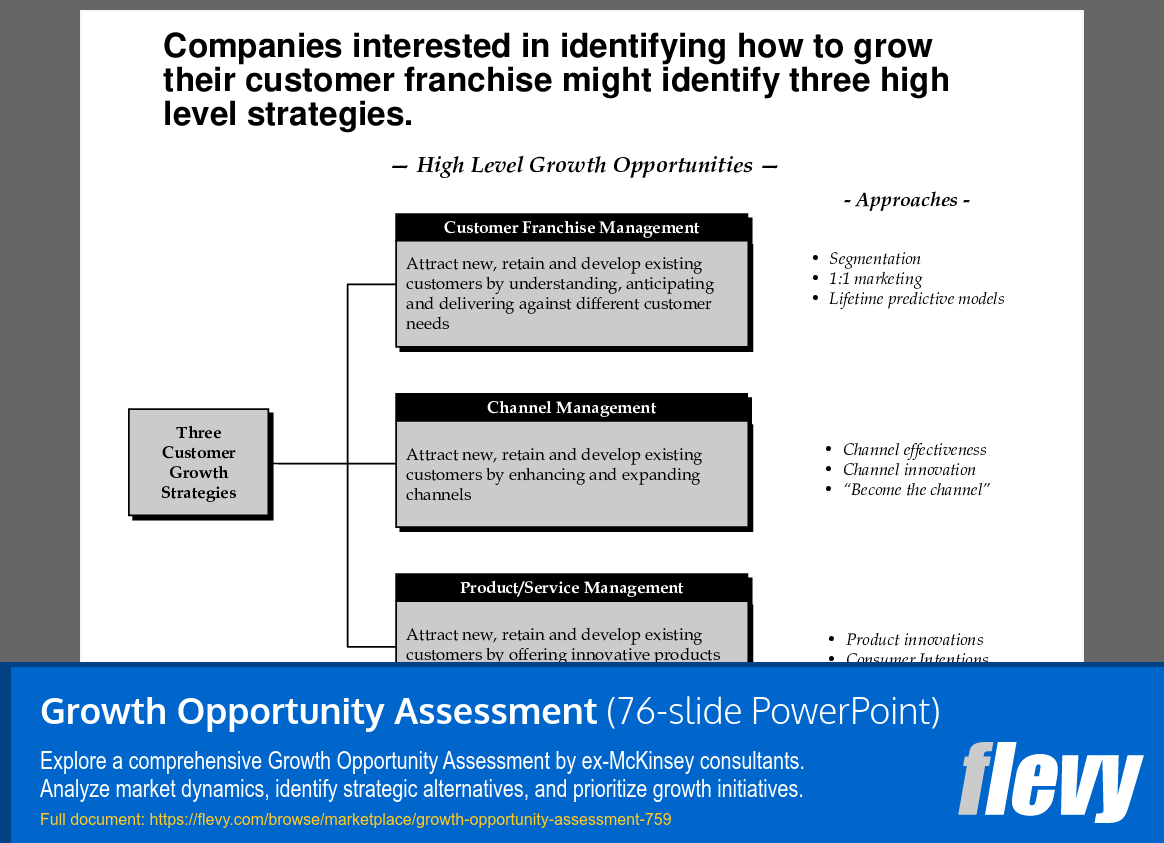
• Identify high-level growth opportunities
• Evaluate opportunity attractiveness at high level
• Identify viable strategic alternatives
• Validate against specific business requirements/hurdles
• Prioritize and select growth opportunities
The document contains 76 PowerPoint slides.
See also "Growth Strategy Report"
/browse/marketplace/growth-strategy-report-733
See also "Services Growth & Effectiveness Strategy"
/browse/marketplace/services-growth-and-effectiveness-strategy-735
See also "Services Growth & Effectiveness Approach"
/browse/marketplace/services-growth-and-effectiveness-approach-736
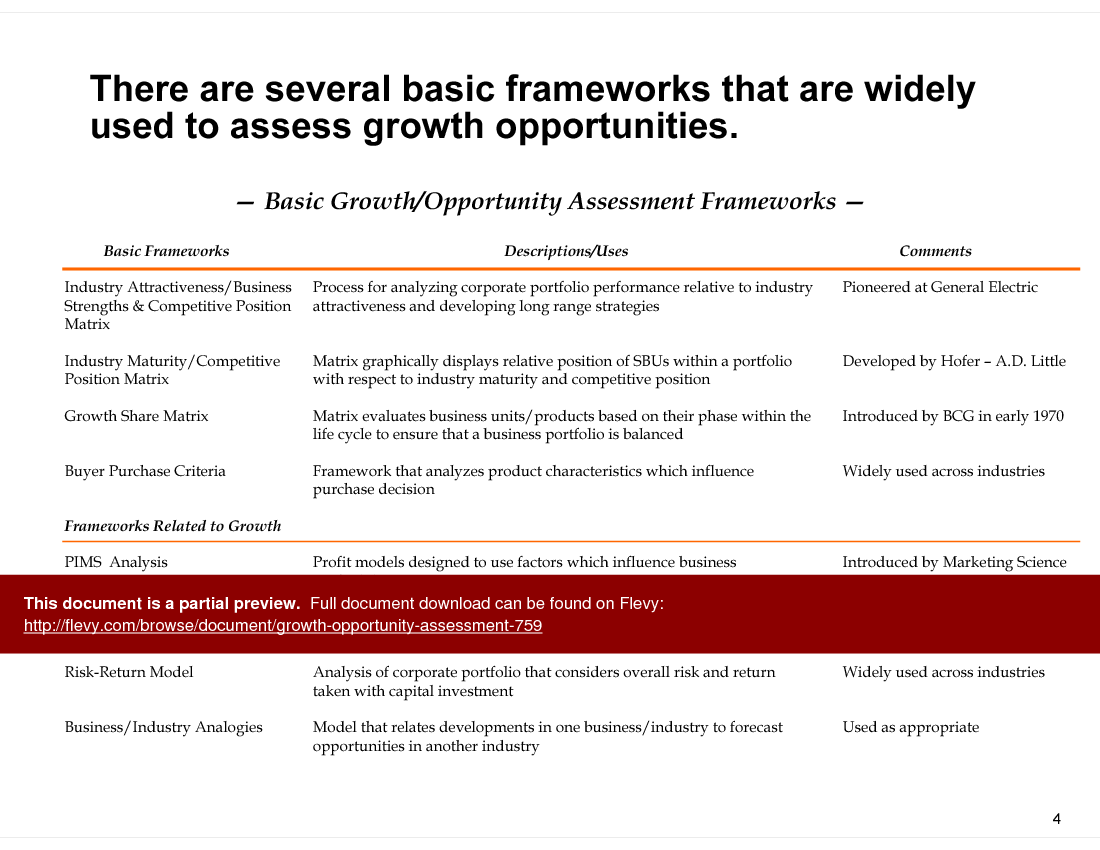
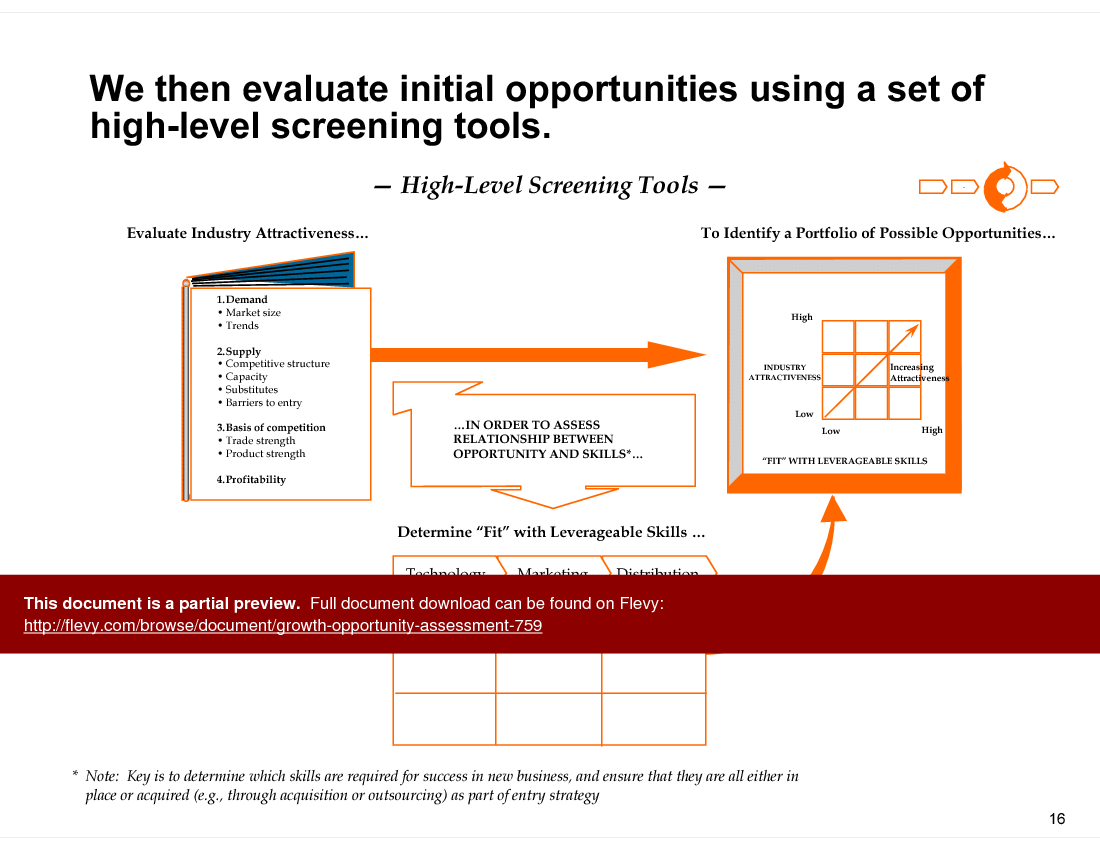
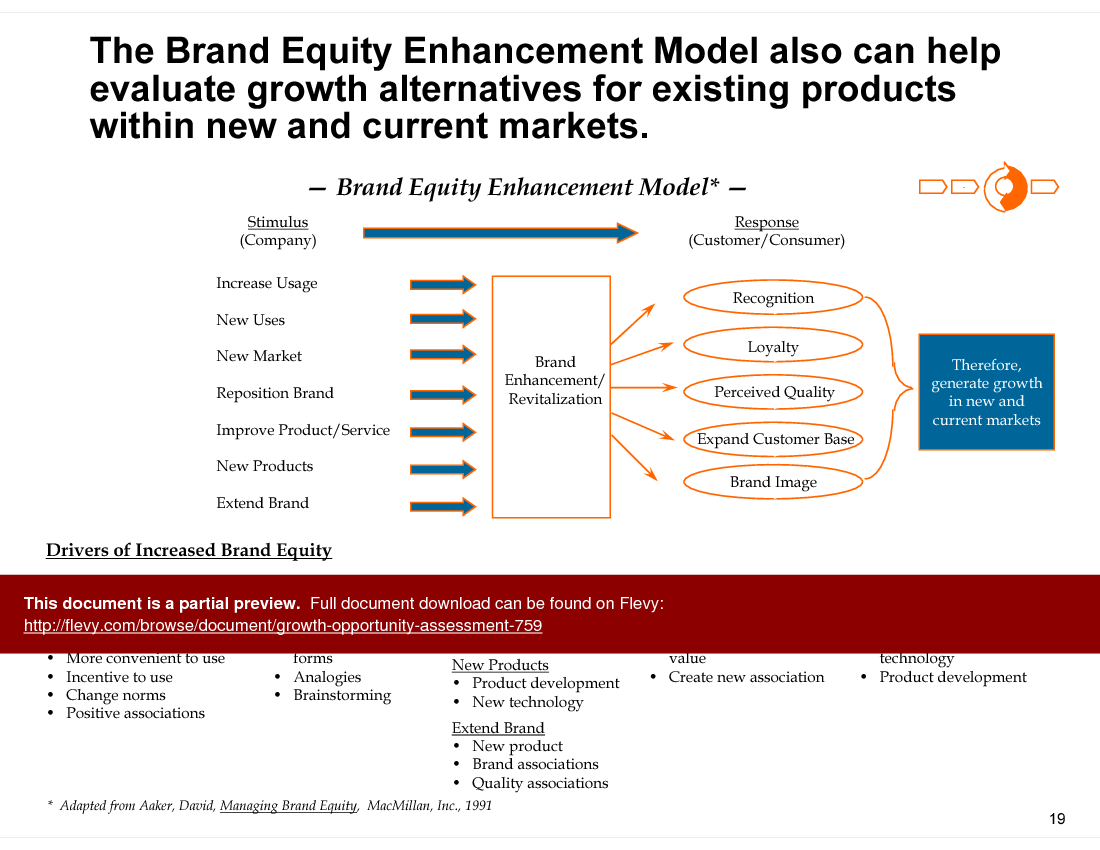
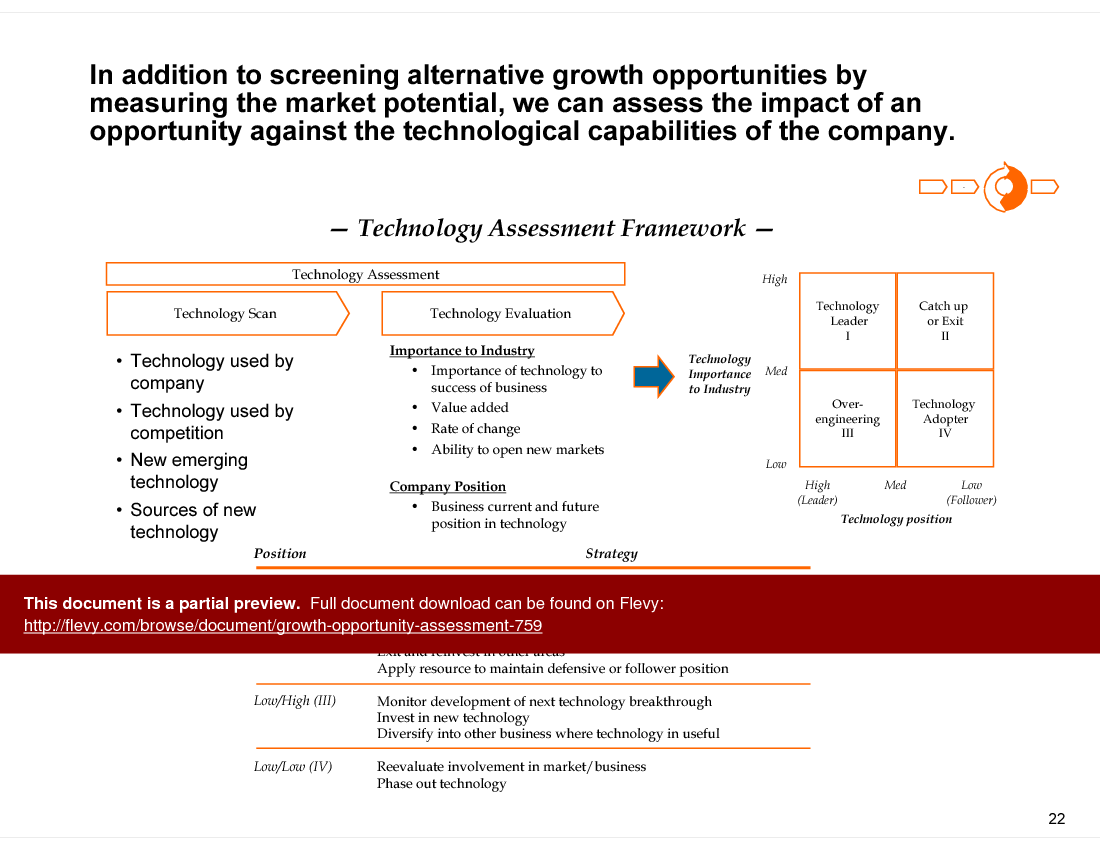
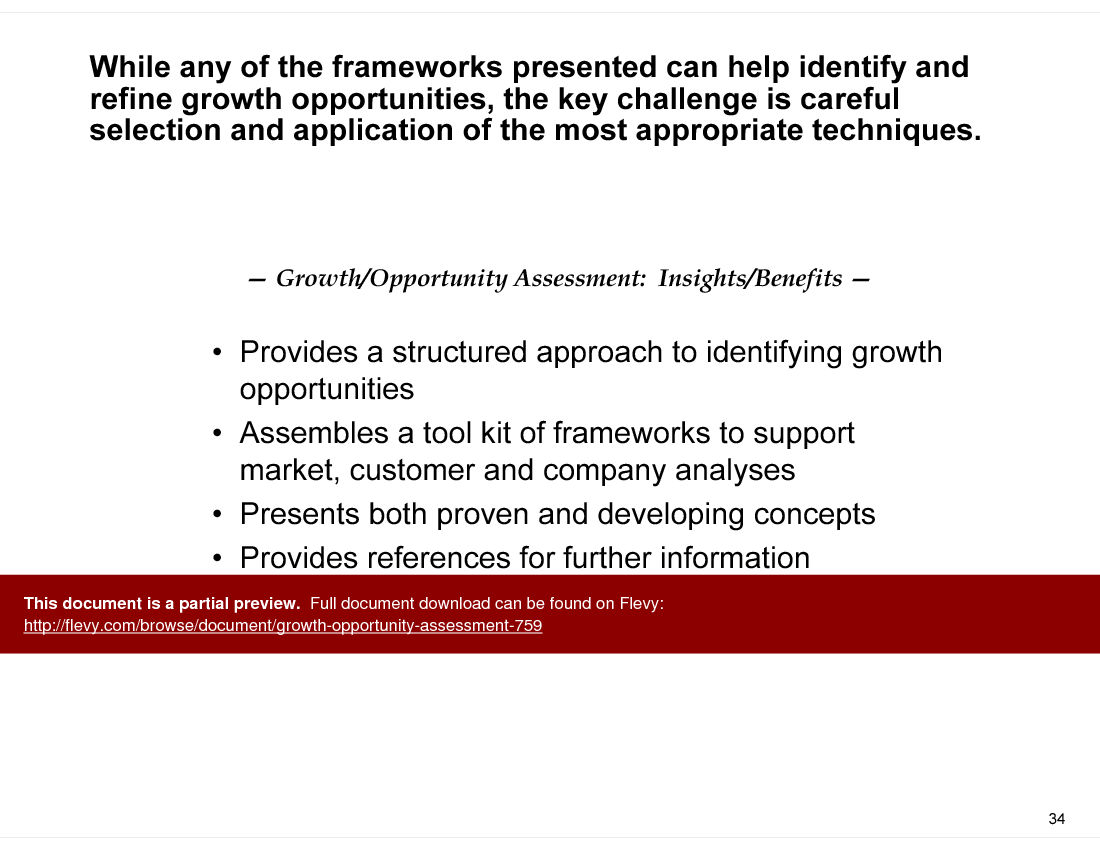
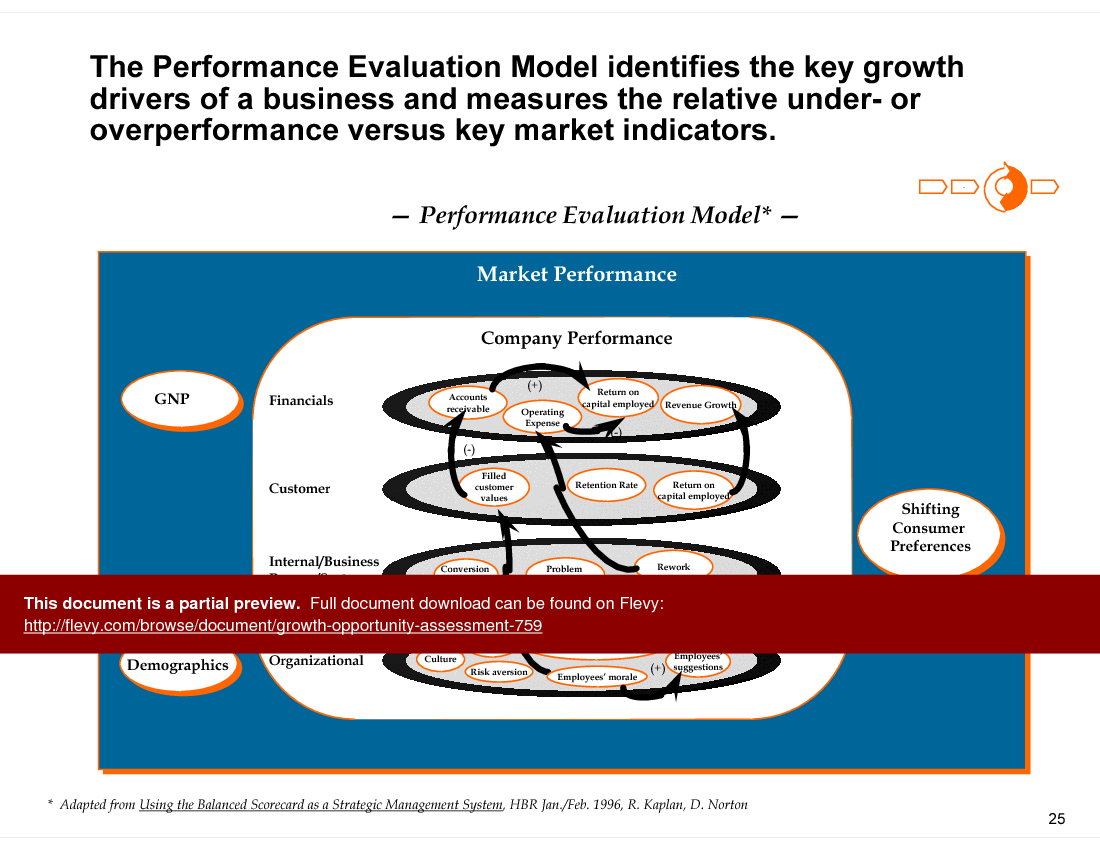
This comprehensive Growth Opportunity Assessment document leverages a variety of established frameworks to provide a robust analysis. From the Industry Attractiveness Matrix to the Risk-Return Model, each framework is carefully chosen to address different facets of growth potential. These tools are not just theoretical; they have been widely adopted across industries, ensuring their practical applicability and relevance.
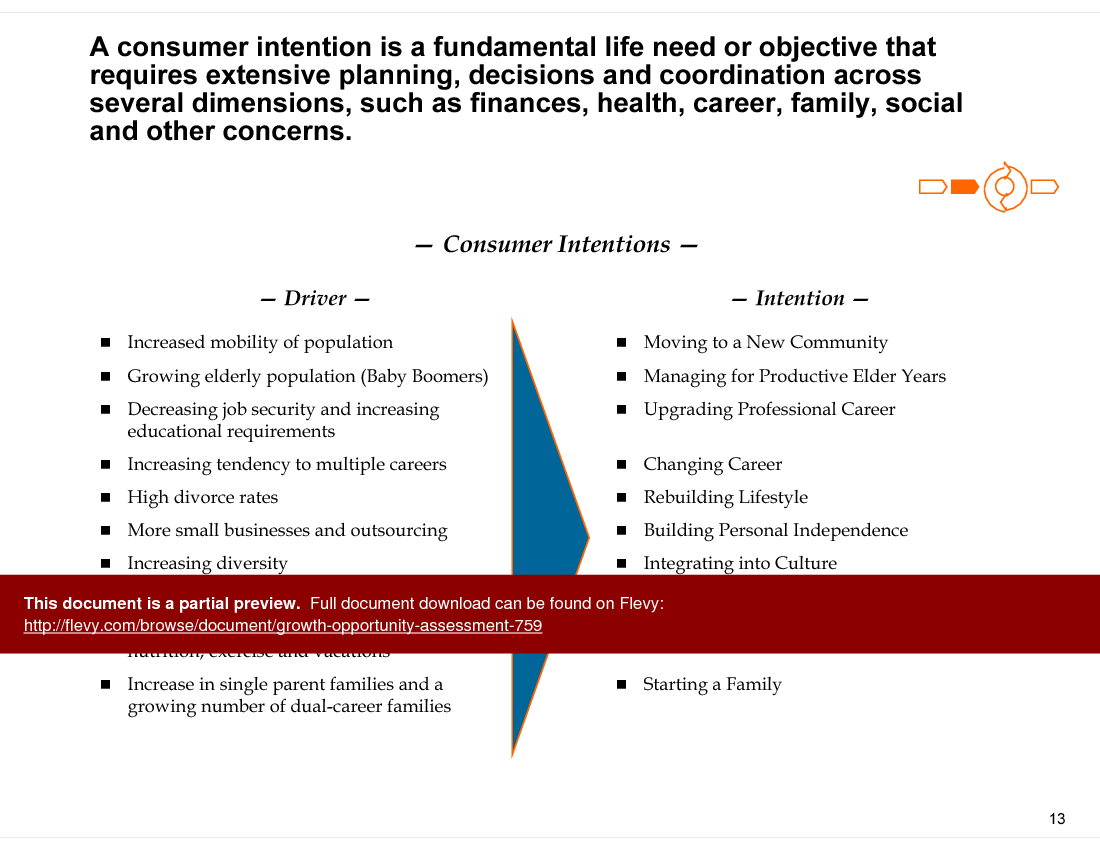
The document also delves into the importance of understanding consumer intentions. By analyzing drivers such as population mobility and increasing diversity, it identifies key consumer needs like upgrading professional careers and starting a family. This focus on consumer behavior helps in crafting strategies that are aligned with market demands, making the growth opportunities more viable and targeted.
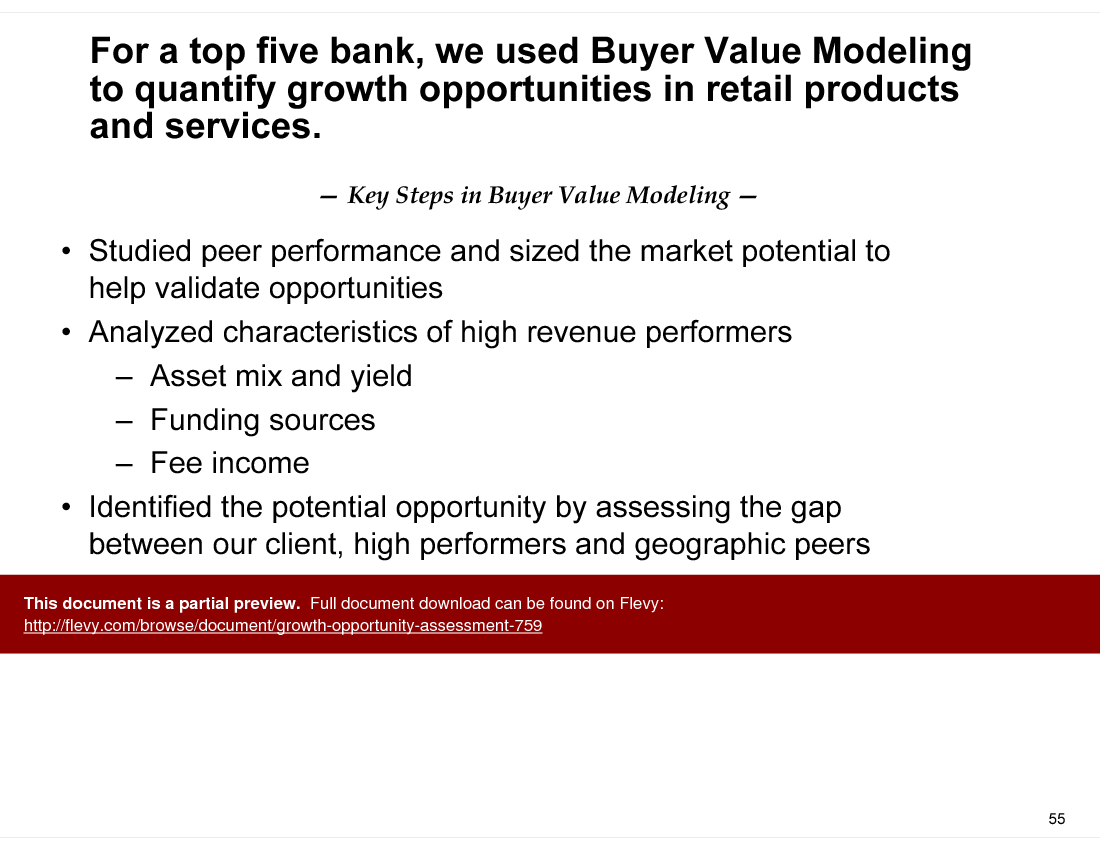
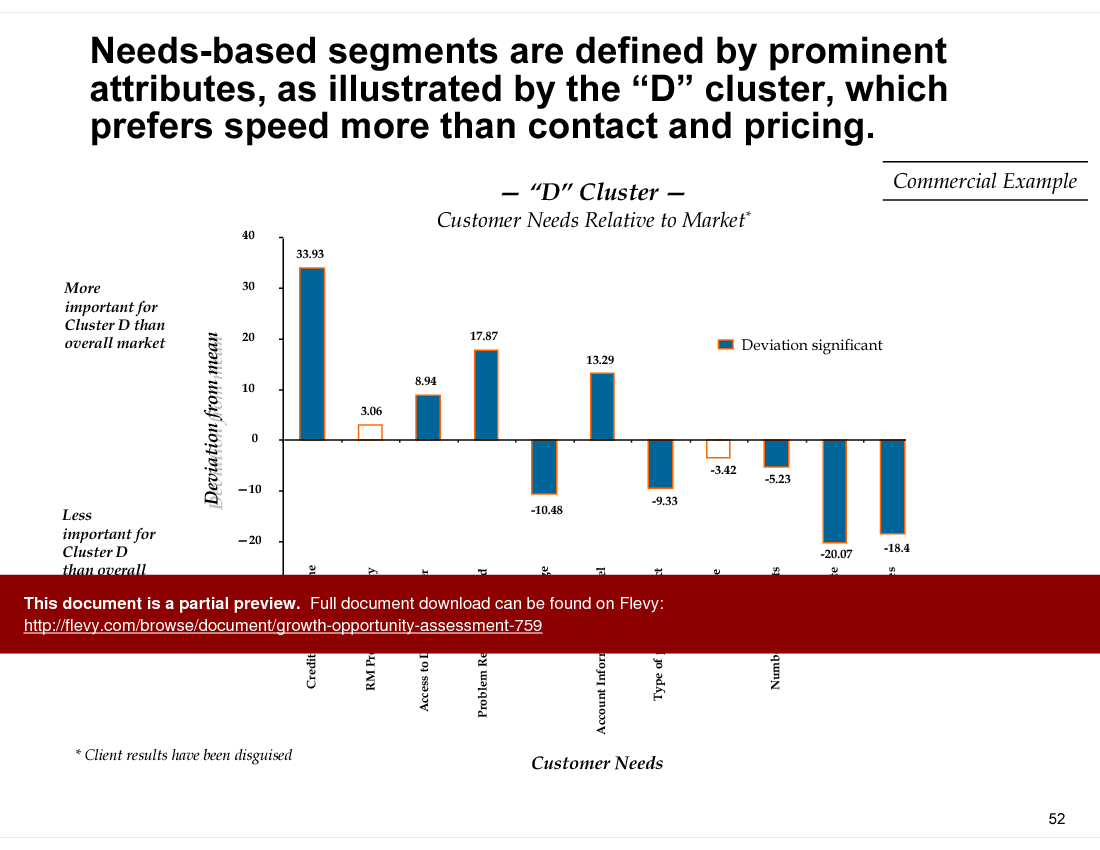
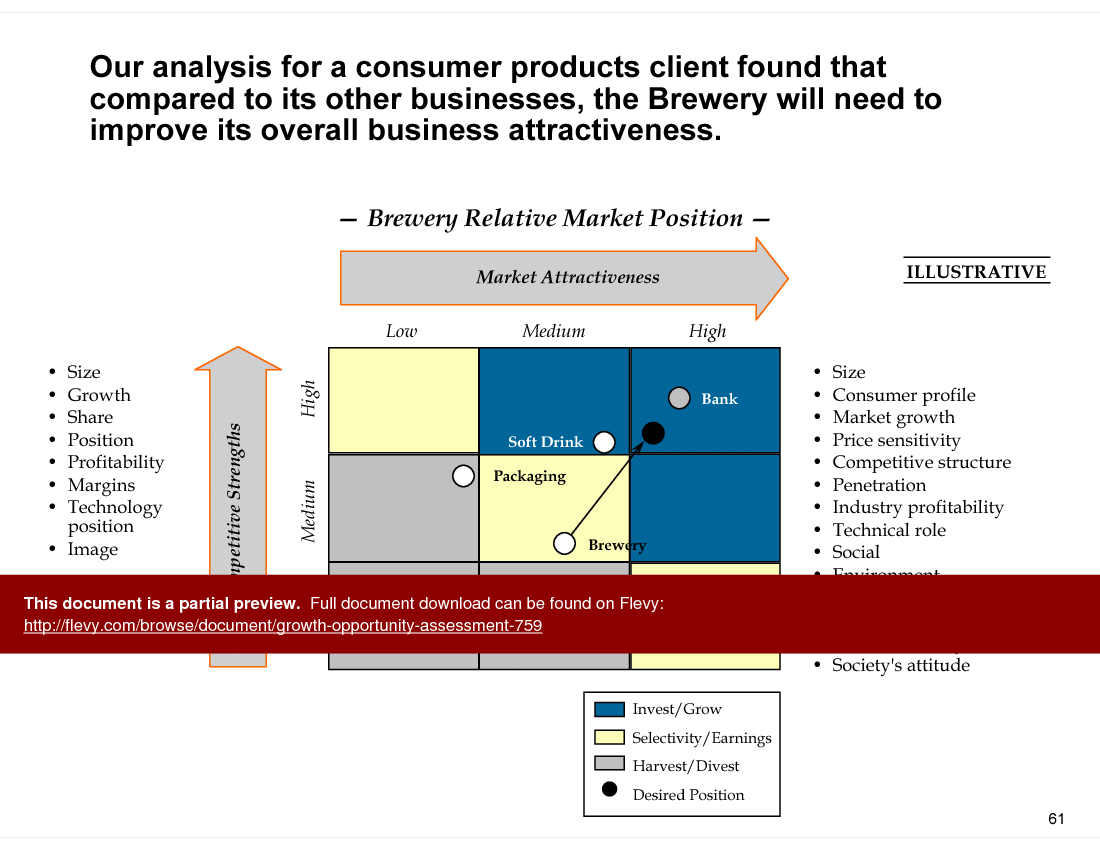
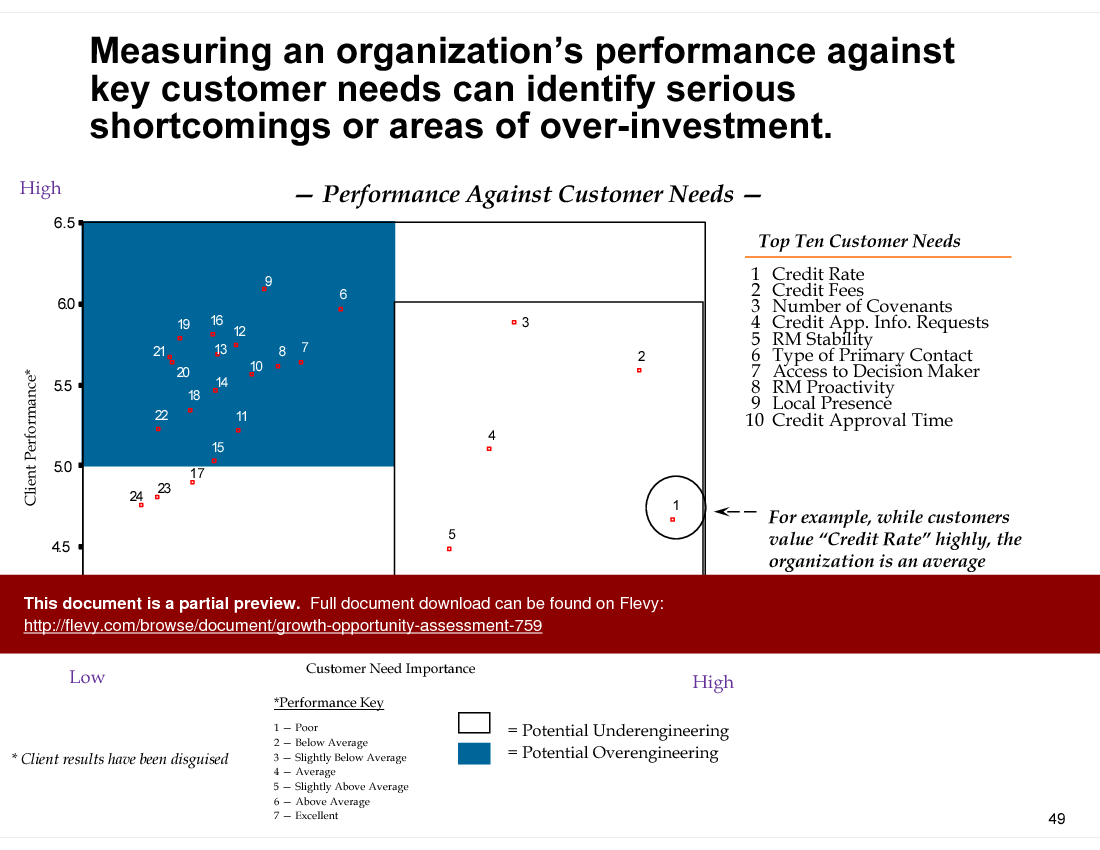
Real-world case examples are included to illustrate the application of these frameworks. Whether it's a top-five bank using Buyer Value Modeling to identify growth in retail products or a consumer products client needing to improve business attractiveness, these cases provide actionable insights. These examples underscore the practical utility of the document, making it a valuable resource for executives looking to drive growth in their organizations.
Got a question about the product? Email us at support@flevy.com or ask the author directly by using the "Ask the Author a Question" form. If you cannot view the preview above this document description, go here to view the large preview instead.
MARCUS OVERVIEW
This synopsis was written by Marcus [?] based on the analysis of the full 76-slide presentation.
Executive Summary
The Growth Opportunity Assessment presentation provides a structured framework for evaluating and capitalizing on growth opportunities, designed with the rigor expected of a McKinsey, Bain, or BCG-quality consulting-grade presentation (not affiliated). This deck equips corporate executives and consultants with the tools to analyze market dynamics, prioritize strategic alternatives, and implement actionable growth strategies. By leveraging proven frameworks and methodologies, users will be able to identify high-potential markets, assess competitive positioning, and develop tailored strategies that align with their organizational capabilities.
Who This Is For and When to Use
• Corporate executives seeking to drive growth within their organizations
• Business development teams focused on identifying new market opportunities
• Strategic planners analyzing competitive landscapes and market dynamics
• Consultants advising clients on growth strategies and opportunity assessments
Best-fit moments to use this deck:
• During strategic planning sessions to evaluate potential growth avenues
• When conducting market analysis to identify and prioritize opportunities
• In workshops aimed at aligning teams on growth strategies and frameworks
• For presentations to stakeholders on growth potential and strategic recommendations
Learning Objectives
• Define key frameworks for assessing growth opportunities
• Build a comprehensive market profile to identify potential areas for expansion
• Establish prioritization criteria for evaluating strategic alternatives
• Generate actionable insights from buyer value modeling and market analysis
• Develop metrics for monitoring growth initiatives and performance
• Create a structured approach to screening and validating growth opportunities
Table of Contents
• Basic Frameworks and Challenges (page 2)
• Approach to Growth/Opportunity Assessment (page 8)
• Case Examples (page 36)
• Client Experiences and References (page 75)
Primary Topics Covered
• Basic Frameworks - Overview of widely used frameworks for opportunity assessment, including the Growth Share Matrix and Industry Attractiveness Matrix.
• Market Segmentation - Techniques for segmenting markets to identify high-potential opportunities based on buyer behavior and preferences.
• Buyer Value Modeling - A method for quantifying buyer preferences and simulating switching behavior to optimize growth strategies.
• Strategic Alternatives - Evaluation of various strategic options for growth, including market penetration and product line development.
• Performance Evaluation - Tools for assessing organizational performance against market indicators and growth objectives.
• Innovation Capability - Framework for evaluating a company's capacity to capture innovative opportunities and leverage technological advancements.
Deliverables, Templates, and Tools
• Market profile template for assessing demand, supply, and competitive dynamics
• Buyer value modeling framework to quantify customer preferences
• Strategic game board for exploring various growth strategies
• Performance evaluation model to measure growth drivers against market indicators
• Industry attractiveness/business strength matrix for portfolio analysis
• Brand equity enhancement model to evaluate growth alternatives for existing products
Slide Highlights
• Overview of the Basic Growth Opportunity Assessment Frameworks slide, detailing key methodologies.
• Strategic Game Board slide illustrating various growth strategies and market options.
• Buyer Value Modeling slide demonstrating how to quantify buyer preferences and simulate behavior.
• Innovation Capability Model slide outlining the steps for assessing an organization’s capacity for innovation.
• Performance Evaluation Model slide identifying key growth drivers and market performance metrics.
Potential Workshop Agenda
Introduction to Growth Opportunity Assessment (30 minutes)
• Overview of frameworks and methodologies
• Discussion on the importance of growth assessment
Market Analysis and Segmentation (60 minutes)
• Conducting market profiling
• Identifying and prioritizing high-potential segments
Buyer Value Modeling Workshop (90 minutes)
• Hands-on session to simulate buyer preferences
• Developing actionable insights from buyer data
Customization Guidance
• Tailor market profiles to reflect specific industry dynamics and competitive landscapes
• Adapt buyer value models to align with unique customer segments and preferences
• Modify strategic alternatives based on organizational capabilities and market conditions
• Update performance evaluation metrics to reflect specific growth objectives and KPIs
Secondary Topics Covered
• Industry dynamics and regulatory considerations impacting growth
• Competitive positioning and market entry strategies
• Customer franchise management and retention strategies
• Technological advancements and their implications for growth
• Case studies illustrating successful growth strategies in various industries
FAQ What frameworks are included in the Growth Opportunity Assessment?
The presentation includes frameworks such as the Growth Share Matrix, Industry Attractiveness Matrix, and Buyer Value Modeling, among others.
How can I customize the templates provided in this deck?
Templates can be tailored by incorporating specific market data, adjusting metrics to align with organizational goals, and modifying strategic alternatives based on unique capabilities.
What types of case examples are included?
The deck features case examples from industries such as insurance, banking, and consumer products, illustrating the application of the frameworks in real-world scenarios.
How does Buyer Value Modeling work?
Buyer Value Modeling quantifies customer preferences through surveys and simulations, enabling organizations to optimize their value propositions based on buyer behavior.
Can this assessment be applied to international markets?
Yes, the frameworks and methodologies are designed to be adaptable for various markets, including international contexts.
What are the key performance indicators for measuring growth?
Key performance indicators may include market share, revenue growth, customer acquisition rates, and profitability metrics.
How do I prioritize growth opportunities?
Prioritization can be achieved by evaluating opportunities against criteria such as market attractiveness, alignment with organizational capabilities, and potential return on investment.
What is the significance of the Strategic Game Board?
The Strategic Game Board helps visualize and explore various growth strategies, allowing teams to assess their relative attractiveness and feasibility.
Glossary
• Buyer Value Modeling - A framework for quantifying buyer preferences and simulating switching behavior.
• Growth Share Matrix - A tool for assessing business units based on market growth and market share.
• Industry Attractiveness Matrix - A framework for evaluating the attractiveness of various industries based on competitive dynamics.
• Market Profile - A comprehensive analysis of market demand, supply, and competitive landscape.
• Performance Evaluation Model - A tool for measuring organizational performance against key market indicators.
• Strategic Alternatives - Various options available for pursuing growth, including market penetration and product development.
• Brand Equity Enhancement Model - A framework for evaluating growth alternatives for existing products.
• Innovation Capability Model - A tool for assessing an organization’s capacity to capture innovative opportunities.
• Market Segmentation - The process of dividing a market into distinct groups of buyers with different needs or behaviors.
• Consumer Intentions - Fundamental life needs or objectives that require planning and coordination across various dimensions.
• Strategic Funds Allocation Model - A framework for evaluating and allocating resources to strategic opportunities.
• SWOT Analysis - A tool for identifying strengths, weaknesses, opportunities, and threats related to a business or project.
This PPT slide outlines fundamental frameworks for assessing growth opportunities within organizations, categorized into Basic Frameworks and Frameworks Related to Growth. The Basic Frameworks include the Industry Attractiveness/Business Strengths & Competitive Position Matrix, which analyzes portfolio performance against industry attractiveness; the Industry Maturity/Competitive Position Matrix, visualizing Strategic Business Units (SBUs) based on industry maturity; the Growth Share Matrix, evaluating business units by lifecycle phase; and the Buyer Purchase Criteria framework, assessing product characteristics influencing purchasing decisions. Frameworks Related to Growth feature the PIMS Analysis, identifying profitability factors; Product Profit/Contribution Analysis, evaluating offering profits; the Risk-Return Model, analyzing portfolio risks and returns; and the Business/Industry Analyses model, linking industry developments to future trends.
This PPT slide presents a framework for evaluating growth strategies based on market attractiveness and competitive strengths. The matrix categorizes strategic options into 4 quadrants, facilitating a visual assessment relative to "Beer Co. Today," positioned in the medium competitive strength and medium market attractiveness quadrant. The x-axis represents market attractiveness (low, medium, high), while the y-axis indicates competitive strengths (also low, medium, high). Options in the high market attractiveness quadrant suggest promising expansion avenues, whereas those in the low quadrant may need reevaluation. A thorough assessment of these strategies against corporate return requirements is essential for aligning growth initiatives with business objectives, enabling effective resource allocation and risk identification.
This PPT slide outlines a structured approach to growth and opportunity assessments, divided into 5 key phases. The "Business/Market Profile" emphasizes understanding market dynamics to identify growth opportunities. The "High-Level Opportunity" phase introduces a strategic game board for visualizing and categorizing opportunities based on attractiveness and feasibility. "High-Level Screening" evaluates the initial attractiveness of opportunities, filtering out less viable options. The "Strategic Alternatives" section explores various pathways, highlighting the importance of considering multiple strategies. The "Detailed-Level Screening" assesses alternatives against specific business requirements, ensuring alignment with organizational capabilities. Finally, "Prioritization" focuses on selecting the most promising growth opportunities based on insights gathered throughout the assessment.
This PPT slide outlines a structured approach to assessing growth opportunities through market and competitive analysis, focusing on 4 components: Customers, Company, Competition, and Economics. The "Customers" section examines segment profiles, buyer behavior, and channel structure, emphasizing the need to understand customer dynamics for effective strategy development. The "Company" segment highlights vision, strategy, business strength, and resource capability, indicating that internal competencies are crucial for leveraging market opportunities. The "Competition" area analyzes competitive intensity, financial performance, and operational benchmarks, helping identify a company's market position. Lastly, the "Economics" section addresses industry value chains, supplier dynamics, and product profitability, underscoring the importance of economic conditions on growth potential. This framework aids executives in aligning growth initiatives with market opportunities and organizational strengths.
This PPT slide outlines a structured methodology for conducting growth and opportunity assessments. The process begins with analyzing the business and market profile to identify potential growth avenues. Next, high-level opportunities are generated through brainstorming, leading to a cyclical process of high-level screening, strategic alternatives, and detailed-level screening. High-level screening evaluates opportunities based on feasibility and alignment with business objectives. The strategic alternatives phase explores various pathways to capitalize on selected opportunities. Detailed-level screening rigorously analyzes shortlisted alternatives to assess their viability and potential impact. Finally, prioritizing opportunities focuses resources on the most promising initiatives, ensuring data-driven and strategically sound decision-making.
This PPT slide presents a strategic framework for identifying growth opportunities by expanding beyond core offerings. It features a two-dimensional matrix with axes labeled "Markets" and "Products/Services," highlighting intersections of current and new markets with current and new products. Central to the framework is capturing customer intentions, which informs innovative strategies. Surrounding this core are concentric circles representing levels of leverage: existing business, assets, and capabilities. The outer circle suggests an outward expansion strategy into new markets and product lines. Emphasizing consumer intention underscores the need to understand customer preferences for sustainable growth. By leveraging existing strengths and innovating, organizations can enhance market presence and diversify offerings.
The Channel Assessment Model identifies opportunities within a company's channel structure, emphasizing customer needs at its core. Key components include Channel Selection, which evaluates various channels based on customer types, cost structures, scalability, and alignment with product strategies. Channel Management focuses on developing processes and infrastructure for effective operations, setting performance objectives, and institutionalizing necessary behaviors. Channel Performance Management identifies intermediary functions and needs, ensuring channels meet customer expectations and align with strategic goals. By applying this model, organizations can uncover opportunities for improvement and growth, optimizing channel strategies to respond effectively to market demands.
This PPT slide outlines a structured approach to evaluating business opportunities using high-level screening tools. It begins with assessing industry attractiveness through 4 components: demand, supply, basis of competition, and profitability. Demand analysis focuses on market size and trends to gauge customer potential and growth. Supply evaluation examines competitive structure, capacity, substitutes, and barriers to entry, revealing market dynamics. The basis of competition assesses trade strength and product strength for market positioning. Profitability analysis determines financial viability.
The slide also presents a matrix correlating industry attractiveness with opportunity fit against leverageable skills, categorizing opportunities into 4 quadrants based on attractiveness and company capabilities in technology, marketing, and distribution. This visual aids in prioritizing opportunities aligned with organizational strengths, ensuring informed strategic investment in growth initiatives.
This PPT slide analyzes consumer buyer values for a leading bank, focusing on increasing high-value customers, specifically Diamond and Platinum segments. The table categorizes profit segments from Diamond (2% of the customer base) to Bronze (20%), detailing buyer values across 4 dimensions: Relationship, Channel, Speed, and Price. Diamond customers prioritize Relationship (60) over Price (20), while Bronze customers exhibit a balanced value distribution, emphasizing Channel (50). The analysis questions the distribution of buyer values and explores similarities between segments. It highlights the need to refine value propositions by potentially de-emphasizing certain buyer values to avoid attracting less profitable customers, ensuring a focus on segments with the highest growth potential.
This PPT slide presents a structured framework for developing consumer buyer value-driven strategies centered on segment-level value propositions informed by customer needs. It begins with customer analysis and segmentation to identify distinct groups for tailored strategies. Key components include product range, features, pricing strategies, image and communication, service level, distribution channels, and customer processes, all critical in shaping perceived value. The framework outlines subsequent steps such as market testing and economic evaluations to validate strategies, culminating in the launch of effective offerings. This approach provides a roadmap for organizations to refine customer engagement strategies and optimize market performance.
The Industry Market Potential Model assesses growth opportunities by quantifying potential sales and identifying exploitable market gaps. The model defines Industry Market Potential (BMP) as the maximum possible sales, representing 100% of potential users. Growth opportunity is calculated by comparing BMP to current sales, revealing the Competitive Gap (CG) between current and relevant industry sales. Market gaps are categorized into 3 areas: Product Line Gap (PLG), Distribution Gap (DG), and Usage Gap (UG). Strategies to address these gaps include expanding the product line, increasing distribution coverage, and attracting new users or enhancing current usage. This structured approach enables organizations to evaluate market positions and identify actionable strategies aligned with growth objectives.
The "Industry Cycle Capability Model" categorizes the industry life cycle into 5 stages: Pioneering, Venturing, Exploiting, and Architecting. In the Pioneering stage, companies focus on innovation, creating viable concepts through new value propositions. The Venturing stage emphasizes growth, where identifying consumer and industry trends is crucial, along with acquiring established competitors. The Exploiting phase targets growth and profitability by extending proven concepts and leveraging market dynamics. Finally, the Architecting stage focuses on profitability and industry management, where companies exploit opportunities to reshape mature industry structures. This model serves as a strategic framework for aligning capabilities with the demands of each life cycle stage.
This PPT slide presents a performance analysis framework that evaluates organizational effectiveness in meeting customer needs. It utilizes a two-axis grid to plot attributes based on importance to customers and organizational performance. The vertical axis represents client performance (low to high), while the horizontal axis indicates customer need importance (low to high). Key attributes include "Strategy" and "Advice" in the upper left quadrant, indicating high customer value, but average performance, suggesting areas for improvement. Other attributes like "Local Presence," "Pitch Integrity," and "Problem Resolution" are also highlighted. The lower quadrants feature "Innovation" and "Price," which may influence overall satisfaction. This analysis serves as a strategic tool for decision-makers, highlighting strengths and weaknesses in service delivery and guiding initiatives to better align with client expectations.
This PPT slide presents a framework for understanding consumer intentions through strategic business alliances. Key consumer intentions include personal development, professional development, housing, financial security, health, entertainment, and routine planning. Businesses must recognize these intentions to tailor their offerings effectively. The "Manage to Productive Elder Years Integrator" serves as a central hub connecting services that meet these consumer needs, such as travel assistance, pharmaceutical services, and financial planning. Fulfilling these intentions requires careful planning and the establishment of collaborative networks among businesses, emphasizing that a singular approach is insufficient for addressing complex consumer needs. Understanding consumer intentions and leveraging business alliances is essential for delivering value in today's market.
This PPT slide analyzes a brewery's market position within the consumer products sector using a two-dimensional matrix that contrasts market attractiveness and competitive strengths. The horizontal axis categorizes market attractiveness as low, medium, or high, while the vertical axis rates competitive strengths similarly. The brewery is positioned in the low attractiveness and medium strength quadrant, indicating a need for improvement in its market appeal compared to peers like "Soft Drink" and "Bank." Key factors influencing this analysis include size, growth, share, profitability, and market dynamics. The recommendation to "Invest/Grow" suggests strategic initiatives to enhance the brewery's market position, such as exploring new growth opportunities and refining marketing strategies to align with consumer preferences.
This PPT slide presents a framework for Buyer Value Modeling, focusing on identifying growth opportunities through buyer preferences and behavior analysis. Central to this model is Buyer Value Analysis, which utilizes conjoint tradeoff surveys to quantify consumer values on product features. This analysis enables value-based segmentation, categorizing consumers by perceived value to assess segment attractiveness. Key components influencing segment-level value propositions include product features, pricing strategies, distribution channels, service levels, and marketing messages, all of which must be interconnected for optimizing offerings. Market testing validates buyer value insights through practical tests, leading to economic evaluations that calculate net present value (NPV) of segments based on cash flow projections and competitive scenarios. This structured approach aims to align strategies with consumer preferences and market dynamics, enhancing profitability and driving growth.
This PPT slide outlines 3 primary strategies for enhancing customer bases and franchise growth: Customer Franchise Management, Channel Management, and Product/Service Management.
Customer Franchise Management focuses on attracting, retaining, and developing customers through segmentation, personalized marketing, and lifetime predictive models to foster loyalty. Channel Management emphasizes enhancing customer interaction channels, suggesting companies should innovate engagement methods to retain existing customers. The phrase "Become the channel" indicates a transformative approach to integrating into the customer journey.
Product/Service Management encourages innovation in offerings to attract and retain customers by aligning product development with consumer intentions and market demands. Each strategy is interconnected, indicating that a holistic approach may yield optimal growth results.
This PPT slide analyzes growth markets in the life promotions sector using a two-dimensional matrix based on market attractiveness and ease of entry. The vertical axis represents market attractiveness, influenced by size, growth, penetration, and regulatory conditions. The horizontal axis indicates ease of entry, factoring in competition and barriers. Markets are depicted as circles, with size correlating to life premiums in US dollars for 1993. France and Italy are in the upper right quadrant, denoting attractiveness and ease of entry. Germany, with a life premium of 71 billion, presents a significant, but slightly more challenging market. India and Indonesia, with life premiums of 3 billion and 0.5 billion respectively, also show favorable entry conditions, suggesting potential opportunities despite smaller market sizes. Companies should prioritize these markets for expansion in the life promotions sector.
This PPT slide analyzes life insurance markets globally, focusing on real compound annual growth rates (CAGR) from 1989 to 1993. The x-axis represents total life premiums in billions of USD, while the y-axis indicates growth rates. Japan leads with life premiums of 273 billion USD and a significant growth rate. South Korea follows with 236 billion USD in premiums and a 33% growth rate. The USA and UK show substantial premiums, but varied growth rates, indicating maturity. European countries like Germany and France exhibit moderate premiums and growth. Emerging markets such as Poland and China show lower metrics, suggesting growth opportunities. The visual uses circles to highlight market sizes, aiding stakeholders in identifying growth potential in European and Far Eastern markets.
Source: Best Practices in Growth Strategy PowerPoint Slides: Growth Opportunity Assessment PowerPoint (PPT) Presentation Slide Deck, Documents & Files
Since 2012, we have provided business templates to over 10,000 businesses and organizations of all sizes, from startups and small businesses to the Fortune 100, in over 130 countries.
Read Customer Testimonials
"Flevy.com has proven to be an invaluable resource library to our Independent Management Consultancy, supporting and enabling us to better serve our enterprise clients.
The value derived from our [FlevyPro] subscription in terms of the business it has helped to gain far exceeds the investment made, making a subscription a no-brainer for any growing consultancy – or in-house strategy team."
– Dean Carlton, Chief Transformation Officer, Global Village Transformations Pty Ltd.
"[Flevy] produces some great work that has been/continues to be of immense help not only to myself, but as I seek to provide professional services to my clients, it gives me a large "tool box" of resources that are critical to provide them with the quality of service and outcomes they are expecting."
– Royston Knowles, Executive with 50+ Years of Board Level Experience
"I like your product. I'm frequently designing PowerPoint presentations for my company and your product has given me so many great ideas on the use of charts, layouts, tools, and frameworks. I really think the templates are a valuable asset to the job."
– Roberto Fuentes Martinez, Senior Executive Director at Technology Transformation Advisory
"One of the great discoveries that I have made for my business is the Flevy library of training materials.
As a Lean Transformation Expert, I am always making presentations to clients on a variety of topics: Training, Transformation, Total Productive Maintenance, Culture, Coaching, Tools, Leadership Behavior, etc. Flevy
It is well worth the money to purchase these presentations. Sure, I have the knowledge and information to make my point. It is another thing to create a presentation that captures what I want to say. Flevy has saved me countless hours of preparation time that is much better spent with implementation that will actually save money for my clients.
"
– Ed Kemmerling, Senior Lean Transformation Expert at PMG
"I have used Flevy services for a number of years and have never, ever been disappointed. As a matter of fact, David and his team continue, time after time, to impress me with their willingness to assist and in the real sense of the word. I have concluded in fact
that it is not at all just a repository of documents/resources but, in the way that David and his team manage the firm, it is like dealing with consultants always ready to assist, advise and direct you to what you really need, and they always get it right.
I am an international hospitality accomplished senior executive who has worked and lived during the past 35 years in 23 countries in 5 continents and I can humbly say that I know what customer service is, trust me.
Aside from the great and professional service that Flevy's team provide, their wide variety of material is of utmost great quality, professionally put together and most current.
Well done Flevy, keep up the great work and I look forward to continue working with you in the future and to recommend you to a variety of colleagues around the world.
"
– Roberto Pelliccia, Senior Executive in International Hospitality
"FlevyPro provides business frameworks from many of the global giants in management consulting that allow you to provide best in class solutions for your clients."
– David Harris, Managing Director at Futures Strategy
"If you are looking for great resources to save time with your business presentations, Flevy is truly a value-added resource. Flevy has done all the work for you and we will continue to utilize Flevy as a source to extract up-to-date information and data for our virtual and onsite presentations!"
– Debbi Saffo, President at The NiKhar Group
"As a niche strategic consulting firm, Flevy and FlevyPro frameworks and documents are an on-going reference to help us structure our findings and recommendations to our clients as well as improve their clarity, strength, and visual power. For us, it is an invaluable resource to increase our impact and value."
– David Coloma, Consulting Area Manager at Cynertia Consulting
Save with Bundles
This document is available as part of the following discounted bundle(s):
Download our free compilation of 50+ Strategy & Transformation slides and templates. Frameworks include McKinsey 7-S, Balanced Scorecard, Disruptive Innovation, BCG Curve, and many more.