Editor Summary
Growth Strategy Report is a 50-slide PowerPoint growth strategy report for XYZ outlining a plan to capture a 15% share of the Australian kitchen renovation market (targeting $120 million in sales and $12–18 million EBIT) and includes 2 alternative rollout plans.
Read moreThe deck contains market analysis, 11 identified strategic opportunities narrowed to 2 primary options, business model assessment, financial projection model, implementation roadmap, performance management and capability gap tools. Reflects McKinsey/Bain/BCG-quality rigor (not affiliated). Sold as a digital download on Flevy.
Use this report when an organization needs to define and operationalize a growth plan for the Australian kitchen renovation market—whether entering new cities, scaling channels, or evaluating investment choices.
Corporate executives approving growth targets and resource allocation while reviewing projected sales and EBIT outcomes.
Strategic planners evaluating and selecting among multiple market opportunities, narrowing 11 options to preferred approaches.
Marketing and sales leaders designing showroom/channel strategies (branded showrooms vs. hardware multiples) and segment-specific value propositions.
Financial analysts stress-testing revenue, EBIT and funding needs using the provided projection and sensitivity templates.
The report’s structured flow—market analysis, options evaluation, business model assessment, financial projections, and implementation planning—follows consulting-grade strategy development used at McKinsey, Bain, and BCG.
This presentation is a growth strategy report of a major kitchen supplier in Australia. The deck has 49 slides. To achieve its growth objectives, the company has engaged a major consulting firm to:
• Define and articulate the business strategy that will deliver its growth and profit targets
• Identify the business model and capabilities the company will need to realise this strategy, and
• Assess what investment in time, effort and money will be called for to execute the strategy (including two alternative roll-out plans)
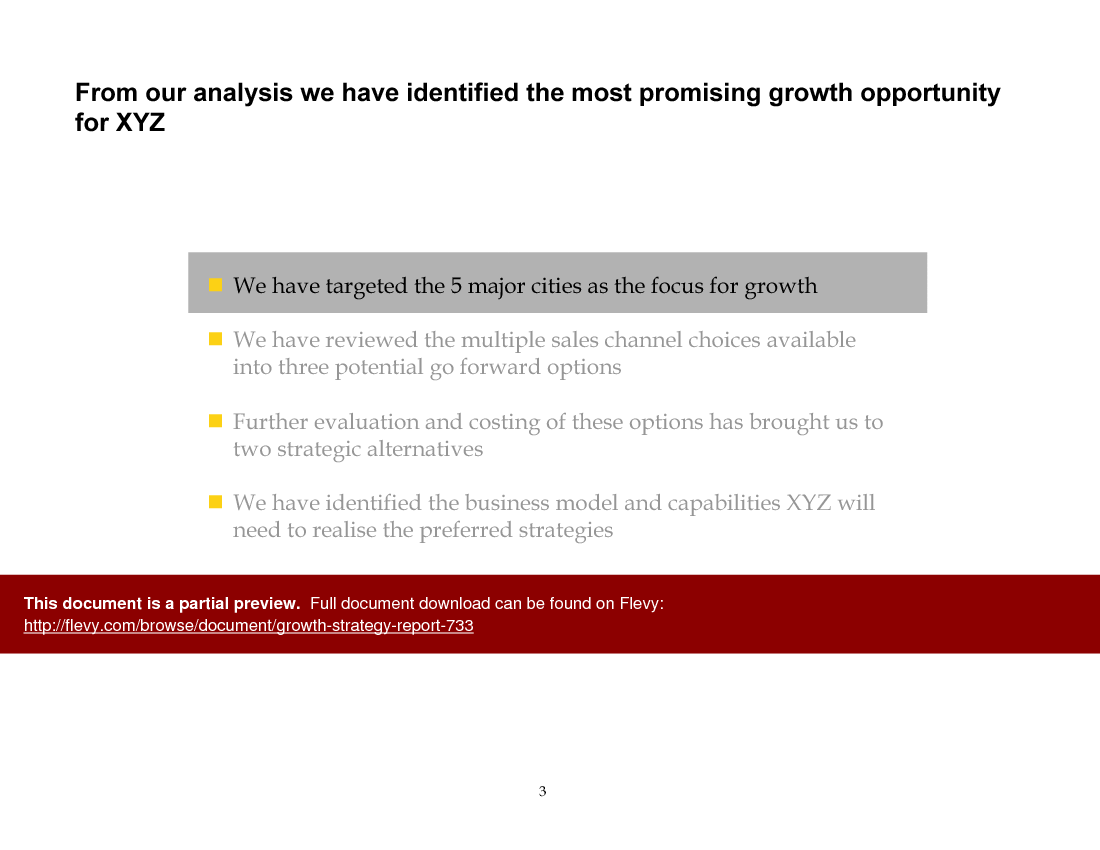
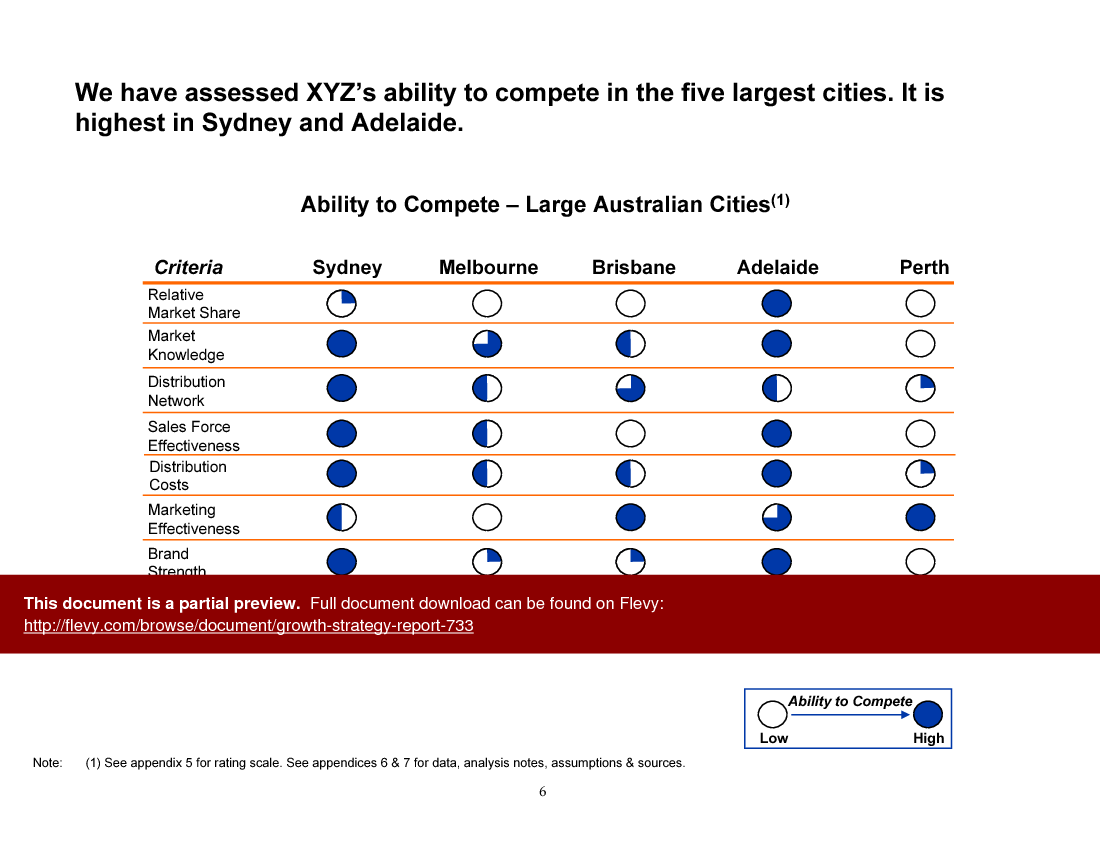
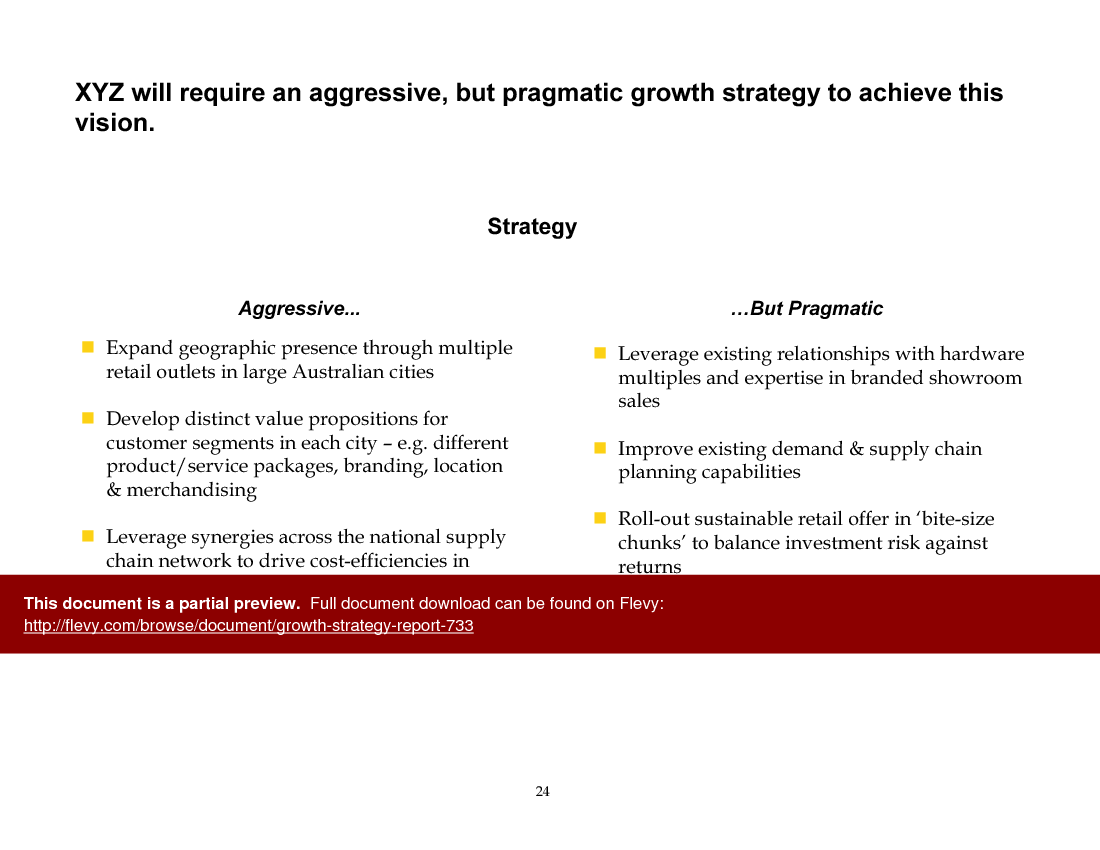
This comprehensive growth strategy report provides a detailed analysis of XYZ's ability to compete in Australia's five largest cities, with a particular focus on Sydney and Adelaide. The report includes a thorough assessment of market share, distribution networks, sales force effectiveness, and brand strength. It identifies key areas where XYZ can leverage its strengths and address gaps to enhance its market position.
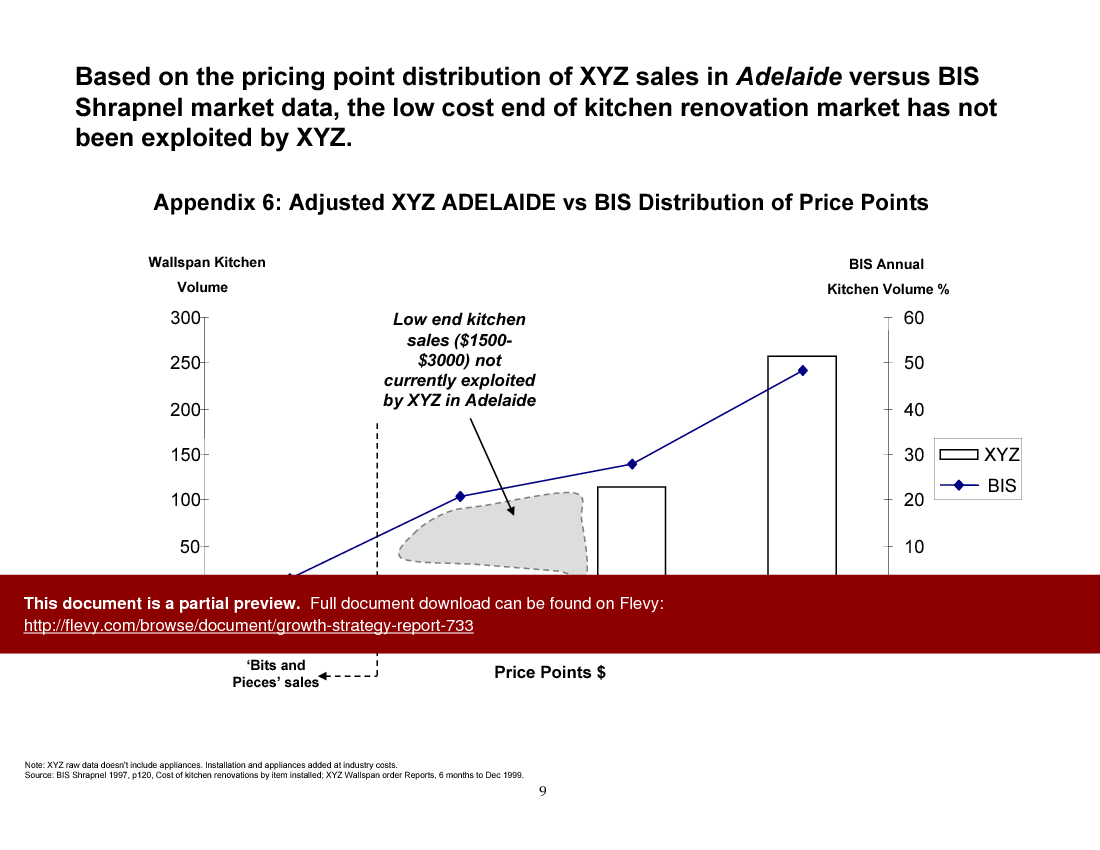
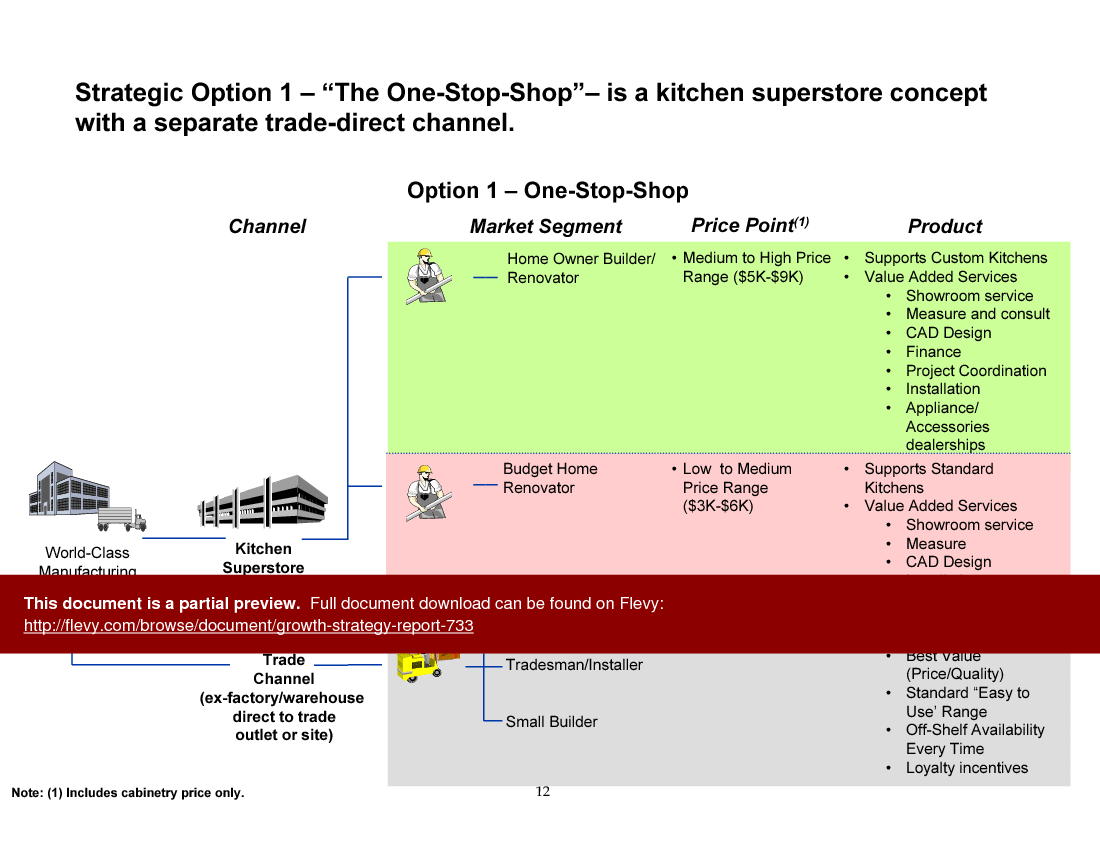
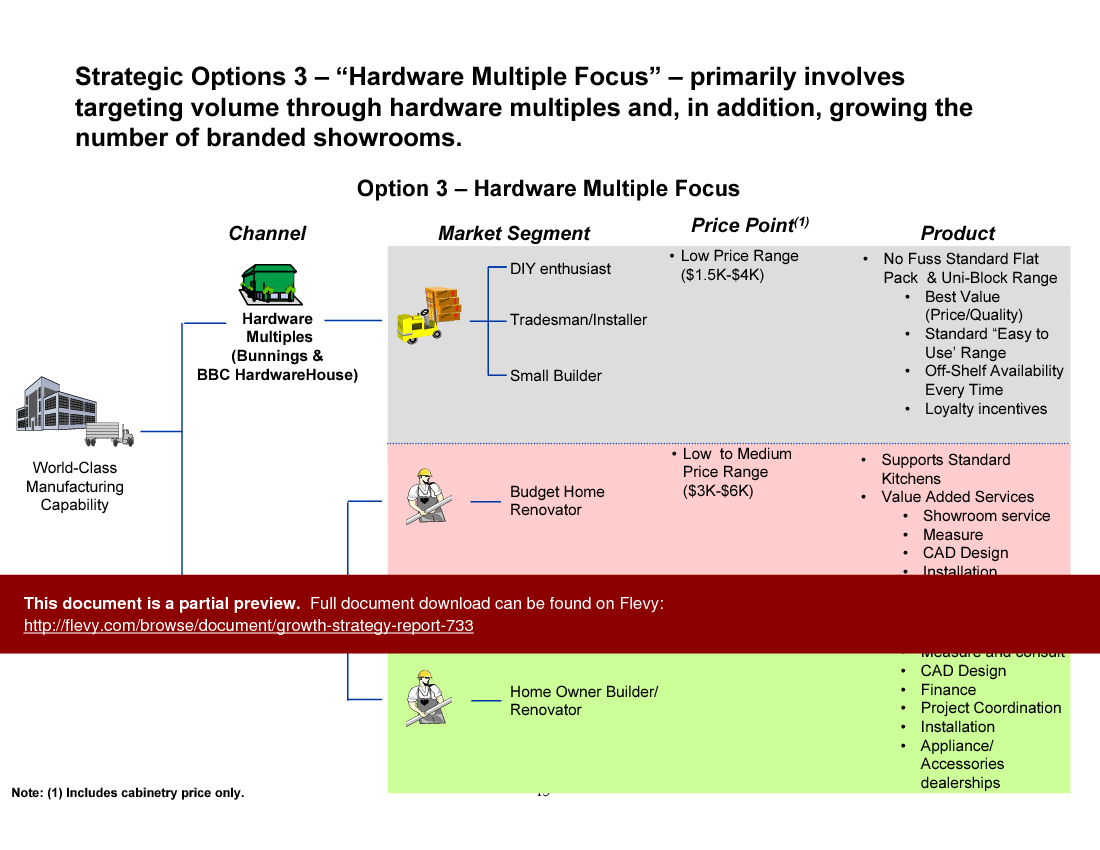
The document also explores various strategic options, such as the "One-Stop-Shop" concept and the "Hardware Multiple Focus" approach, to expand XYZ's market reach. Each strategy is evaluated based on market segments, price points, and value-added services, providing a clear roadmap for implementation. The report highlights the importance of targeting different customer segments with tailored value propositions to maximize growth potential.
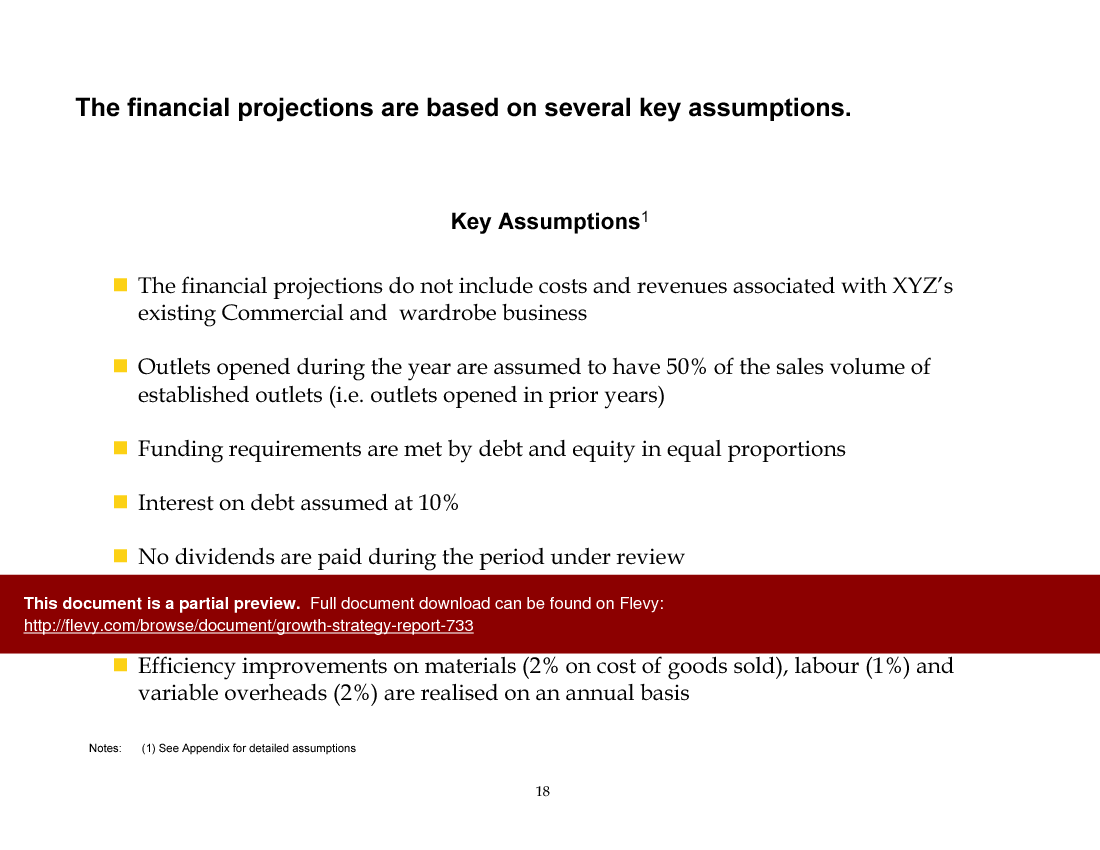
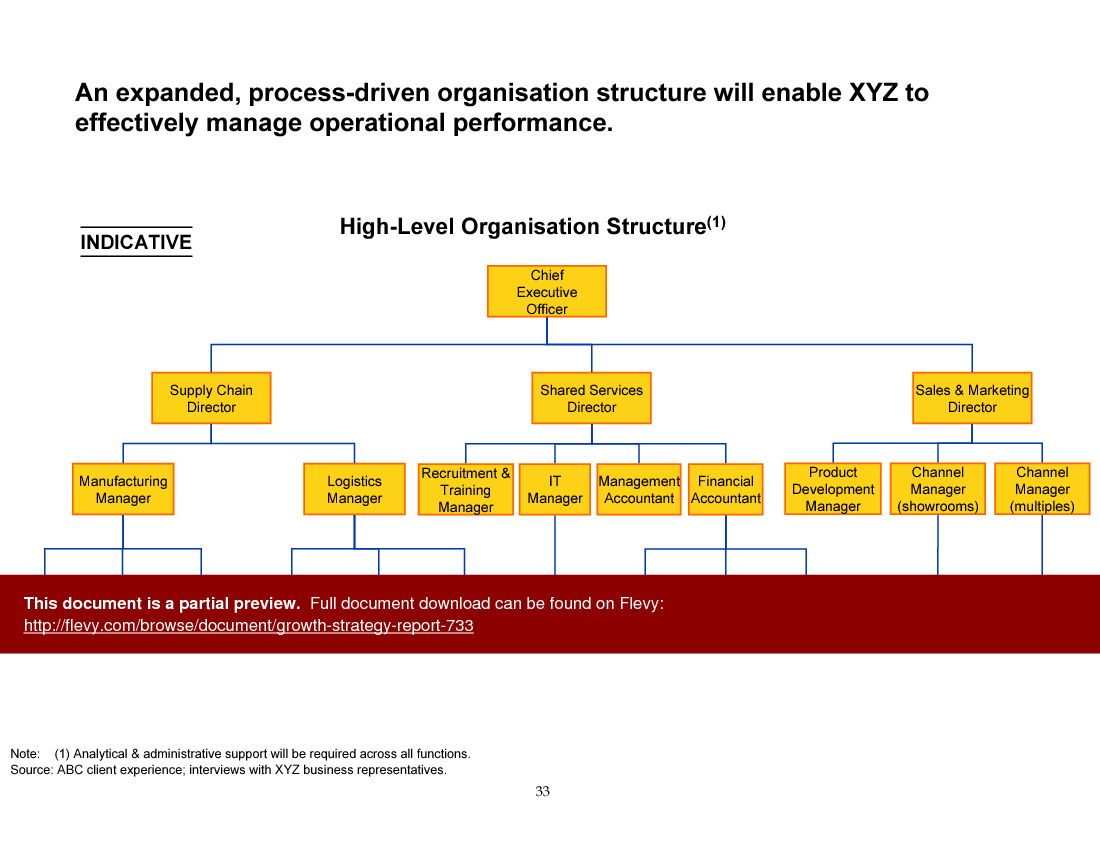
Financial projections and sensitivity analyses are included to provide a robust understanding of the investment required and the potential returns. The report outlines key assumptions and funding requirements, ensuring that executives have a clear picture of the financial landscape. The recommended program management structure is designed to align all projects with the overall growth objectives, ensuring seamless execution and integration across the organization.
Got a question about the product? Email us at support@flevy.com or ask the author directly by using the "Ask the Author a Question" form. If you cannot view the preview above this document description, go here to view the large preview instead.
MARCUS OVERVIEW
This synopsis was written by Marcus [?] based on the analysis of the full 50-slide presentation.
Executive Summary
This Growth Strategy Report outlines a detailed plan for XYZ, aiming to capture a 15% share of the Australian kitchen renovation market by the end of 2004, equating to $120 million in sales and an EBIT of $12–18 million. This consulting-grade document, reflecting McKinsey, Bain, or BCG-quality rigor (not affiliated), assists corporate executives in defining actionable strategies for significant growth. The report identifies critical business models, capabilities, and investment requirements necessary for successful execution, including 2 alternative rollout plans for strategic options.
Who This Is For and When to Use
• Corporate executives in the kitchen renovation industry
• Strategic planners and business development teams
• Marketing and sales leaders focusing on market expansion
• Financial analysts assessing investment opportunities
• Operations managers overseeing implementation of growth strategies
Best-fit moments to use this deck:
• During strategic planning sessions for market entry or expansion
• When assessing investment opportunities in the kitchen renovation sector
• For guiding operational teams in executing growth initiatives
• In stakeholder meetings to align on strategic direction and resource allocation
Learning Objectives
• Define the strategic growth objectives for XYZ in the Australian market
• Develop a comprehensive understanding of market dynamics and competitive landscape
• Identify and evaluate strategic options for market entry and expansion
• Assess the required business capabilities and investment needs for execution
• Create a detailed implementation plan with clear milestones and deliverables
• Establish performance metrics to track progress and success
Table of Contents
• Executive Summary (page 1)
• Market Analysis and Context (page 2)
• Strategic Opportunities Identification (page 3)
• Business Models and Capabilities (page 4)
• Financial Projections and Assumptions (page 18)
• Preferred Strategic Options (page 38)
• Implementation Plan Overview (page 47)
• Appendices (page 49)
Primary Topics Covered
• Market Dynamics - An analysis of the Australian kitchen renovation market, focusing on growth potential in major cities and consumer spending patterns.
• Strategic Opportunities - Identification of the top 11 strategic opportunities for XYZ, narrowed down to 2 primary options for growth.
• Business Model Assessment - Evaluation of necessary business models and capabilities required to support the selected strategies.
• Financial Projections - Detailed financial forecasts, including revenue, EBIT, and funding requirements for the proposed strategies.
• Implementation Strategy - A structured approach to executing the growth plan, including timelines, resource allocation, and performance management.
• Capability Gap Analysis - Assessment of current capabilities versus required capabilities to achieve strategic objectives.
Deliverables, Templates, and Tools
• Market analysis report template for evaluating growth opportunities
• Strategic options assessment framework for decision-making
• Financial projection model for estimating revenue and costs
• Implementation roadmap template outlining key milestones and actions
• Performance management framework for tracking progress against objectives
• Capability gap assessment tool for identifying areas for improvement
Slide Highlights
• Overview of market dynamics in the Australian kitchen renovation sector
• Strategic opportunities identified for growth, focusing on major cities
• Financial projections illustrating potential revenue and EBIT outcomes
• Detailed assessment of preferred strategic options and their implications
• Implementation plan outlining key phases and resource requirements
Potential Workshop Agenda
Market Dynamics Overview (60 minutes)
• Present findings on market size and growth potential
• Discuss consumer spending trends and competitive landscape
• Identify key strategic opportunities for XYZ
Strategic Options Evaluation (90 minutes)
• Review the top strategic options identified
• Analyze financial projections and investment requirements
• Facilitate discussion on preferred options and next steps
Implementation Planning Session (120 minutes)
• Develop a detailed implementation roadmap
• Assign responsibilities and establish timelines
• Define performance metrics for tracking success
Customization Guidance
• Tailor financial projections based on updated market data and assumptions
• Adjust strategic options based on internal capabilities and market feedback
• Modify implementation timelines to align with organizational capacity and readiness
• Incorporate specific branding and marketing strategies relevant to XYZ’s target segments
Secondary Topics Covered
• Consumer behavior trends in kitchen renovations
• Competitive analysis of key players in the market
• Risk assessment related to market entry strategies
• Supply chain considerations for operational efficiency
• Technology requirements for supporting business capabilities
Topic FAQ
What components should a market-entry growth strategy for a regional home renovation company include?
A market-entry growth strategy should cover market dynamics, a structured list of strategic opportunities, business model and capability assessment, financial projections with funding needs, and an implementation roadmap with KPIs. Flevy’s Growth Strategy Report explicitly includes market analysis, strategic options, a financial projection model, and an implementation roadmap.
How is capability gap analysis used in a growth strategy?
Capability gap analysis compares current organizational capabilities with those required to execute the chosen strategy, identifying areas for investment in sales, supply chain, or CRM. It informs required funding and implementation tasks and is implemented in the deck via a capability gap assessment tool.
What should financial projections for a market expansion show?
Projections should present expected revenue, profitability (EBIT), funding requirements, and sensitivity to key assumptions like volume and pricing. The Growth Strategy Report models revenue and EBIT outcomes and includes sensitivity analyses tied to funding requirements and assumptions such as the $120 million revenue target and $12–18 million EBIT range.
What should I look for when buying a growth strategy report for a regional renovation business?
Prioritize reports that provide market analysis for targeted cities, a clear set of strategic options, business model assessments, editable financial projection models, and an implementation roadmap with milestones. A useful deliverable will include a financial projection model and implementation roadmap template.
How much time and internal work is typically needed to adapt a purchased strategy deck to our company?
Adaptation effort depends on how current your market data and internal assumptions are; common tasks include tailoring financial projections, adjusting strategic options to internal capabilities, modifying implementation timelines, and applying company branding. The customization process centers on updating financial projections and implementation timelines.
We just acquired a regional kitchen chain—what framework helps decide converting stores to branded showrooms versus focusing on hardware multiples?
Use a strategic options assessment that evaluates market segments, price points, distribution channels, and value-added services to compare formats. The Growth Strategy Report examines options like the One-Stop-Shop concept versus a Hardware Multiple Focus, evaluating each by segment, price point, and services.
How can a performance management framework support a rapid expansion program?
A performance management framework aligns KPIs with strategic objectives, tracks sales growth, market share, and profitability, and connects milestones in the implementation roadmap to accountabilities. The report includes a performance management framework to monitor KPIs such as sales growth, market share, and profitability.
Are purchased strategy templates and financial models worthwhile for a small executive team on a tight budget?
Templates can reduce effort by providing structured market analysis, option evaluation frameworks, and projection models that you can tailor to your data; their value depends on your ability to customize assumptions and timelines. Relevant deliverables to check include a market analysis template and a financial projection model.
Document FAQ
These are questions addressed within this presentation.
What is the primary goal of the growth strategy?
The primary goal is to achieve a 15% market share in the Australian kitchen renovation market by 2004, generating sales of $120 million.
What are the 2 preferred strategic options?
The 2 preferred options are a combination of branded showrooms with hardware multiples or kitchen barns, focusing on market expansion.
How will financial projections be developed?
Financial projections will be based on market data, historical performance, and assumptions regarding sales volume and pricing strategies.
What capabilities need to be developed for successful execution?
Capabilities in sales and marketing, supply chain management, and customer relationship management are critical for executing the growth strategy.
How will performance be measured?
Performance will be measured using key performance indicators (KPIs) aligned with strategic objectives, including sales growth, market share, and profitability.
What is the timeline for implementation?
The implementation timeline will be defined in the detailed roadmap, with key milestones established for each phase of the strategy.
What are the risks associated with the growth strategy?
Risks include market competition, changes in consumer preferences, and operational challenges in scaling the business.
How will the strategy be communicated to stakeholders?
A communication plan will be developed to ensure all stakeholders are informed and aligned with the strategic direction and implementation plan.
Glossary
• EBIT - Earnings Before Interest and Taxes, a measure of a firm's profitability.
• Market Share - The percentage of an industry's sales that a particular company controls.
• Strategic Opportunities - Potential avenues for growth identified through market analysis.
• Financial Projections - Estimates of future revenue and expenses based on current data and assumptions.
• Capability Gap - The difference between current capabilities and those required to achieve strategic objectives.
• Performance Metrics - Quantitative measures used to assess the success of a strategy.
• Implementation Roadmap - A detailed plan outlining the steps necessary to execute a strategy.
• Supply Chain Management - The management of the flow of goods and services from suppliers to customers.
• Customer Relationship Management - Strategies and technologies used to manage interactions with customers.
• Market Dynamics - The forces that impact the supply and demand of goods and services in a market.
• Business Model - The plan for how a company creates, delivers, and captures value.
• Revenue - The income generated from normal business operations.
• Investment Requirements - The amount of capital needed to execute a strategy.
• Risk Assessment - The identification and evaluation of potential risks that could impact the success of a strategy.
• Competitive Analysis - The assessment of competitors in the market to identify strengths and weaknesses.
• Consumer Behavior - The study of how individuals make decisions to spend their available resources.
• Operational Efficiency - The ability to deliver products or services in the most cost-effective manner.
• Brand Strategy - A long-term plan for the development of a successful brand to achieve specific goals.
• Market Entry Strategy - The planned method of delivering goods or services to a new target market.
• Performance Management Framework - A structured approach to managing and improving organizational performance.
• Organizational Change - The process of aligning an organization to meet new business challenges.
This PPT slide outlines a retail showroom strategy for a kitchen supplier, categorizing distribution channels such as Brand Stores, Kitchen Barns, eKitchens Direct, and Furniture Multiples. It identifies 3 market segments: Home Owner/Builder/Renovator, Budget Home Renovator, and DIY Enthusiast, each aligned with specific price points. The Home Owner/Builder/Renovator segment targets a medium to high price range of $4K to $10K, while the Budget Home Renovator focuses on lower price ranges to attract cost-conscious consumers. Tailored product offerings include custom kitchen support and CAD design for the higher-end segment, and standard kitchens with essential services for the budget segment, reflecting a strategic approach to meet diverse customer demands.
This PPT slide outlines 6 strategic configurations for financial consideration in the kitchen supply sector, categorized by retail channels: flagship stores, branded stores, kitchen barns, and hardware multiples. The configurations are evaluated in a matrix format, with rows for retail channels and columns for configurations, indicating feasible combinations through checkmarks. For example, the "Flagship stores, Nobby's & Hardware multiples" configuration includes flagship stores and hardware multiples, but excludes kitchen barns. Additionally, eKitchens and factory direct options are identified as channels for future integration, reflecting the importance of online presence in the kitchen supply market. This structure aids decision-makers in assessing the financial implications of each configuration and supports growth strategy discussions.
This PPT slide outlines a framework for aligning business processes across functions, focusing on the integration of supply and demand-side processes. Core processes include Procure, Manufacture, Distribute, Market, Sell, and Serve. The "Procure" section emphasizes collaborative supplier relationships and backward integration for enhanced supply chain control. "Manufacture" highlights demand planning and tight controls to minimize waste. In "Distribute," optimizing transport networks and outsourcing warehousing reflect trends in logistics efficiency. The "Market" segment advocates for data-driven marketing processes based on customer insights. The "Sell" section stresses tailored sales processes and targeted training. Finally, "Serve" focuses on customer service strategies, emphasizing cost-benefit analysis for improved delivery. Aligning these processes enhances operational effectiveness and supports strategic business objectives.
This PPT slide provides a strategic overview of IT functionality and architecture for enhancing supply and demand chain management. It highlights the need for expanded network infrastructure to improve coordination among operational units. Key technology components listed include Scala, CAD, Office Applications, Email, and EDI, with their functionalities across Head Office, Manufacturing, Warehousing, Showrooms, and Regional Offices. The visual representation indicates comprehensive IT system integration, emphasizing the relationship between technology and operational efficiency. Future IT architecture includes the Sydney LAN components, such as servers, routers, and gateways, supporting operational needs across multiple locations. This architecture facilitates information flow between entities, including customers and suppliers, underscoring the critical role of advanced IT infrastructure in optimizing supply chain management.
This PPT slide outlines 3 strategic options for a kitchen supplier. The first option, "The One-Stop-Shop," focuses on establishing a kitchen renovators superstore, emphasizing direct supply to trade channels through various ordering methods. The second option, "Retail Showroom Focus," adopts a multi-channel approach, positioning the supplier as a wholesale provider to trade and commercial entities, enhancing visibility through partnerships with property developers. The third option, "Hardware Multiple Focus," targets larger retail outlets like Bunnings, with plans for selective expansion of branded showrooms to boost brand presence. The strategies suggest backward and forward integration as core enablers for operational efficiency and market reach.
This PPT slide assesses XYZ's competitive positioning across 5 major Australian cities: Sydney, Melbourne, Brisbane, Adelaide, and Perth. Sydney and Adelaide are identified as the strongest markets, with robust market knowledge, distribution network capabilities, and high sales force effectiveness. Melbourne's lower scores in market knowledge and distribution may hinder penetration, while Brisbane shows generally lower scores, indicating challenges in establishing a foothold. Perth ranks lowest in overall attractiveness, facing significant gaps in market knowledge and sales force effectiveness, suggesting substantial hurdles for XYZ. The overall attractiveness metric visually consolidates these insights, highlighting strengths and weaknesses, and guiding strategic decisions for market entry or expansion.
This PPT slide analyzes pricing point distribution for kitchen renovation sales in Adelaide, comparing XYZ's performance against BIS Shrapnel market data. A significant gap exists in the low-cost segment, particularly within the $1,500 to $3,000 price range, which XYZ currently overlooks. The graph displays 2 data sets: XYZ's sales volume and BIS's annual kitchen volume percentage, with price points on the X-axis and sales volume on the Y-axis. XYZ's sales are concentrated in higher price brackets, indicating an opportunity to capture the unaddressed low-end market. The upward trend for both companies highlights the disparity in the low-cost segment, suggesting potential sales volume for XYZ if they diversify their product offerings. Not addressing the low-end market risks losing sales and market share to competitors like BIS.
The organizational structure of XYZ company enhances operational performance with a clear hierarchy. The Chief Executive Officer oversees directors responsible for critical functions. The Supply Chain Director manages a Manufacturing Manager and a Logistics Manager, focusing on quality and efficiency through roles like Production Engineer and Quality Assurance Engineer. The Logistics Manager ensures timely delivery and inventory management. The Shared Services Director centralizes IT, finance, and recruitment, streamlining operations and reducing redundancy. A dedicated Sales & Marketing Director oversees product development and channel managers, emphasizing market engagement and customer outreach. This framework supports growth, operational efficiency, and adaptability in a dynamic market environment.
This PPT slide outlines a structured project plan divided into 4 stages: Diagnosis, Strategic Direction, Operating Strategy Development, and Plan.
In the "Diagnosis" stage, the focus is on defining the current market landscape and projecting relevant data through 2004, which identifies the top eleven strategic opportunities.
The "Strategic Direction" stage generates potential strategic options, identifying initial business models and performance gaps, ultimately selecting the 2 best options for focus.
"Operating Strategy Development" defines an operating strategy aligned with selected options, grouping profit improvement opportunities across Sales & Marketing, Supply Chain, Operating Costs, and Information Technology.
Finally, the "Plan" stage transitions from the current state to the desired future state, ensuring effective implementation of the strategy with necessary resources and planning.
This PPT slide analyzes market opportunities in Australia, focusing on major cities and growth potential in the kitchen sector. The left pie chart shows the 1997 population distribution, with Sydney at 31% and Melbourne at 27% of the total 12.5 million. Brisbane, Perth, and Adelaide follow with smaller shares. The right pie chart compares annual kitchen spending, revealing Sydney leads with 33% of the $1.9 billion total, while Melbourne contributes 17%. The top 5 cities account for 73% of total kitchen expenditure in Australia. Targeting these urban centers is essential for strategic planning, marketing, and revenue generation in the kitchen market.
Source: Best Practices in Strategic Plan Example PowerPoint Slides: Growth Strategy Report PowerPoint (PPT) Presentation Slide Deck, Documents & Files
Since 2012, we have provided business templates to over 10,000 businesses and organizations of all sizes, from startups and small businesses to the Fortune 100, in over 130 countries.
"Last Sunday morning, I was diligently working on an important presentation for a client and found myself in need of additional content and suitable templates for various types of graphics. Flevy.com proved to be a treasure trove for both content and design at a reasonable price, considering the time I
saved. I encountered a download issue during the ordering process. However, a quick email to Flevy's support team, even on a Sunday (!!!), resulted in assistance within less than an hour, allowing me to download the content I needed. Fantastic job, Flevy! I give 5 stars for both content/price and customer service. Thank you!
"
– M. E., Chief Commercial Officer, International Logistics Service Provider
"The wide selection of frameworks is very useful to me as an independent consultant. In fact, it rivals what I had at my disposal at Big 4 Consulting firms in terms of efficacy and organization."
– Julia T., Consulting Firm Owner (Former Manager at Deloitte and Capgemini)
"As a consulting firm, we had been creating subject matter training materials for our people and found the excellent materials on Flevy, which saved us 100's of hours of re-creating what already exists on the Flevy materials we purchased."
– Michael Evans, Managing Director at Newport LLC
"Flevy is our 'go to' resource for management material, at an affordable cost. The Flevy library is comprehensive and the content deep, and typically provides a great foundation for us to further develop and tailor our own service offer."
– Chris McCann, Founder at Resilient.World
"If you are looking for great resources to save time with your business presentations, Flevy is truly a value-added resource. Flevy has done all the work for you and we will continue to utilize Flevy as a source to extract up-to-date information and data for our virtual and onsite presentations!"
– Debbi Saffo, President at The NiKhar Group
"[Flevy] produces some great work that has been/continues to be of immense help not only to myself, but as I seek to provide professional services to my clients, it gives me a large "tool box" of resources that are critical to provide them with the quality of service and outcomes they are expecting."
– Royston Knowles, Executive with 50+ Years of Board Level Experience
"As a consultant requiring up to date and professional material that will be of value and use to my clients, I find Flevy a very reliable resource.
The variety and quality of material available through Flevy offers a very useful and commanding source for information. Using Flevy saves me time, enhances my expertise and ends up being a good decision."
– Dennis Gershowitz, Principal at DG Associates
"My FlevyPro subscription provides me with the most popular frameworks and decks in demand in today’s market. They not only augment my existing consulting and coaching offerings and delivery, but also keep me abreast of the latest trends, inspire new products and service offerings for my practice, and educate me
Download our free compilation of 50+ Strategy & Transformation slides and templates. Frameworks include McKinsey 7-S, Balanced Scorecard, Disruptive Innovation, BCG Curve, and many more.