
 Click main image to view in full screen.
Private Equity Profit Distribution Waterfall Model – Excel XLSX
Excel (XLSX)


BENEFITS OF THIS DOWNLOADABLE EXCEL DOCUMENT
- The model allows for the distribution of funds between the Limited Partners ('LPs') and the General Partner ('GP') for investment or private equity funds.
- Waterfall Profit Distribution
INVESTMENT VEHICLES EXCEL DESCRIPTION
This Private Equity Profit Distribution Waterfall Model allows for the distribution of funds between the Limited Partners ('LPs') and the General Partner ('GP') for investment or private equity funds. This detailed model covers all the relevant concepts used in private equity cash flow models. The model follows a typical Private Equity Distribution Structure meaning that the funds are distributed over four steps (hurdles).
Return of capital (ROC) – 100% of distributions go to the investors until they recover their initial capital contributions.
Preferred Return – 100% of further distributions go to investors until they receive the preferred Return on their investment.
Catch-up – Assuming funding is available, cash flows go to the GP until it receives a certain percentage of profits from steps 2 and 3. The model also allows for setting the percentage of the available funds that GP can retain until it has received its share of the gains.
Carried interest -The remaining proceeds are distributed to the LPs and GPs pro-rata according to the percentage defined for this step.
This waterfall model assumes only one GP and up to four LPs, which can be set with different hurdles rates and percentages of capital commitment. This model can be easily included in other models by linking the projects/assets CF in the portfolio CF section.
Template Structure (Three Sheets)
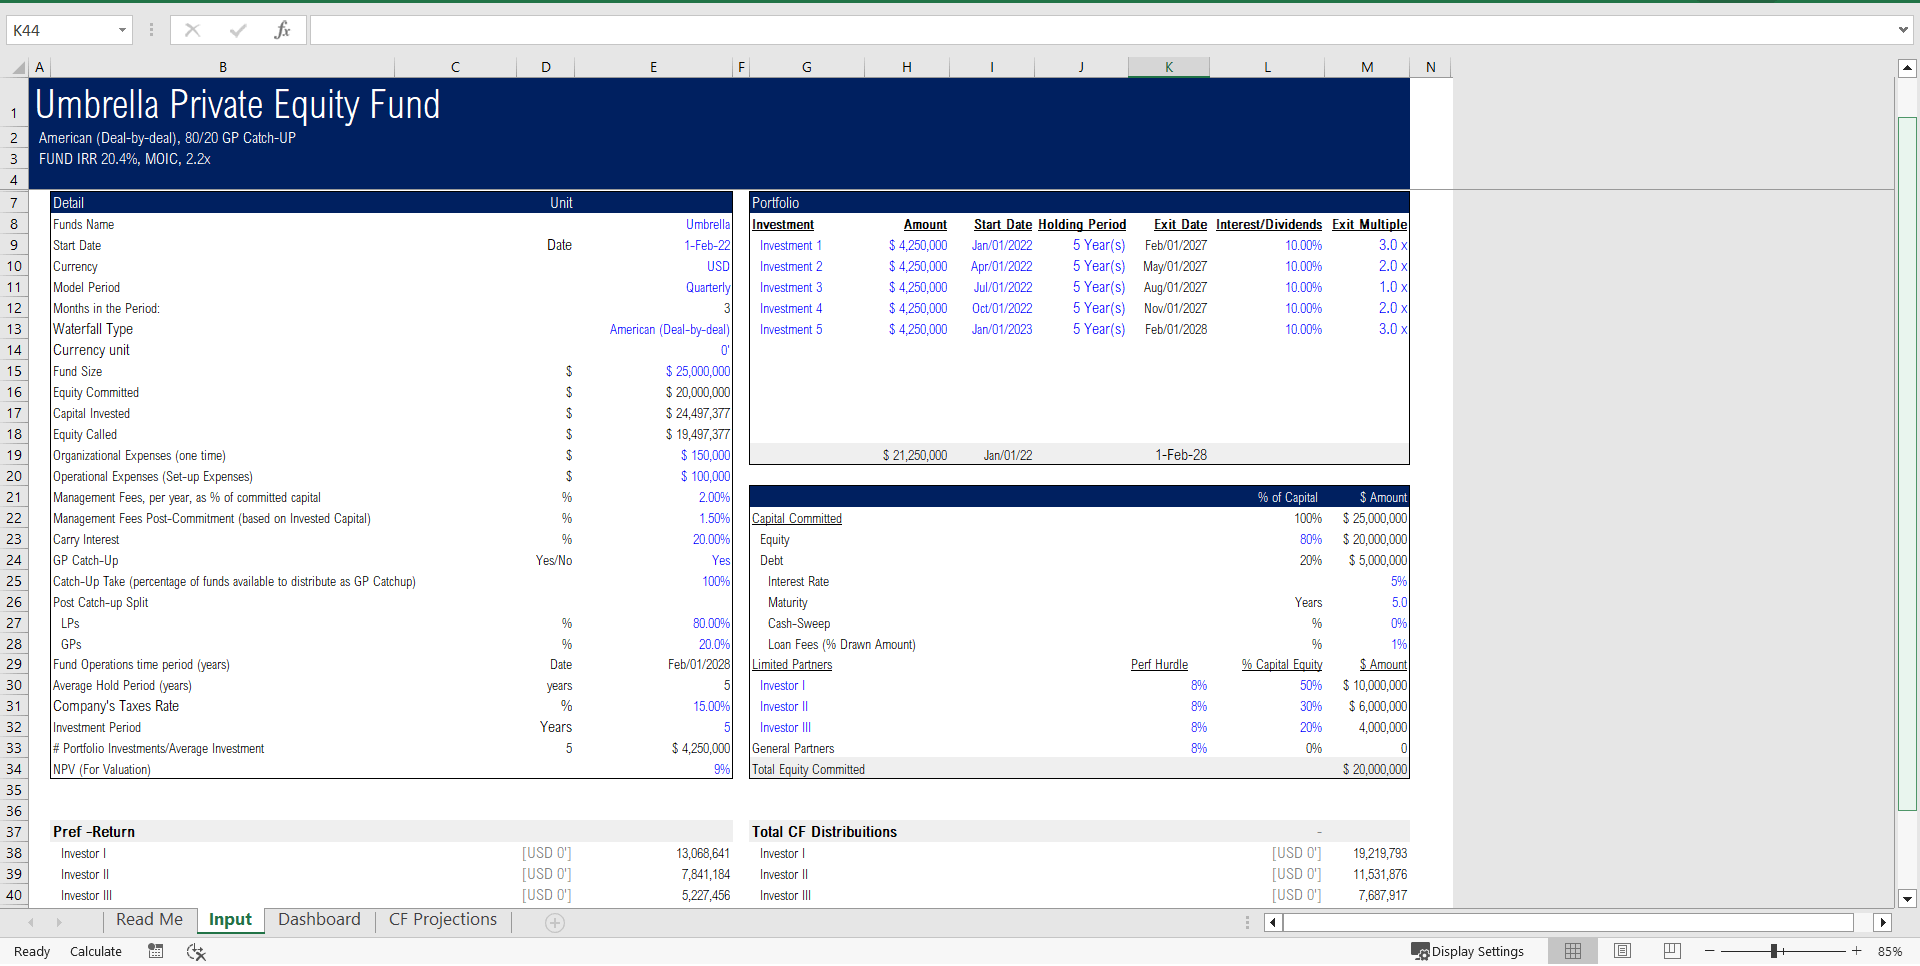
Input: The model inputs are set in this sheet, namely the fund sizes, equity contributions, debt ratio, fund life, commitment period, fund expenses, hurdle rate, fees, etc.
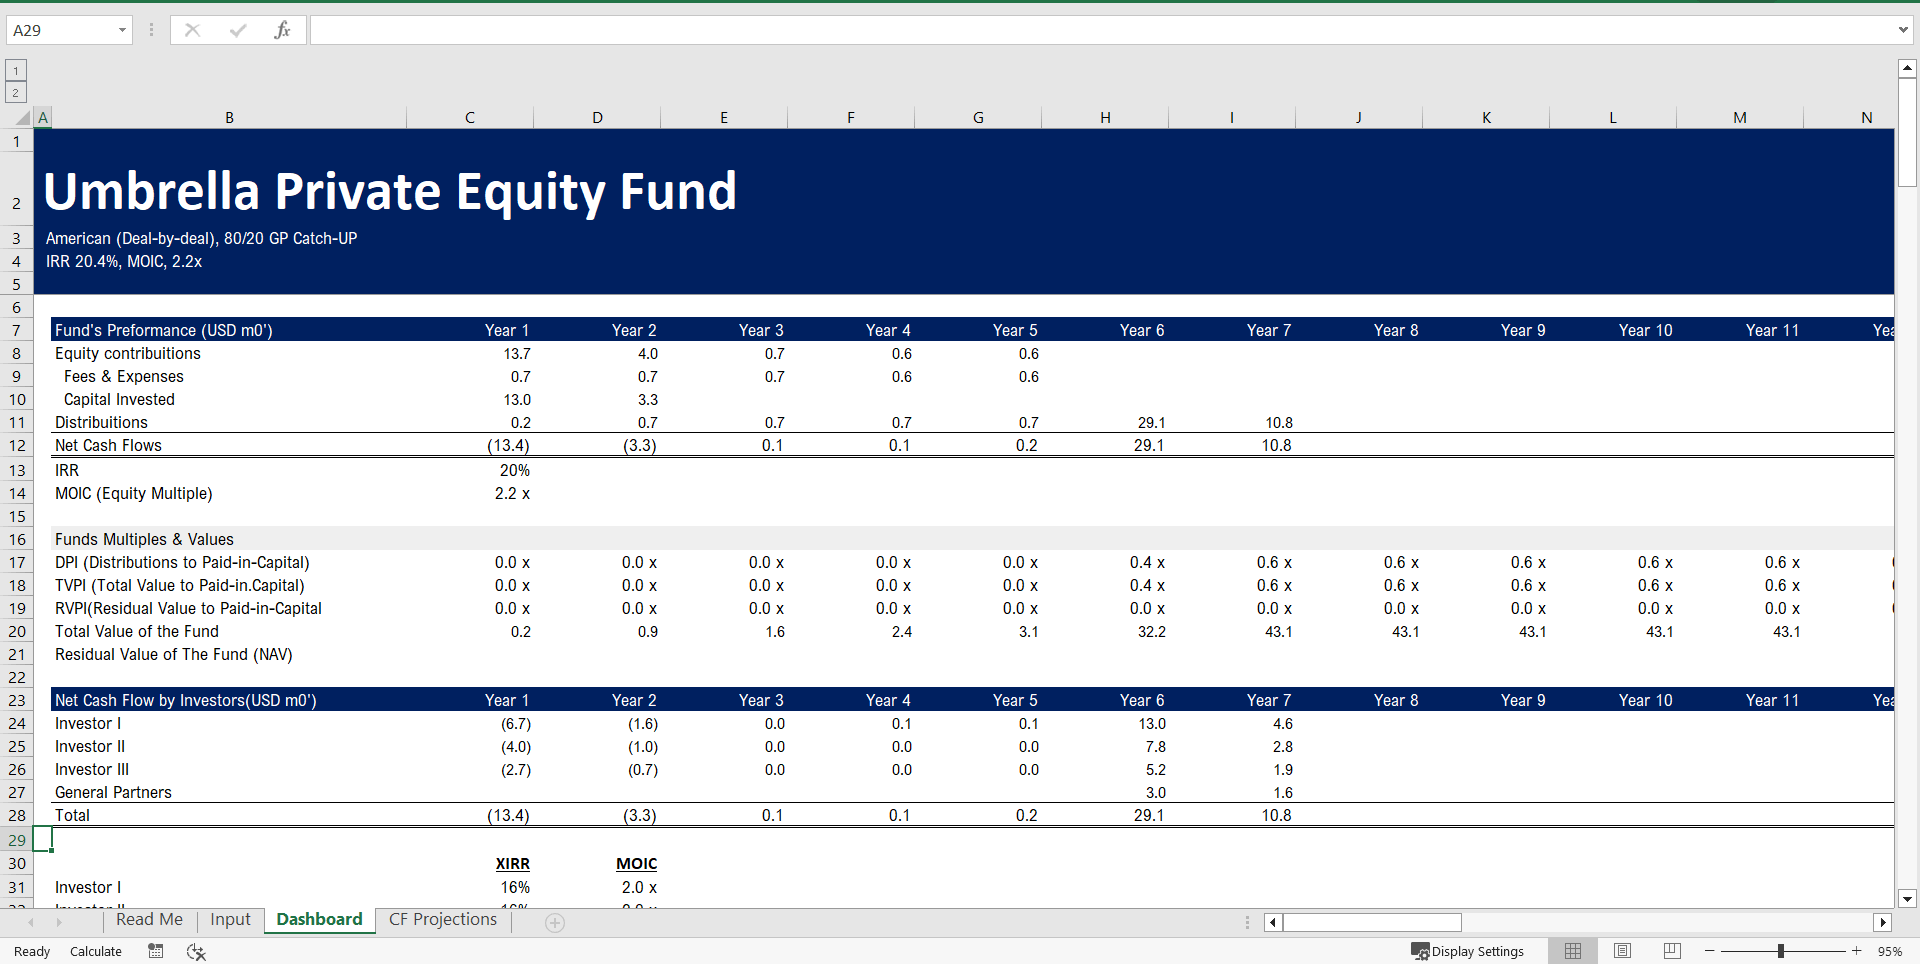
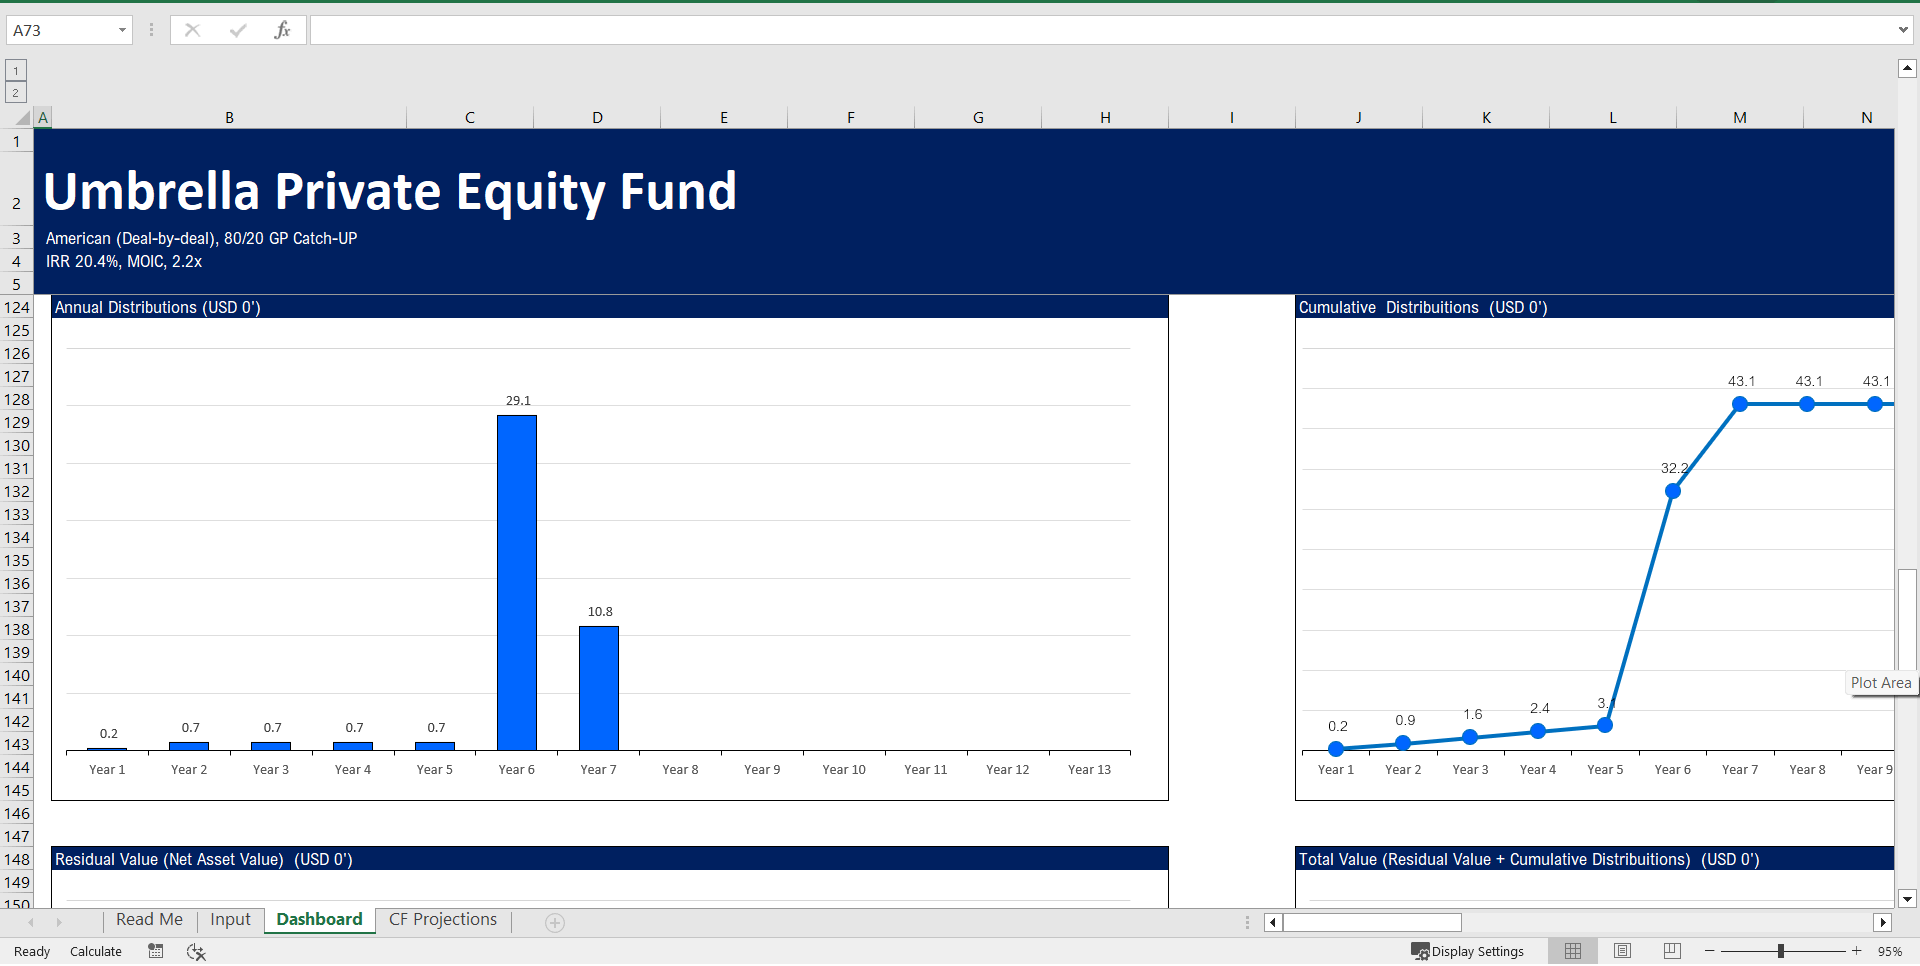
Dashboard Sheet: A dashboard contains the main KPIs of the funds, Investors, and Portfolio performance, as well as charts (eight) for better visualization.
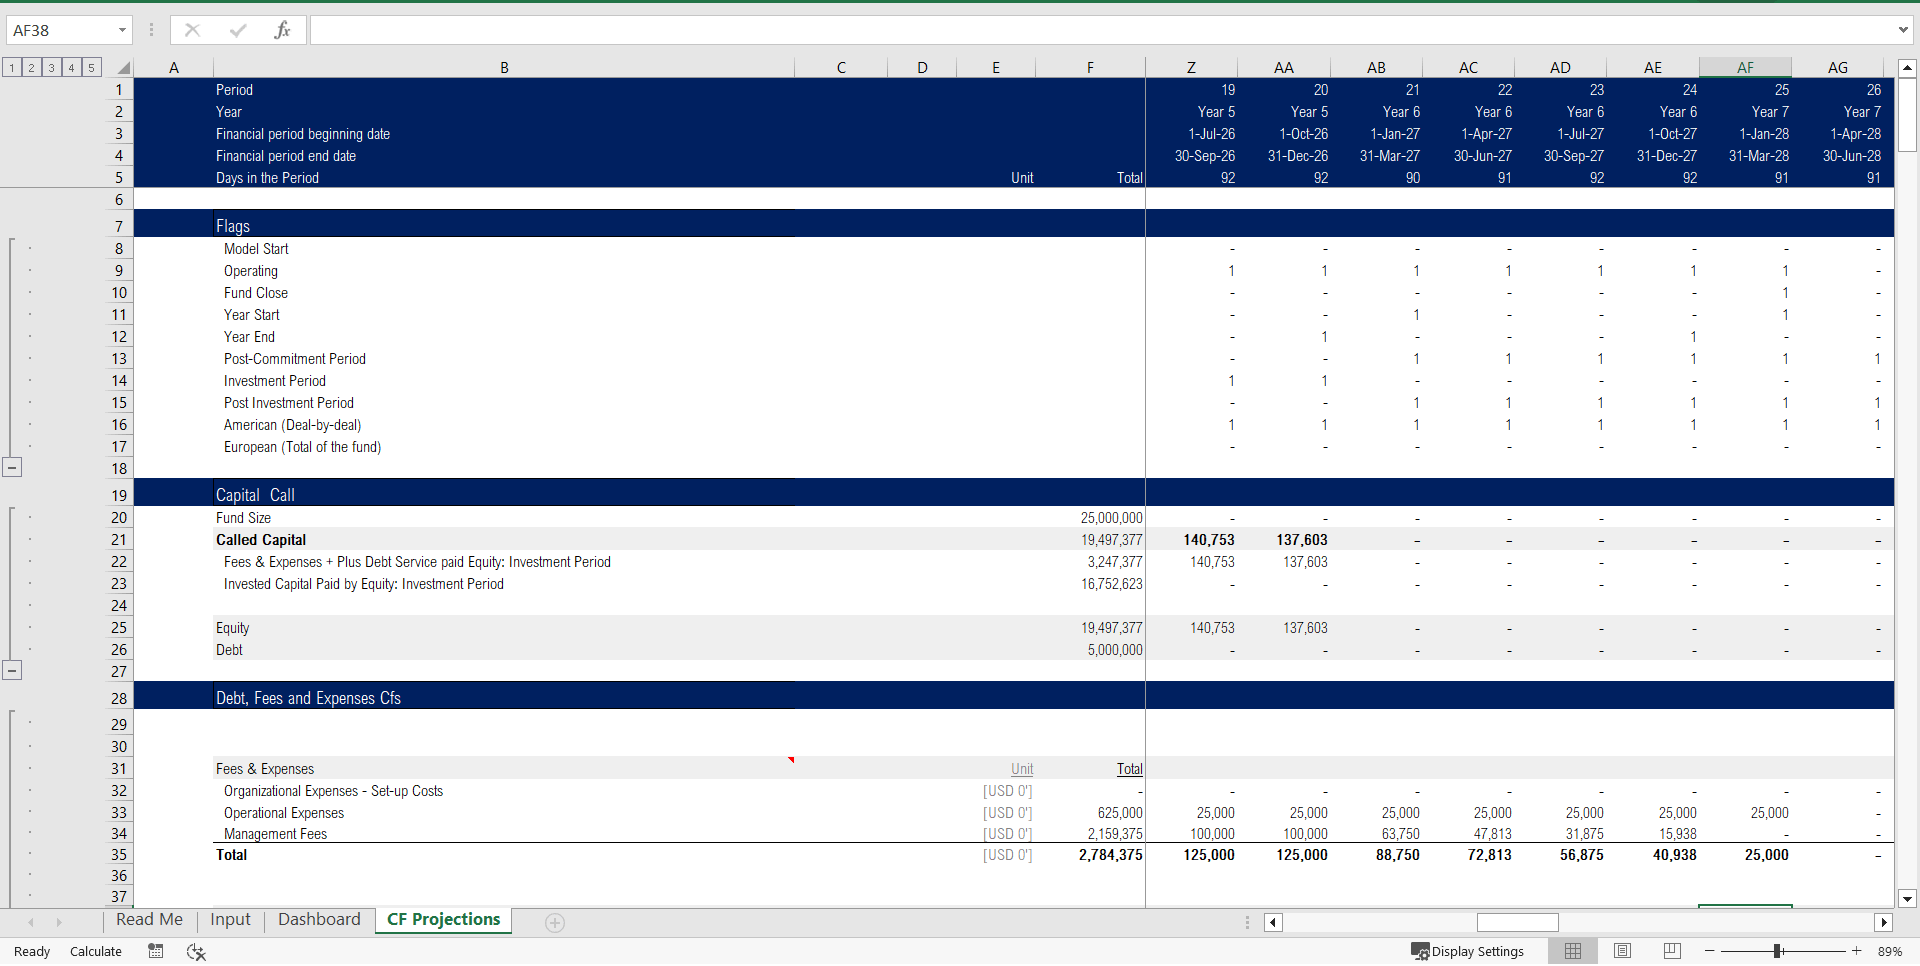
CF Projection Sheet:
• Capital Call
• Debt Schedule
• Fees and Expenses Cfs
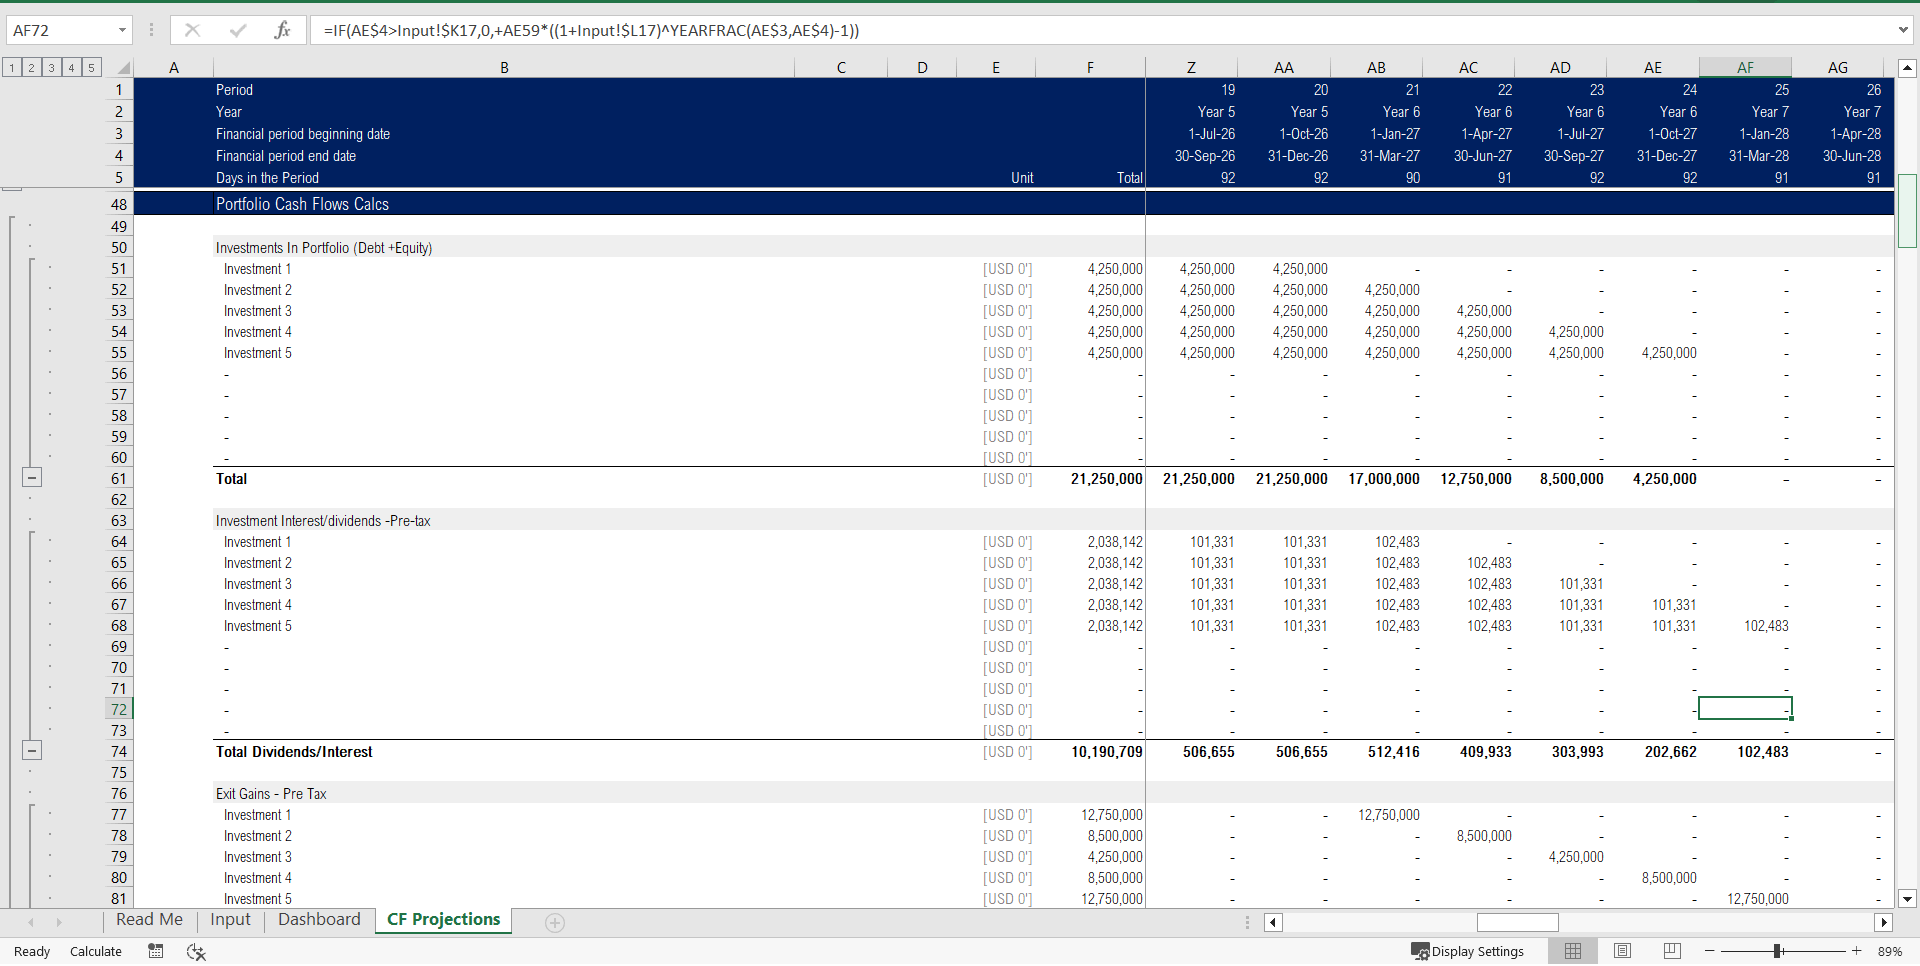
• Portfolio Cash Flows
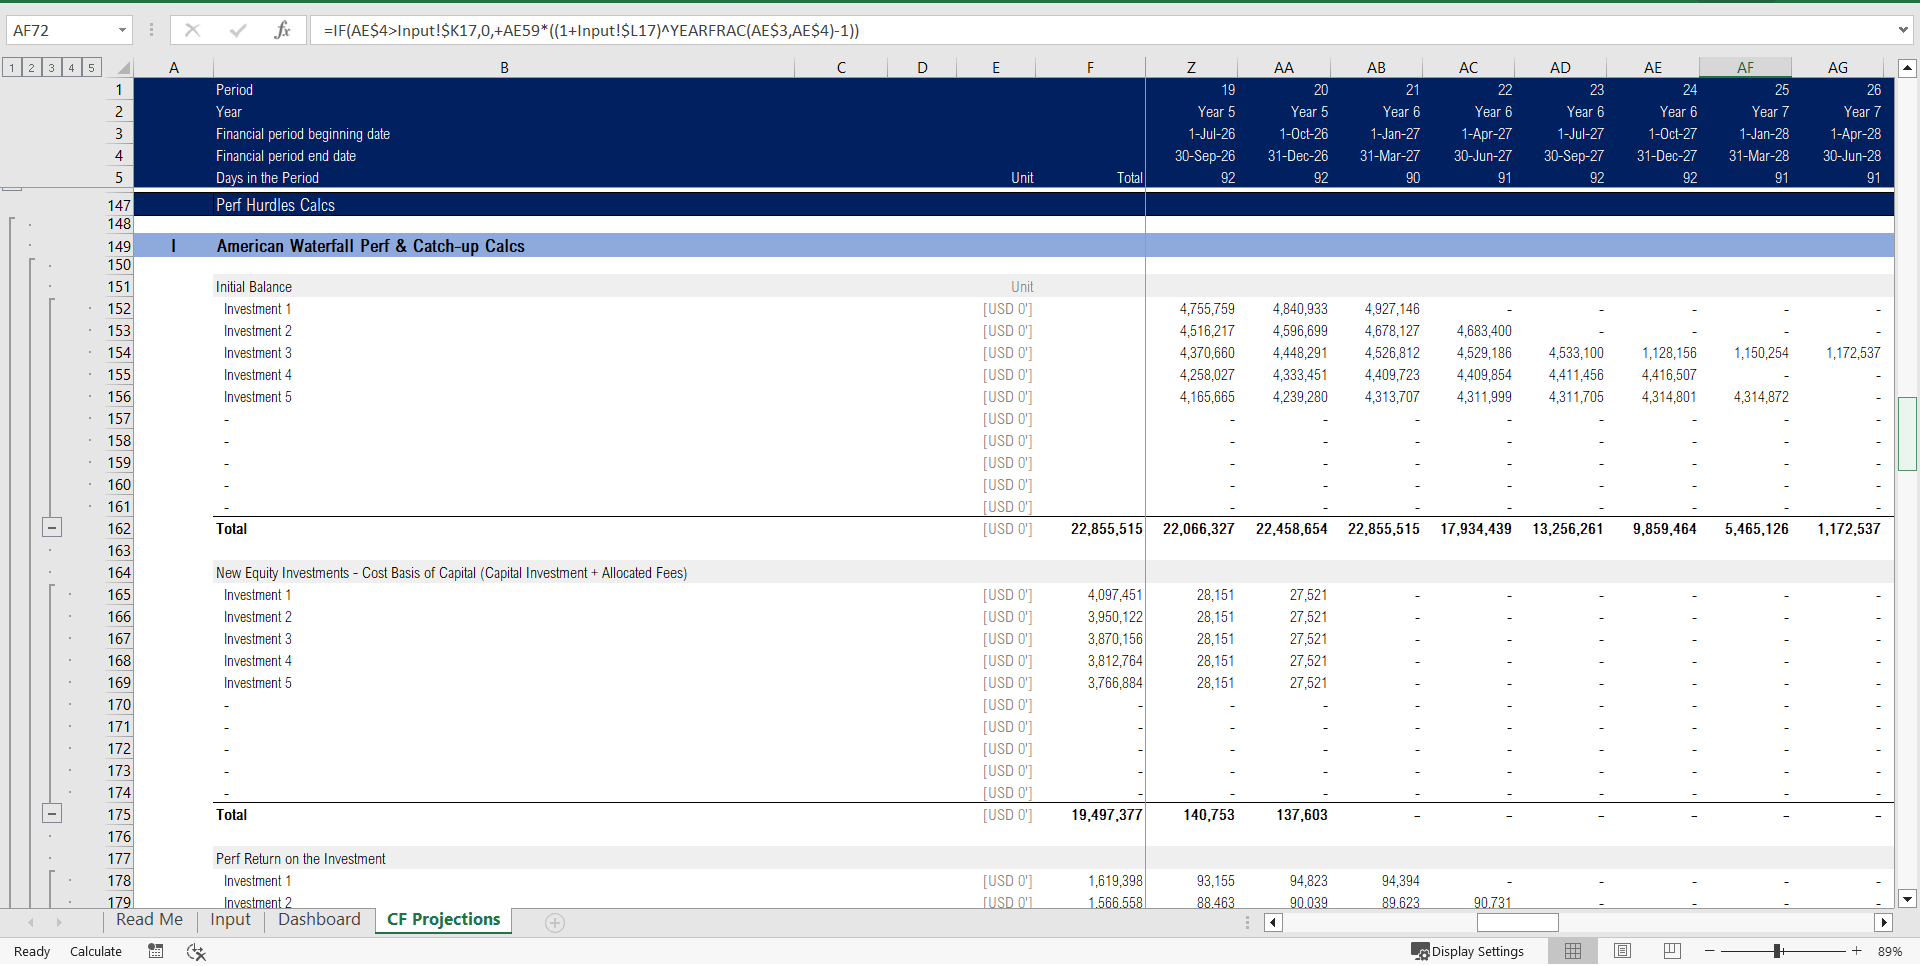
• Calcs Perf Hurdles
• Waterfall
• Summary of Cash Flow Distribution by Hurdles
• Summary of Net Cash Flow Distribution by Investors
Model Options:
American vs. European Waterfall Models
The model is available for both European and American waterfall (deal-by-deal) methods, and the users can easily toggle between the two methods.
Reporting Period
The model is built with the option to toggle between annually, quarterly, and Semi-annual periods for up to 13 years of analysis.
Funds Portfolio
The user can set up to 10 investments/assets, with inputs such as the date of the investment holding period, exit multiple, etc.
Cash flow Distributions
Regardless of the model applied (American or European ), Cash flows are distributed pari passu and in the proportion of the invested capital by the investors.
GP Catch Up
The full catch for GP means that 20% (if the carry is indeed 20%) of all distributions in preferred Return + GP Catch up itself are paid to the GP if funds are available. The balance is transferred to subsequent periods if funds are insufficient until the catch-up is fully paid. The model doesn't accrue interest on unpaid catch-up balances.
Fees and expenses allocation
The fees and expenses are allocated to the investment portfolio as they occur and in proportion to the invested capital. During the investment period, fees and costs are paid from called capital. After the investment period, the amounts are taken from the different Portfolio investments' cash flows in proportion to each asset's investment.
Debt Service
The debt capital is paid out of the cash flow resulting from the different portfolio investments, subject to the availability of funds. Interest and commission expenses during the investment period are paid from the called equity. The debt percentage (if any), cash sweep percentage, and maturity are all assumptions configurable according to the user's needs.
Should you have any questions, please feel free to contact me.
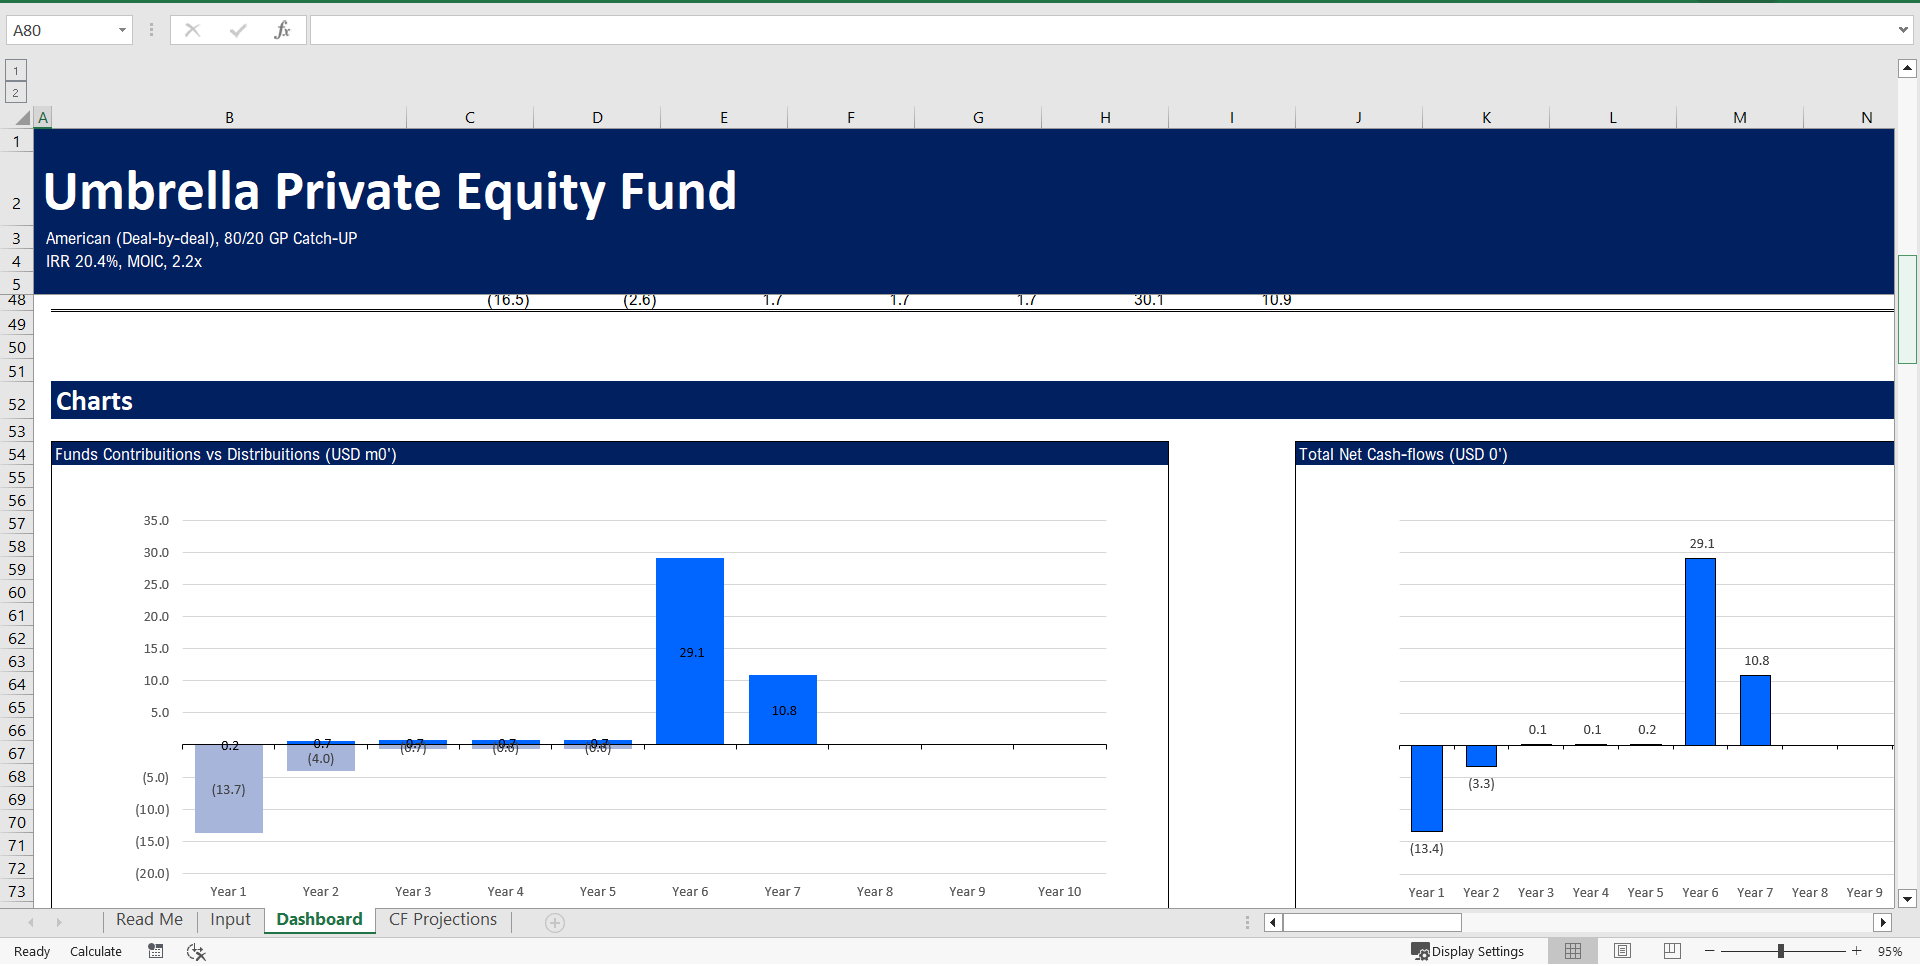
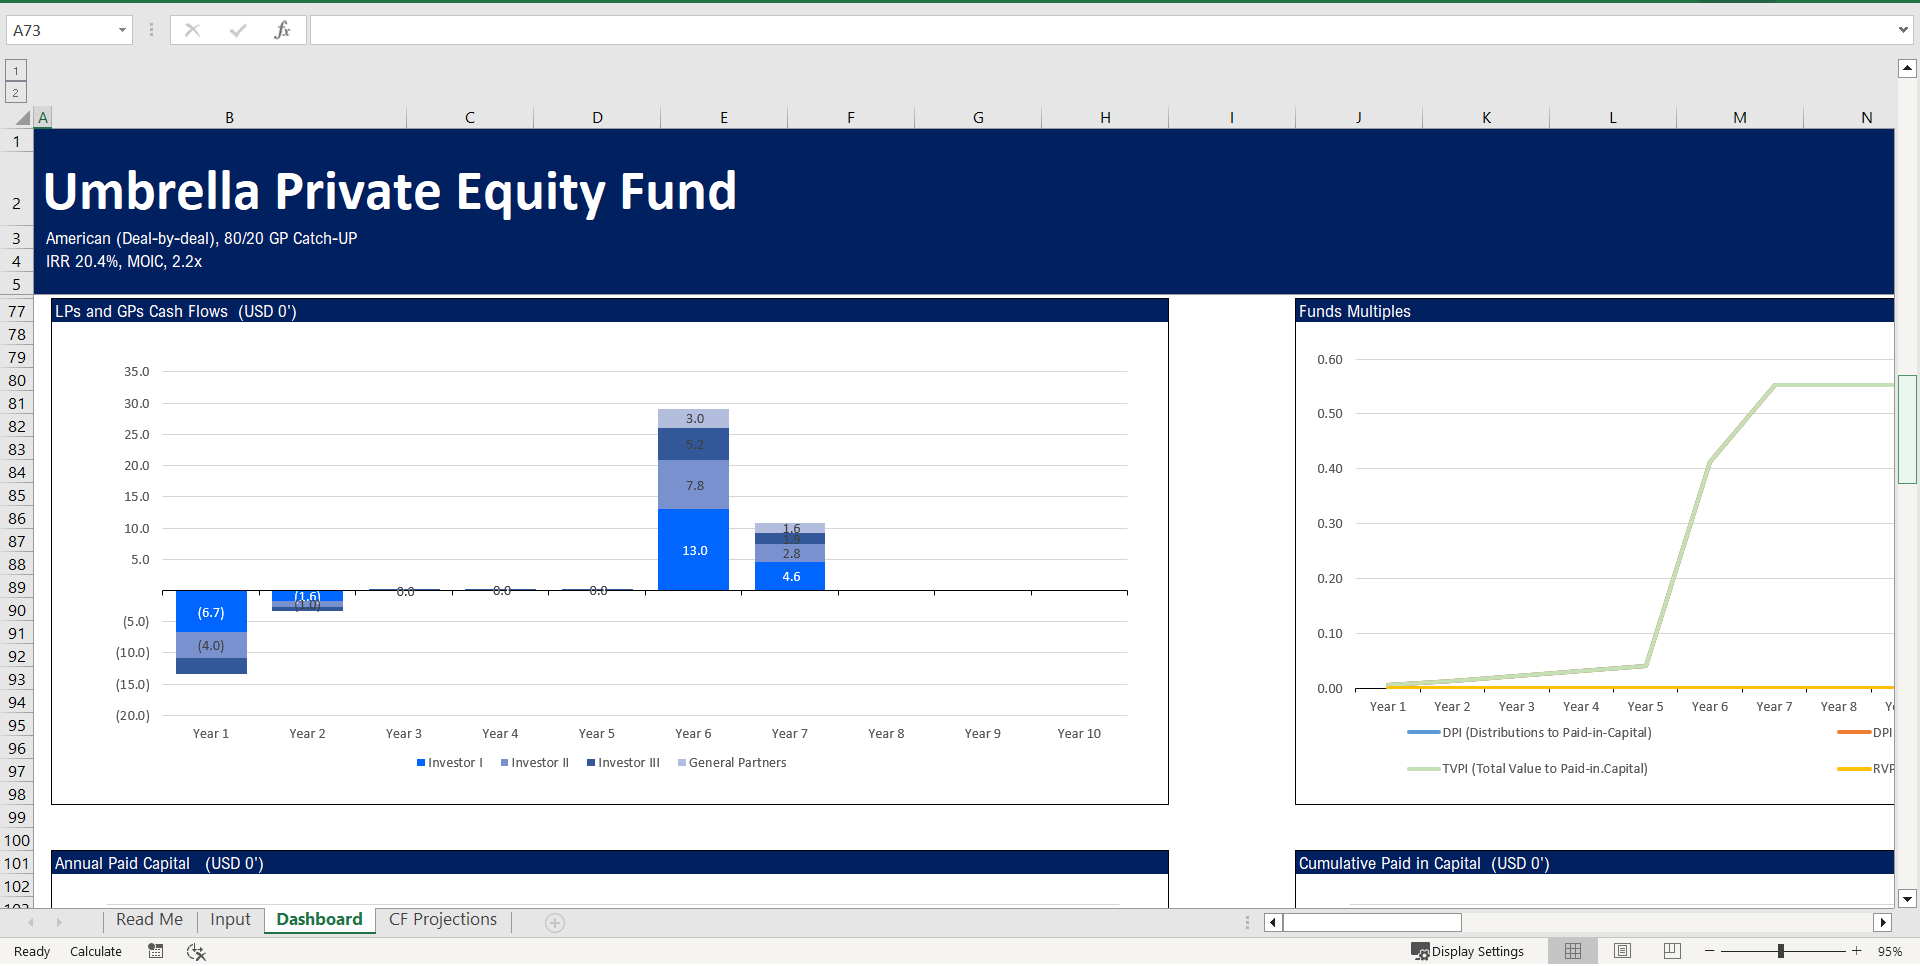
This model includes detailed charts for visualizing fund contributions versus distributions and total net cash flows. It also provides comprehensive breakdowns of LP and GP cash flows, enhancing transparency and decision-making.
Got a question about the product? Email us at support@flevy.com or ask the author directly by using the "Ask the Author a Question" form. If you cannot view the preview above this document description, go here to view the large preview instead.
TOPIC FAQ
What are the standard steps in a private equity distribution waterfall?
A typical private equity waterfall distributes cash across 4 sequential steps: Return of Capital (100% to investors until capital returned), Preferred Return (100% to investors until preferred yield met), GP Catch-up (cash to GP until GP receives its agreed share), then Carried Interest (pro-rata splits of remaining proceeds). The sequence has 4 steps.How does a deal-by-deal (American) waterfall differ from a European waterfall for distributions?
An American, or deal-by-deal, waterfall allocates proceeds at the individual-asset level, while a European, or whole-fund, waterfall pools cash at the fund level before carried splits. The model supports toggling between American and European methods for allocation comparison and analysis using an American vs. European toggle.How is GP catch-up typically modeled in waterfall spreadsheets?
GP catch-up gives the GP priority cash flows until it reaches a target share of profits from prior steps; the model lets users set the GP catch-up percentage and retain a defined portion of available funds, carrying unpaid catch-up balances to later periods without accruing interest. It models catch-up with no interest on unpaid catch-up balances.How should fees and expenses be allocated across portfolio investments in a fund model?
Fees and expenses are allocated in proportion to each investor’s invested capital; during the investment period those amounts are paid from called capital, and after the investment period they are taken from portfolio investment cash flows in proportion to each asset’s investment. Allocation is in proportion to invested capital.What features matter most when choosing a private equity waterfall spreadsheet template?
Look for support for American versus European waterfalls, configurable reporting periods (annual, quarterly, semi-annual), multi-investor capability with distinct hurdle rates and capital shares, integrated capital call and debt schedules, and a dashboard for KPIs and charts. A useful template supports up to 10 investments.How can a downloadable template speed up LP reporting and fund cash-flow modeling?
A template with prebuilt input, capital call schedules, debt service, fee allocation, waterfall calculations, and a dashboard reduces manual setup and standardizes outputs for LP reporting. Flevy’s Private Equity Profit Distribution Waterfall Model provides these elements across 3 sheets with eight charts for visualization.I need to model distributions for multiple LPs with different hurdle rates—how does a template handle that?
Templates that allow multiple investors let you assign separate hurdle rates and capital commitment percentages; this model supports one GP and up to 4 LPs, distributes cash pari passu in proportion to invested capital, and summarizes distribution by hurdle and by investor, supporting up to 4 LPs.What reporting periods and time horizons should I expect a waterfall model to support for scenario analysis?
Robust templates provide toggles for reporting cadence—annual, quarterly, or semi-annual—and allow multi-year projection windows; this model offers reporting-period toggles and supports analysis horizons up to 13 years for fund- and asset-level cash-flow projections.Source: Best Practices in Investment Vehicles, Return on Investment, Private Equity Excel: Private Equity Profit Distribution Waterfall Model Excel (XLSX) Spreadsheet, Jair Almeida




























