 Click main image to view in full screen.
Fund Distribution Waterfall Model with Carried Interest Calculation – Excel XLSX
Excel (XLSX) + Excel (XLSX)


VIDEO DEMO
BENEFITS OF THIS DOWNLOADABLE EXCEL DOCUMENT
- Excel model for calculating the distribution of funds between the Limited Partner (‘LP') and General Partner (‘GP') for a PE fund.
INVESTMENT VEHICLES EXCEL DESCRIPTION
A Fund Distribution Waterfall Model is critical for private equity and investment fund management. It outlines the order and distribution of returns to investors and stakeholders, ensuring transparency and fairness. This model helps align interests, incentivize fund managers, and attract investors. It's instrumental in navigating complex profit-sharing structures and optimizing fund performance. By offering clarity on fund distribution, it enhances investor trust, supports legal compliance, and facilitates strategic decision-making. In summary, a well-constructed Fund Distribution Waterfall Model is essential for efficient fund management, investor confidence, and successful fund operations in the investment industry.
PURPOSE OF MODEL
User-friendly Excel model for calculating the distribution of funds between the Limited Partner (‘LP') and General Partner (‘GP') for a private equity investment or fund.
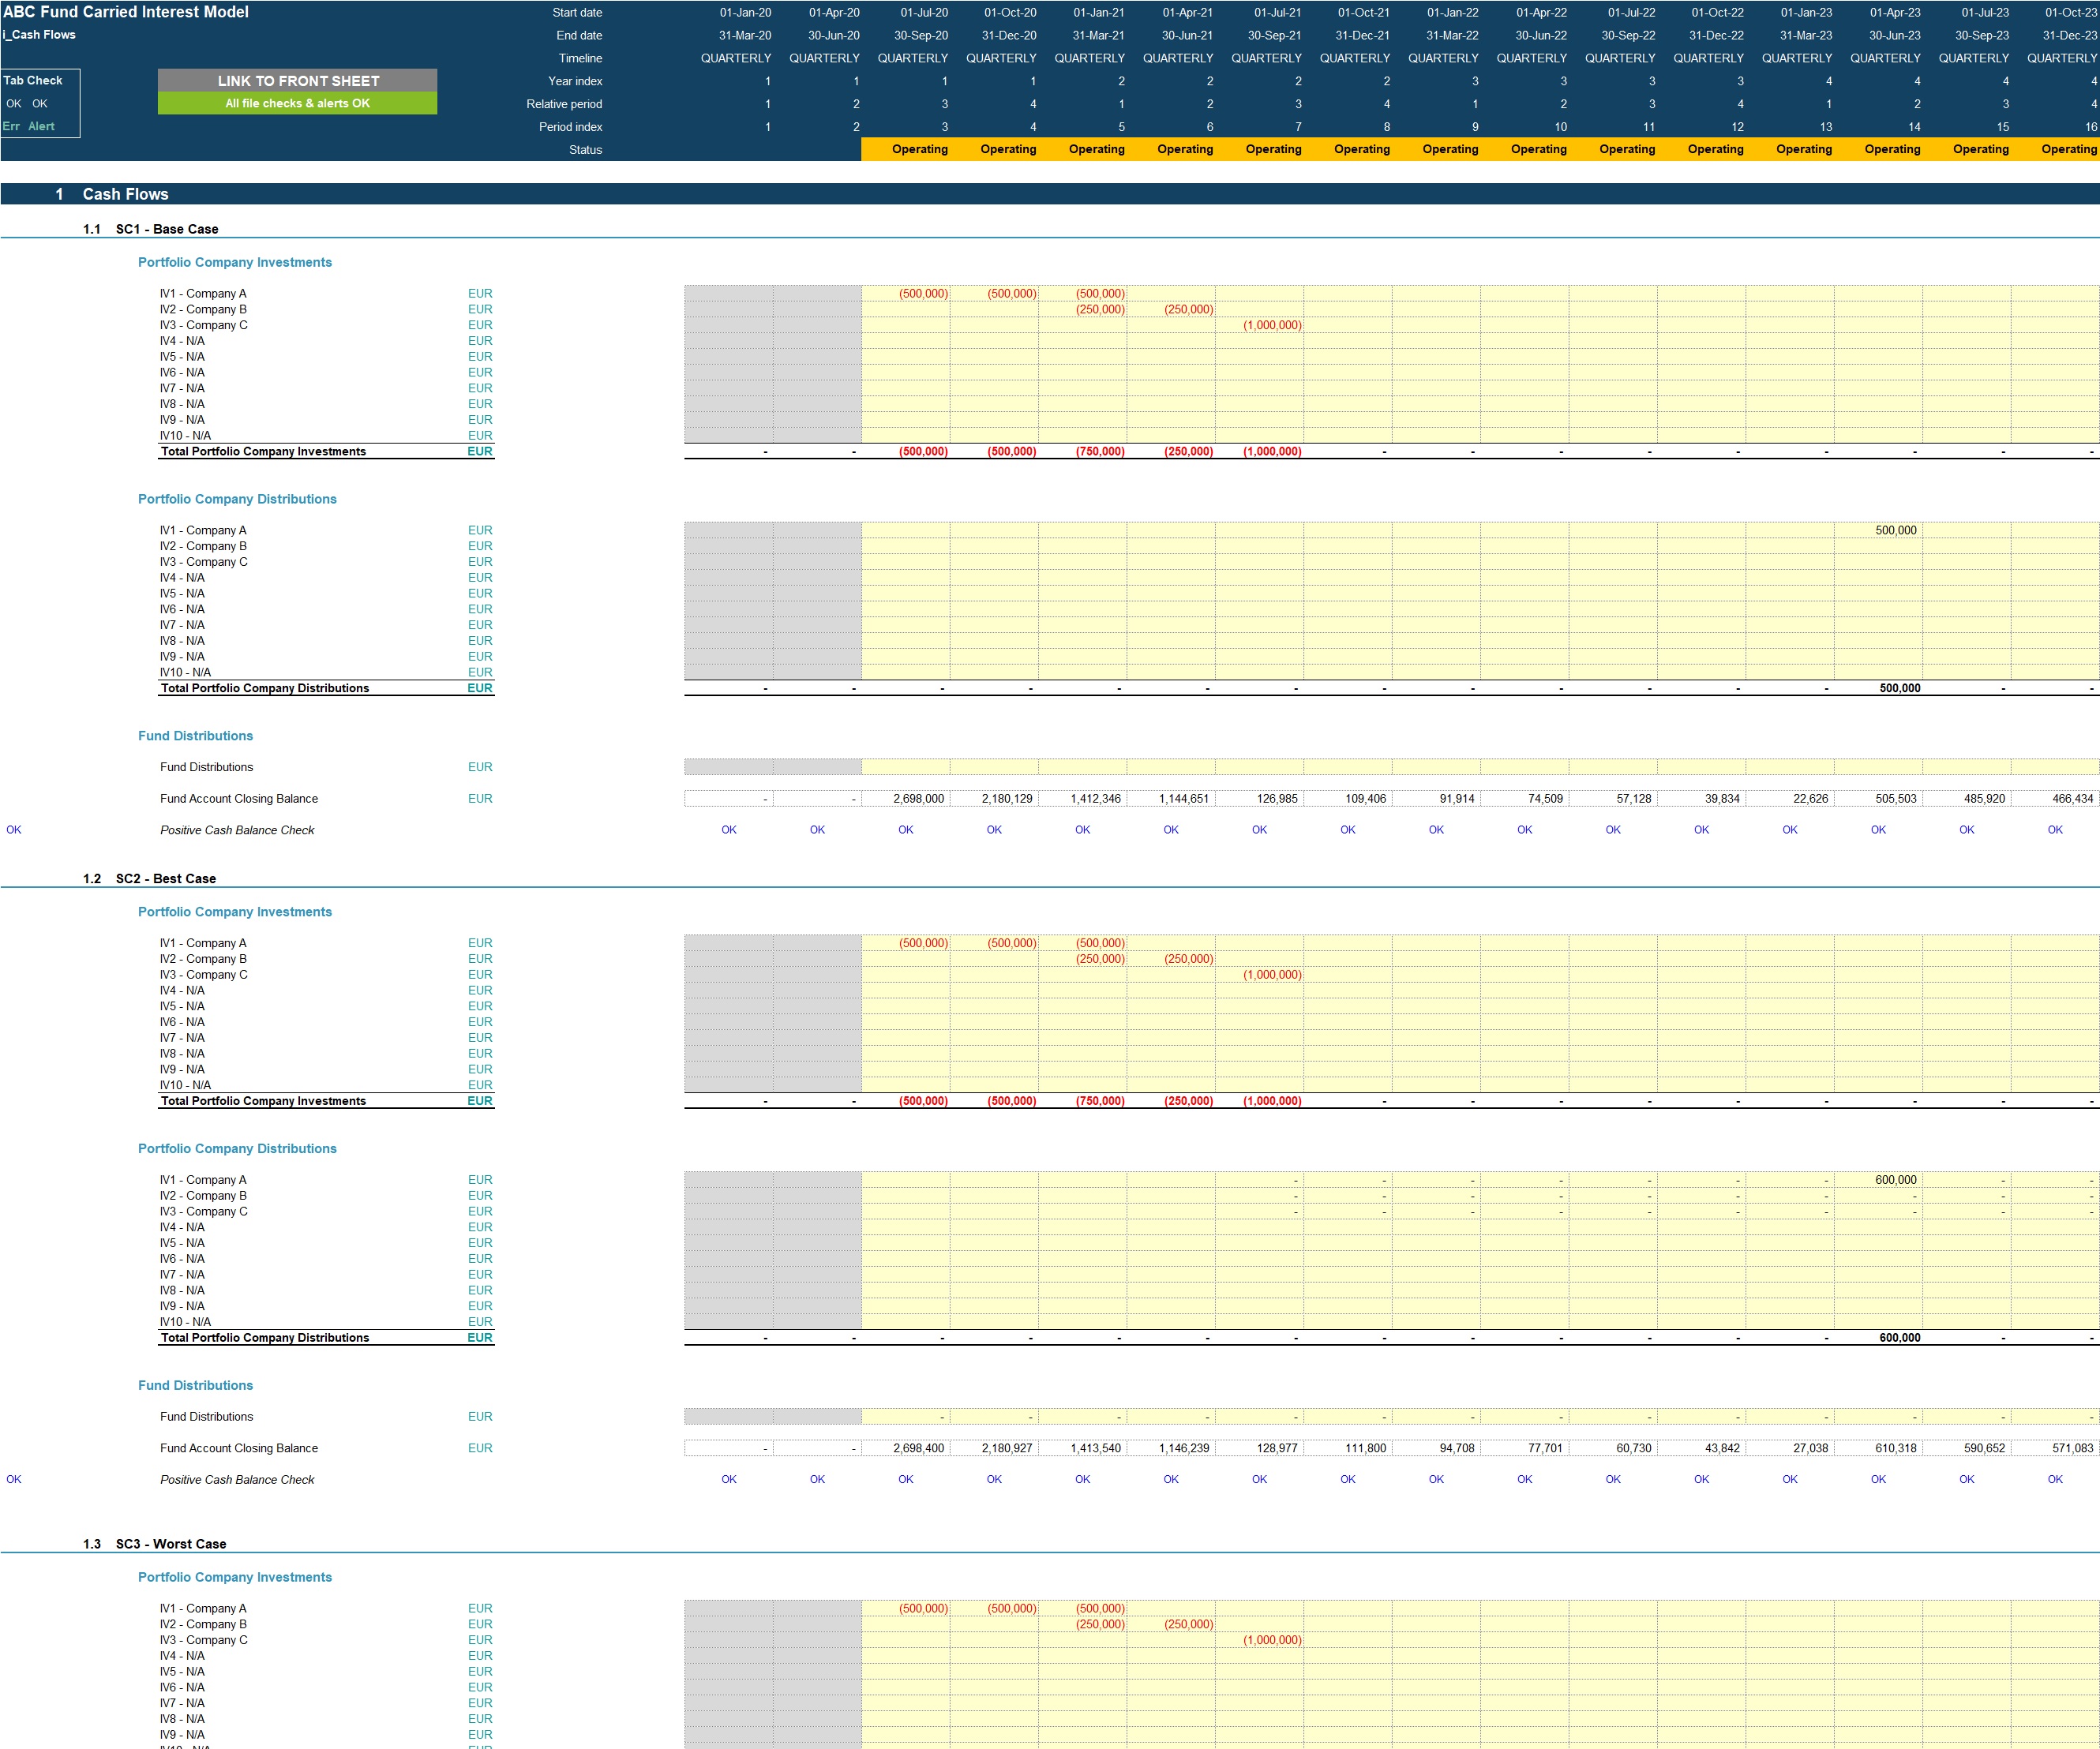
The model is flexible allowing the user to input up to 10 different underlying portfolio company investments within the fund with their individual capital contributions and distributions across a 10 year quarterly timeline with 3 scenarios. The cash flow and waterfall assumptions include equity contribution splits, LP hurdle rates, GP catch up provisions, GP carried interest, GP management fee and fund operating expenses.
The model follows best practice financial modelling principles and includes instructions, checks and input validations.
KEY OUTPUTS
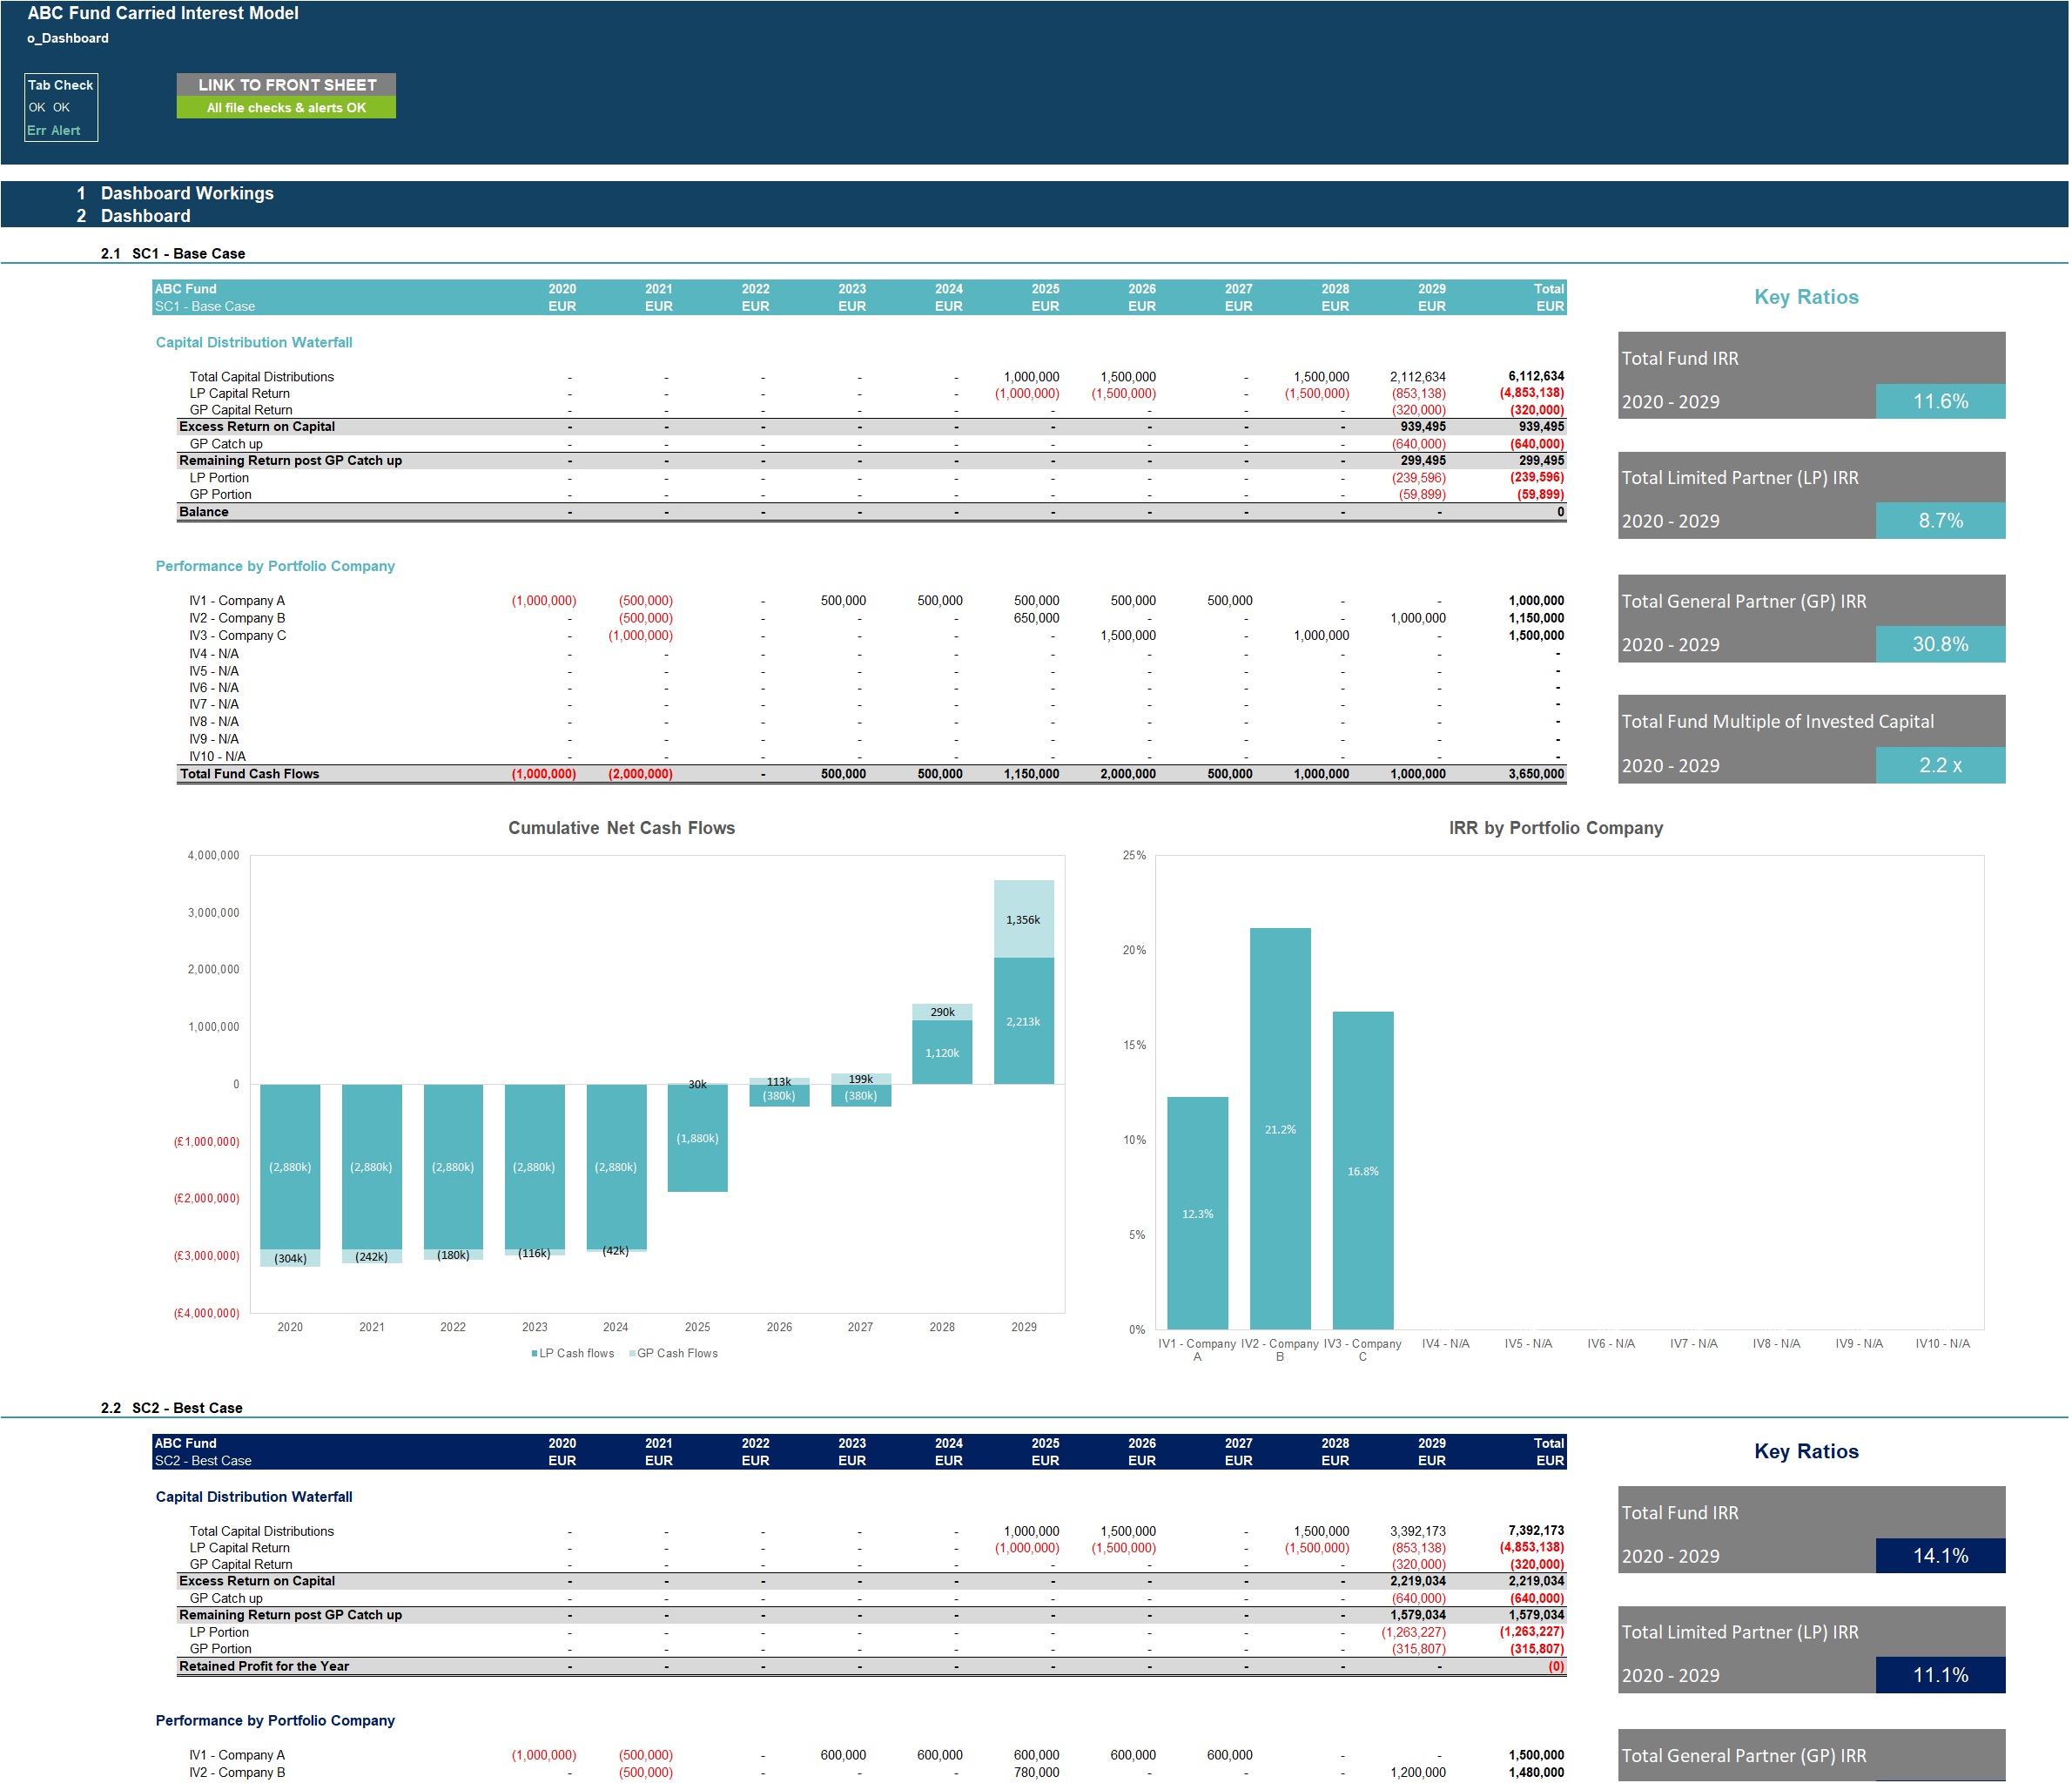
The model is generic and not industry-specific. The key outputs presented in both table and chart format include:
• Waterfall of fund distributions
• IRR on total fund basis and for GP and LP
• IRR and net cash flows by portfolio company
• Multiples of invested capital
KEY INPUTS
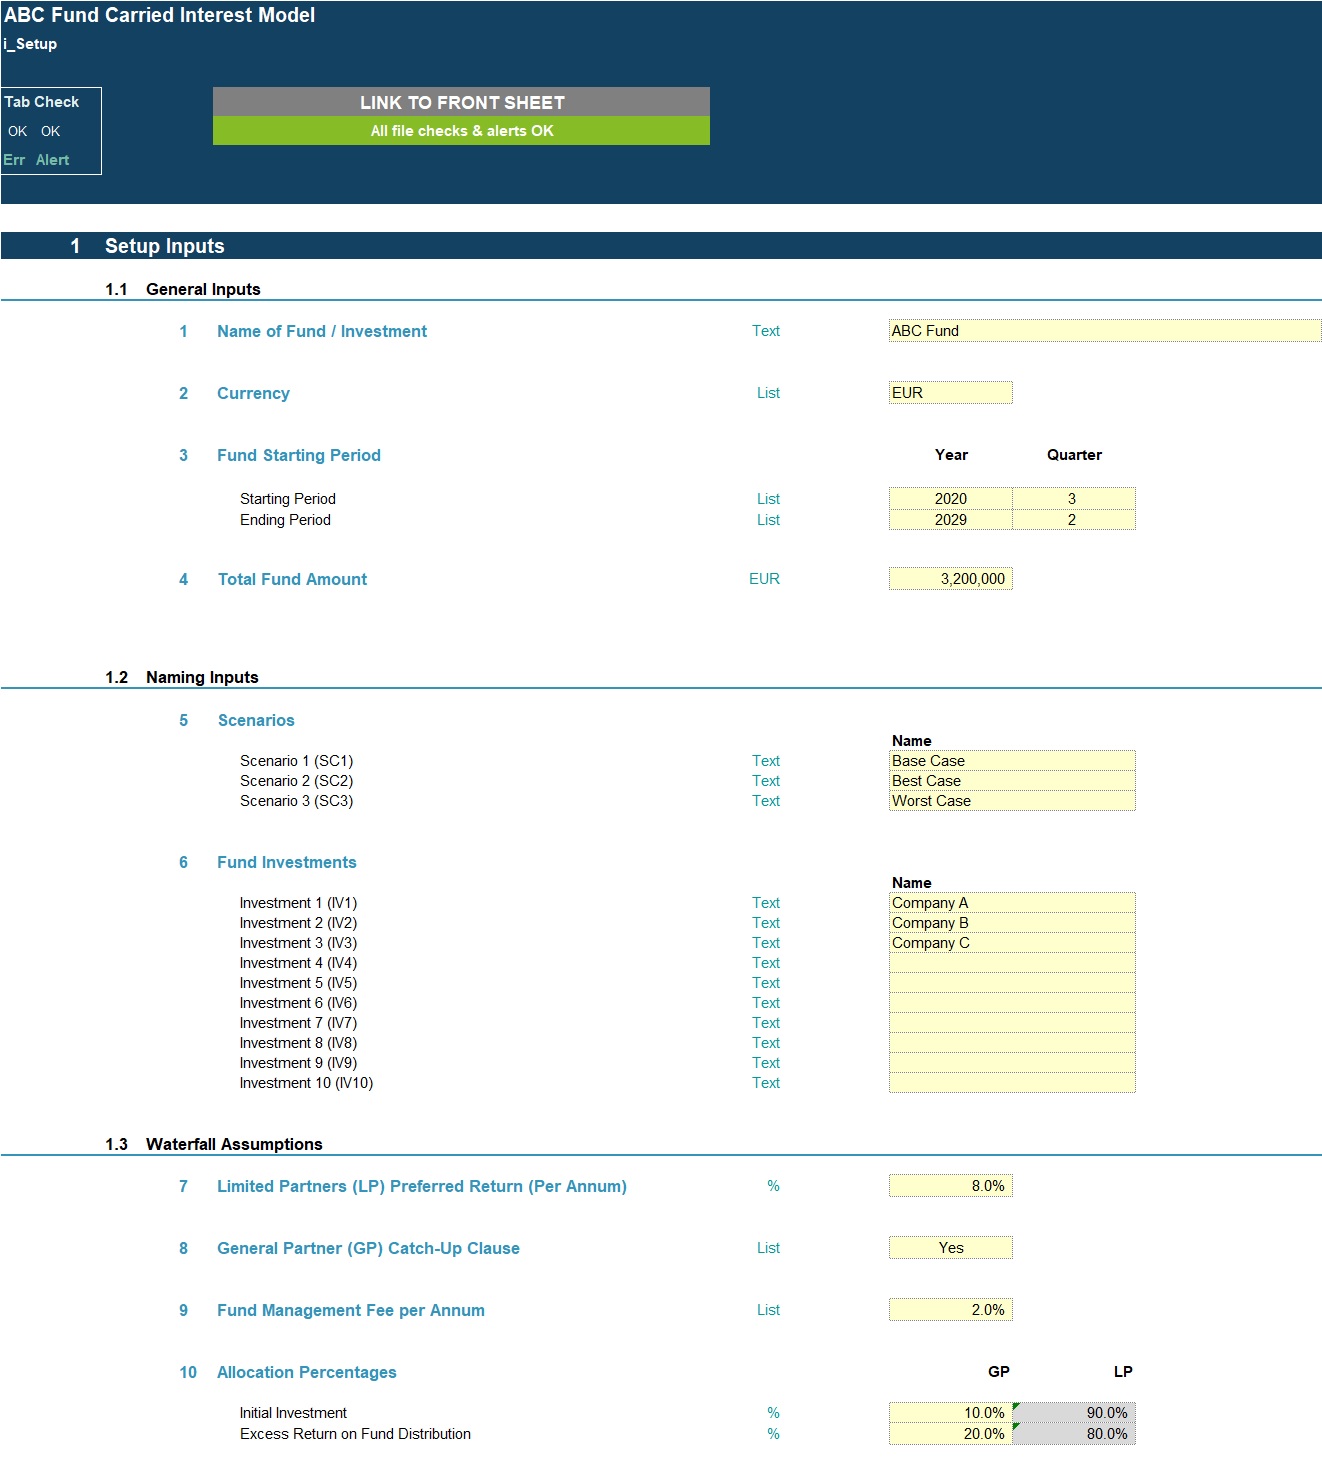
Inputs are split into setup inputs and cash flow inputs. All inputs include user-friendly input validations to help users populate correctly.
Setup inputs include:
• Fund name
• Names of underlying investments
• Fund starting and ending quarter
• Total fund amount
• Currency
• Waterfall assumptions including LP hurdle rate, equity contribution percentages, GP carried interest, GP catch up clause, GP management fee, Fund operating expenses
• Scenario naming
Cash Flow inputs include:
• Investment amounts by underlying portfolio company and scenario
• Distribution amounts by underlying portfolio company and scenario
• Fund distributions by scenario
• Fund operating expense cash flows
MODEL STRUCTURE
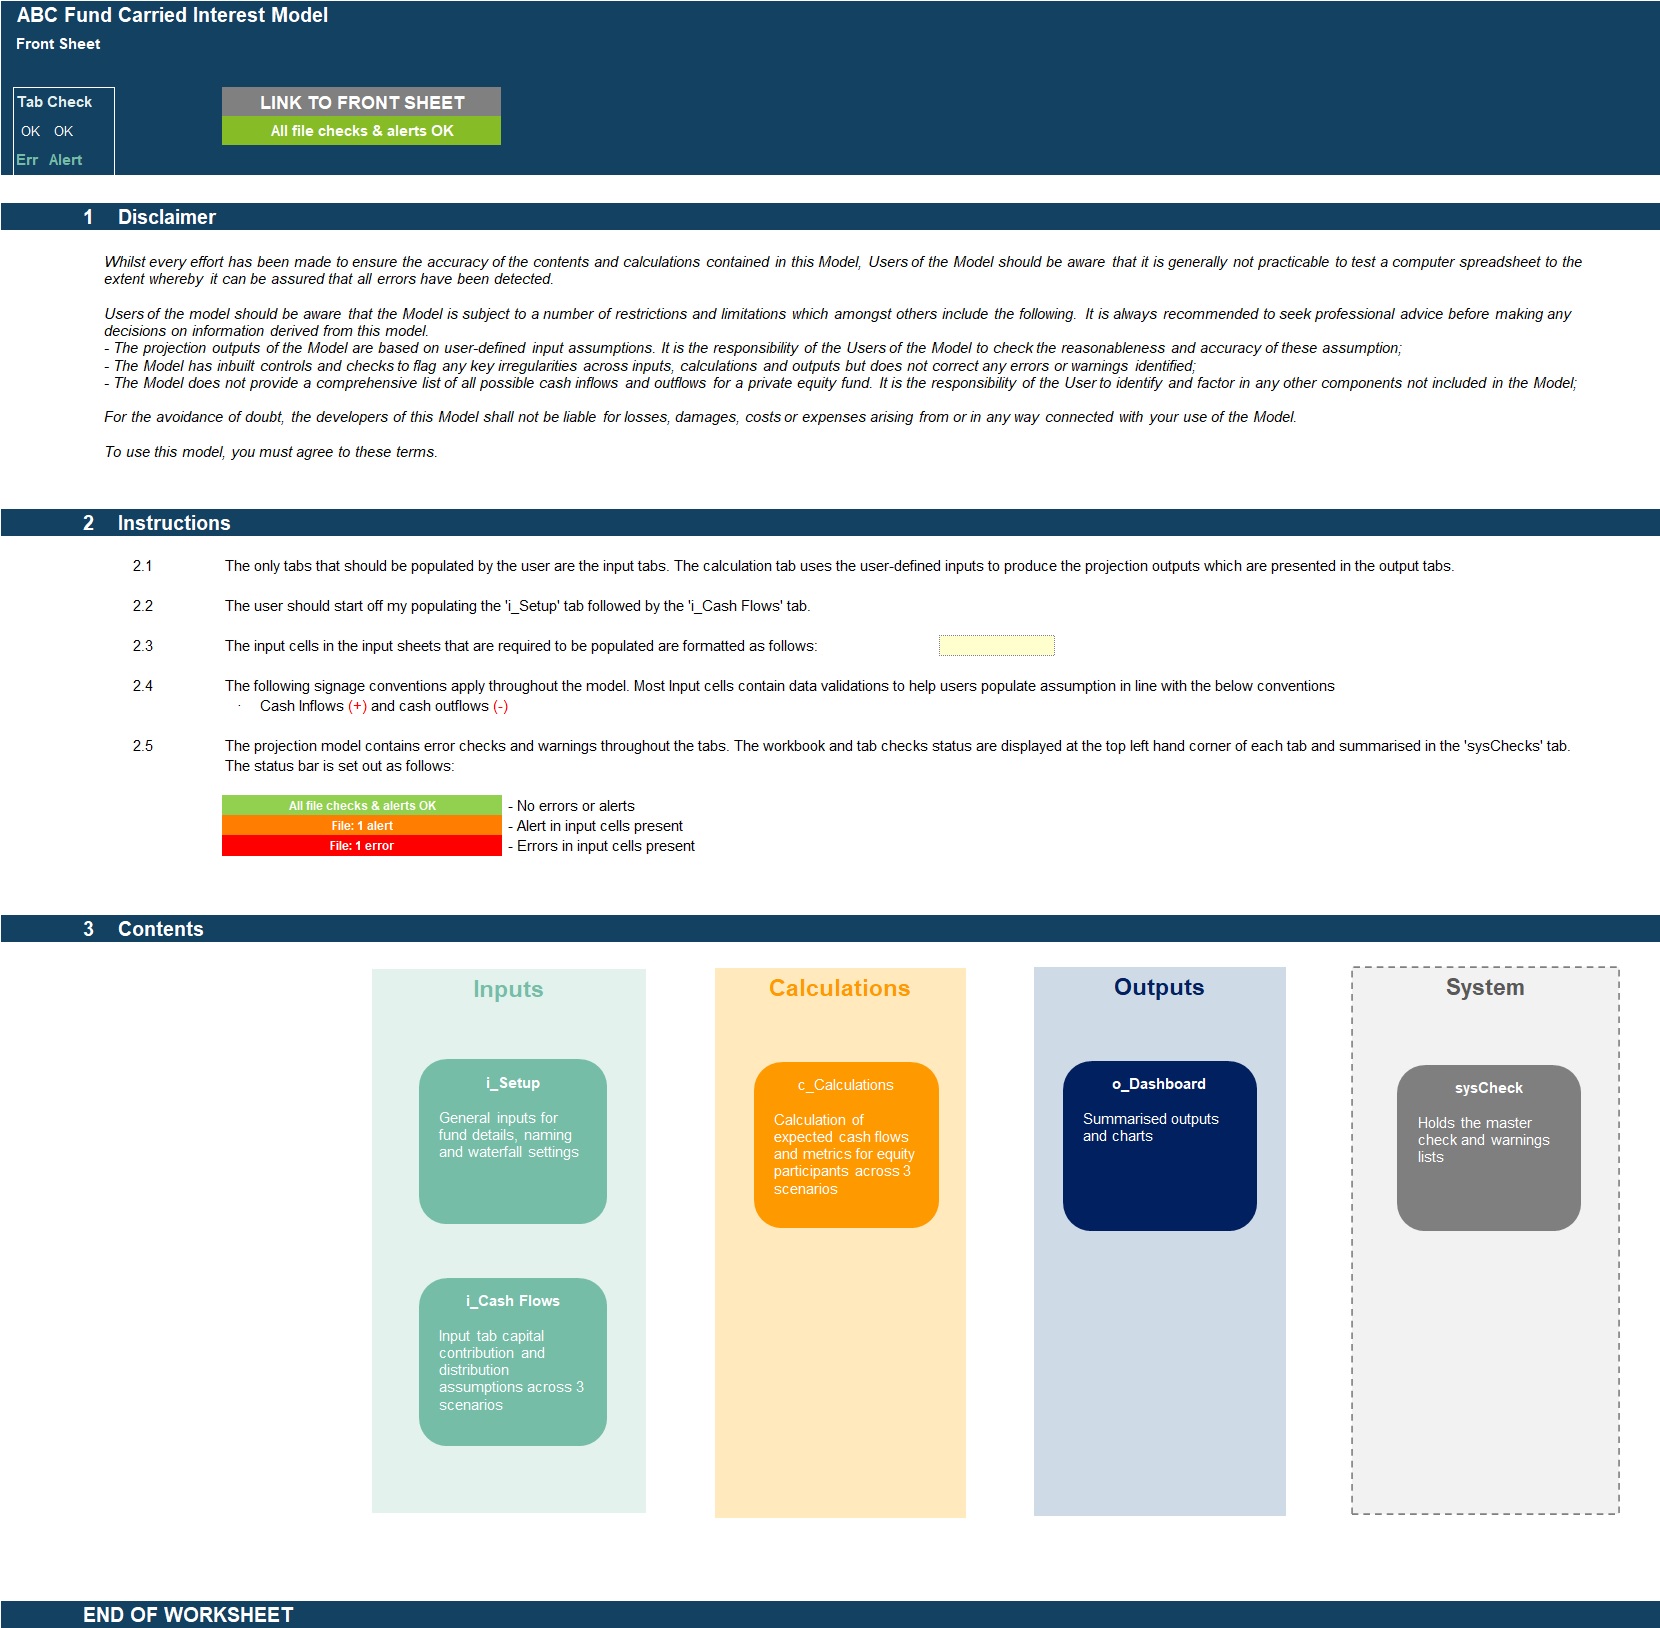
The model contains, 6 tabs split into input ('i_'), calculation ('c_'), output ('o_') and system tabs. The tabs to be populated by the user are the input tabs ('i_Setup' and 'i_Cash flows'). The calculation tab uses the user-defined inputs to calculate and produce the cap table outputs which are presented in ‘o_Dashboard'
System tabs include:
• A 'Front Sheet' containing a disclaimer, instructions and contents;
• A Checks dashboard containing a summary of checks by tab.
KEY FEATURES
Other key features of this model include the following:
• The model follows best practice financial modelling guidelines and includes instructions, checks and input validations;
• The model is not password protected and can be modified as required following download;
• The model is screened using specialised model audit software to help ensure formula consistency and significantly reduce risk of errors;
• The model allows for the following number of underlying categories for each line item (these can be easily expanded if required):
Scenarios – 3 scenarios;
Underlying portfolio company investments – 10 companies
• Fund Name and currency are fully customisable
• The model includes instructions, checks and input validations to help ensure input fields are populated accurately
• The model includes a checks dashboard which summarises all the checks included in the various tabs making it easier to identify any errors.
This model provides a comprehensive framework for accurately calculating fund distributions, catering to both Limited Partners and General Partners. With its robust scenario analysis and customizable inputs, it empowers users to simulate various investment outcomes and make informed financial decisions.
Got a question about the product? Email us at support@flevy.com or ask the author directly by using the "Ask the Author a Question" form. If you cannot view the preview above this document description, go here to view the large preview instead.
TOPIC FAQ
What are the typical components of a private equity distribution waterfall?
A distribution waterfall sequences returns from investments to investors and managers, typically including initial capital return, LP hurdle rates, GP catch-up mechanics, and carried interest allocations. It also accounts for management fees and fund operating expenses as inputs, with LP/GP splits defined by hurdle and catch-up provisions.How do carried interest and a GP catch-up affect LP and GP returns in a model?
Carried interest allocates a portion of profits to the GP once LP return hurdles are achieved; a catch-up provision shifts the split temporarily so the GP receives a larger share until its contractual carried percentage is met. The Fund Distribution Waterfall Model with Carried Interest Calculation allows users to input GP carried interest and catch-up provisions.What inputs are required to build a reliable waterfall model in Excel?
Key inputs include fund metadata (name, currency), timeline (start/end quarter), capital contributions and distributions by underlying portfolio company and scenario, LP hurdle rates, equity contribution splits, GP carried interest, GP management fee, and fund operating expenses.How can scenario analysis be used to test fund outcomes in a waterfall model?
Scenario analysis lets users compare alternate investment and distribution paths to assess sensitivity of IRR and carried interest outcomes. The referenced Flevy model supports naming and switching between up to 3 scenarios so users can compare waterfall outputs and IRRs across scenarios.What features should I prioritize when buying an Excel waterfall model for fund distribution?
Prioritize models with clear input/output separation, input validations, a checks dashboard, audit screening, modifiable formulas (no password protection), and outputs like waterfall tables, IRR by investor, and multiples. Also confirm scenario capacity and number of supported portfolio companies.How much customization and spreadsheet skill is typically needed to use a downloaded waterfall model?
A downloadable model with instructions, input validations, and pre-built calculation and output tabs reduces customization effort; users mainly populate setup and cash-flow inputs. The Fund Distribution Waterfall Model with Carried Interest Calculation is editable and includes instructions and checks across its 6-tab structure.I need to allocate distributions across multiple portfolio companies—how should I model that?
Enter each portfolio company’s capital contributions and distributions separately, then roll them up to the fund-level waterfall to calculate IRR, net cash flows, and carried interest allocation by company. The referenced model supports individual company cash flows and IRR reporting for up to 10 underlying companies.Can a waterfall model support investor reporting and legal/compliance transparency?
Yes; a well-structured waterfall model documents the sequence and allocation rules, produces tables and charts for stakeholder review, and supports audit checks to reduce errors—helping with investor transparency and compliance reporting through waterfall outputs in table and chart format.Source: Best Practices in Investment Vehicles, Private Equity Excel: Fund Distribution Waterfall Model with Carried Interest Calculation Excel (XLSX) Spreadsheet, Projectify
ABOUT THE AUTHOR

We are financial modelling professionals, accountants and CFA charterholders with experience working within Deloitte supporting clients with their financial planning and decision support needs. Our aim is to provide robust and easy-to-use financial models that follow good practice financial modelling guidelines and assist individuals and businesses with key financial planning and analysis ... [read more]
Ask the Author a Question
You must be logged in to contact the author.