This Pricing Strategy framework is created by former McKinsey, BCG, Deloitte, EY, and Capgemini consultants. It teaches the Strategy Consulting approach to formulating a Pricing Strategy. Financial model also included.
This product (Pricing Strategy) is a 38-slide PPT PowerPoint presentation slide deck (PPT) with a supplemental Excel document, which you can download immediately upon purchase.
Pricing Strategy is a core pillar of Marketing and Product Strategy. It is 1 of the 4 Ps of Marketing (also known as the Marketing Mix – Product, Price, Placement, and Promotion). As such, knowing how to properly price your product is extremely important to the commercial success and viability of your product offering.
This Pricing Strategy presentation (PowerPoint) provides an in-depth framework on Pricing Strategy; and is organized into the following sections:
1. Pricing Strategy
Price Skimming vs. Penetration Pricing
Consumer Adoption Curve
Advantages and Disadvantages
2. Pricing Approach
Data Collection
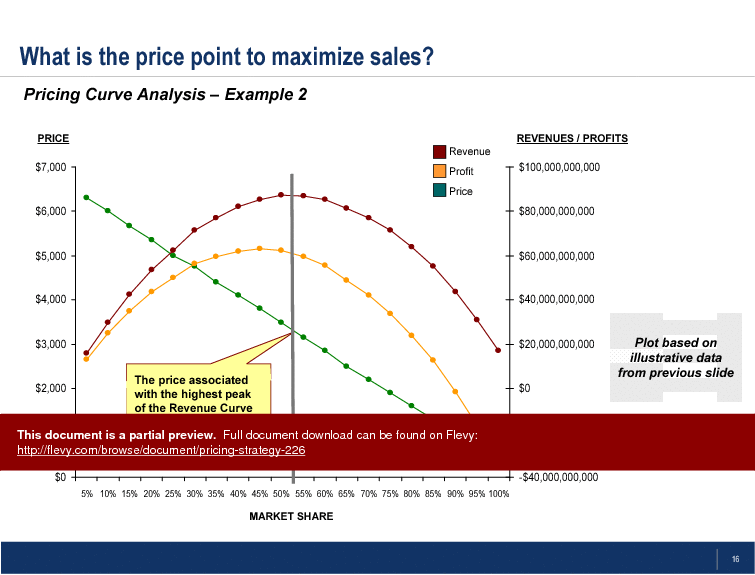
Price Curve Analysis
3. Price Sensitivity Analysis
Analysis Approach
Price Sensitivity Financial Model
4. Pricing Tactics and Terminology
Pricing should be an informed, strategic decision based on data, not a decision made randomly or based on trial-and-error. This Pricing Strategy in Marketing PPT teaches you a framework to do Pricing correctly. In fact, this Pricing Strategy framework is the same developed and used by global strategy consulting firms when conducting Pricing Strategy projects for their clients.
Formulating the optimal Pricing Strategy involves considering and answering critical pricing questions, such as:
• What is the price point to maximize profit?
• What is the price point to maximize share?
• What is the price point to capture the Early Market?
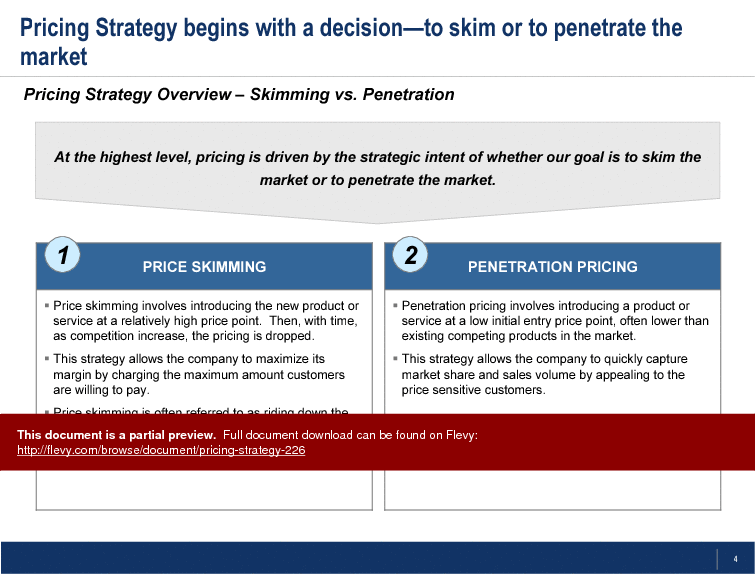
Pricing Strategy begins with a decision—to skim or to penetrate the market. Price skimming involves introducing the new product or service at a relatively high price point. Then, with time, as competition increase, the price is dropped. Penetration pricing involves introducing a product or service at a low initial entry price point, often lower than existing competing products in the market.
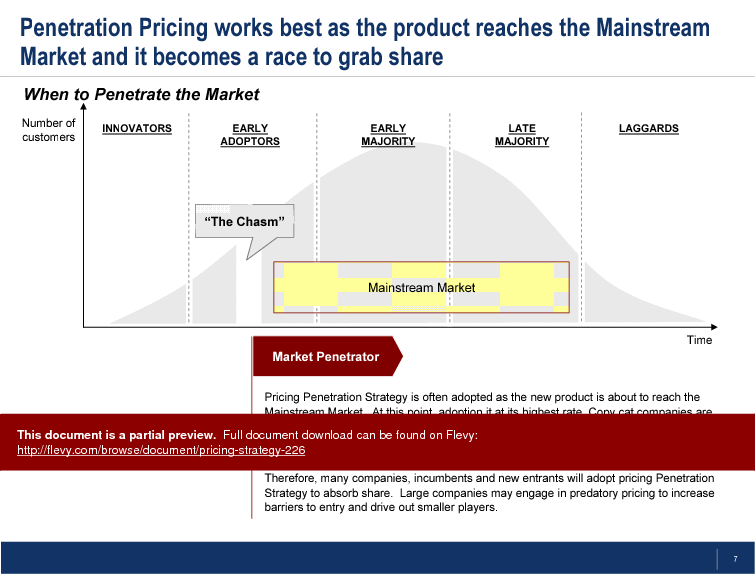
We have several slides explaining the concepts of Price Skimming (and Market Skimmer) vs. Penetration Pricing (and Market Penetrator), under the backdrop of the Consumer Adoption Curve (and with specific consideration for "crossing the chasm").
This Pricing Strategy PPT also presents a 3-phase approach to Pricing:
1. Data Collection – Pricing data is often difficult to gather. Therefore, pricing data may come from a variety of sources.
2. Analysis & Insights – With the gathered pricing data, the next step is to make sense of the numbers. It is critical to document and be rational with any assumptions made.
3. Pricing – The final phase involves setting the final price point.
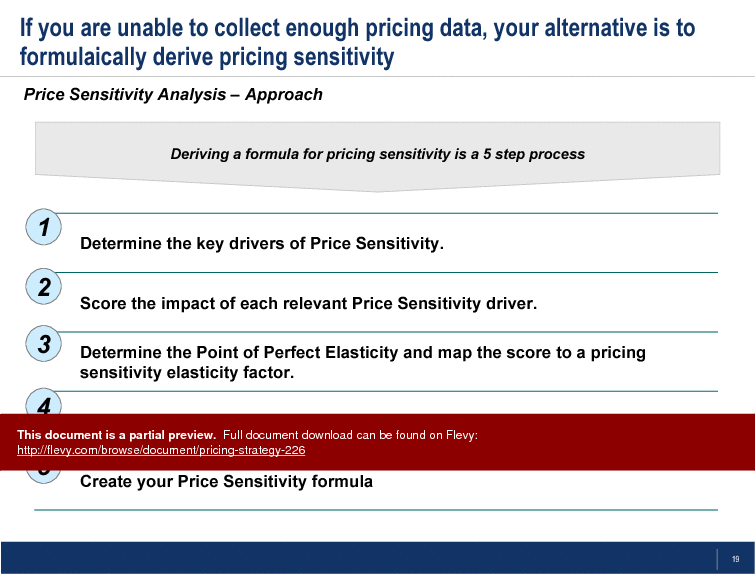
Within this Pricing presentation PowerPoint, there is also a detailed discussion of a 5-phase approach to Price Sensitivity Analysis. Price sensitivity is a measurement of how much the price of the product or service affects customers' willingness to buy the offering. This analysis highlights the 9 drivers to Price Sensitivity (e.g. Reference Price Point, Switching Cost Effect, Expenditure Effect, Fairness Effect, Framing Effect, etc.), Pricing Elasticity Analysis, and the Point of Perfect Elasticity.
A supporting Price Sensitivity Financial Model built in Excel is also included with this purchase.
As this is a fully editable PowerPoint presentation, you can also adapt the slides as templates for your own presentations on Pricing Strategy. The various PowerPoint diagrams (e.g. Consumer Adoption Curve, Price Curve Analysis) can be leveraged for your own Pricing presentations.
Additional Pricing tactics discussed include Loss Leader Pricing, Psychological Pricing, Price Discrimination, Predatory Pricing, Cost-Plus Pricing, among others.
This presentation provides a comprehensive analysis of the Price Sensitivity Financial Model, illustrating how to derive and apply pricing sensitivity formulas. It also includes detailed examples of various pricing tactics such as Psychological Pricing and Price Discrimination, offering practical insights for real-world application.
Got a question about the product? Email us at support@flevy.com or ask the author directly by using the "Ask the Author a Question" form. If you cannot view the preview above this document description, go here to view the large preview instead.
This PPT slide presents a comparative overview of 2 distinct pricing strategies: price skimming and penetration pricing. At the core, it emphasizes the strategic decision-making process involved in selecting an appropriate pricing approach based on market objectives.
Price skimming is defined as the practice of launching a new product or service at a high price point. This initial pricing strategy aims to maximize profit margins by capturing the willingness to pay of early adopters. As competition intensifies, the price is gradually lowered, allowing the company to adjust to market dynamics. The slide notes that this method can be likened to riding down the demand curve, where increased competition leads to a natural decline in prices. This approach can be particularly effective in markets where there is a strong differentiation of the product or service.
On the other hand, penetration pricing is characterized by introducing a product or service at a lower initial price point compared to competitors. This strategy is designed to quickly gain market share and increase sales volume, particularly among price-sensitive customers. By appealing to this segment, companies can establish a foothold in the market more rapidly. The slide highlights that this approach is often used when the goal is to build a customer base quickly, even if it means sacrificing initial profit margins.
Understanding these 2 strategies is crucial for executives as they navigate pricing decisions that align with their broader market entry or expansion goals. The choice between skimming and penetration pricing can significantly impact market positioning and long-term profitability.
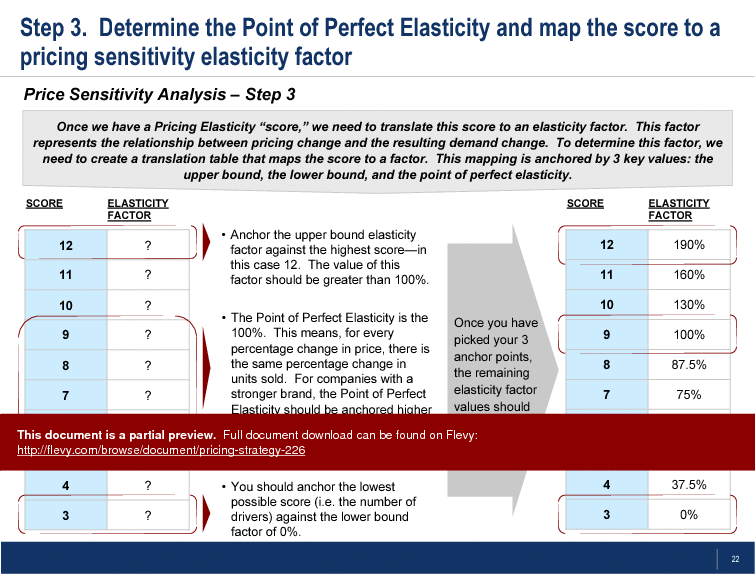
This PPT slide outlines the process of determining the Point of Perfect Elasticity and mapping a pricing elasticity score to a corresponding elasticity factor. The primary focus is on translating a pricing elasticity score into a tangible elasticity factor, which reflects how changes in pricing will impact demand.
The slide presents a scoring system ranging from 4 to 12, with each score linked to an elasticity factor. The highest score, 12, is anchored to an elasticity factor of 190%, indicating a strong sensitivity to price changes. The Point of Perfect Elasticity is defined as 100%, meaning that for every percentage change in price, there is an equivalent percentage change in units sold. This is critical for understanding how pricing strategies can be adjusted based on market conditions.
The slide emphasizes the importance of establishing 3 key anchor points: the upper bound, the mid-point, and the lower bound. For stronger brands, the Point of Perfect Elasticity should be anchored higher than the mid-point score, while weaker brands should have it lower. This nuanced approach allows for a more tailored pricing strategy that aligns with brand strength and market positioning.
The remaining elasticity factor values are derived from these anchor points, creating a structured framework for businesses to assess their pricing strategies effectively. This systematic mapping is essential for executives looking to refine their pricing models and understand the implications of price changes on demand.
Overall, the slide serves as a guide for executives to navigate the complexities of pricing elasticity, ensuring informed decision-making in pricing strategies.
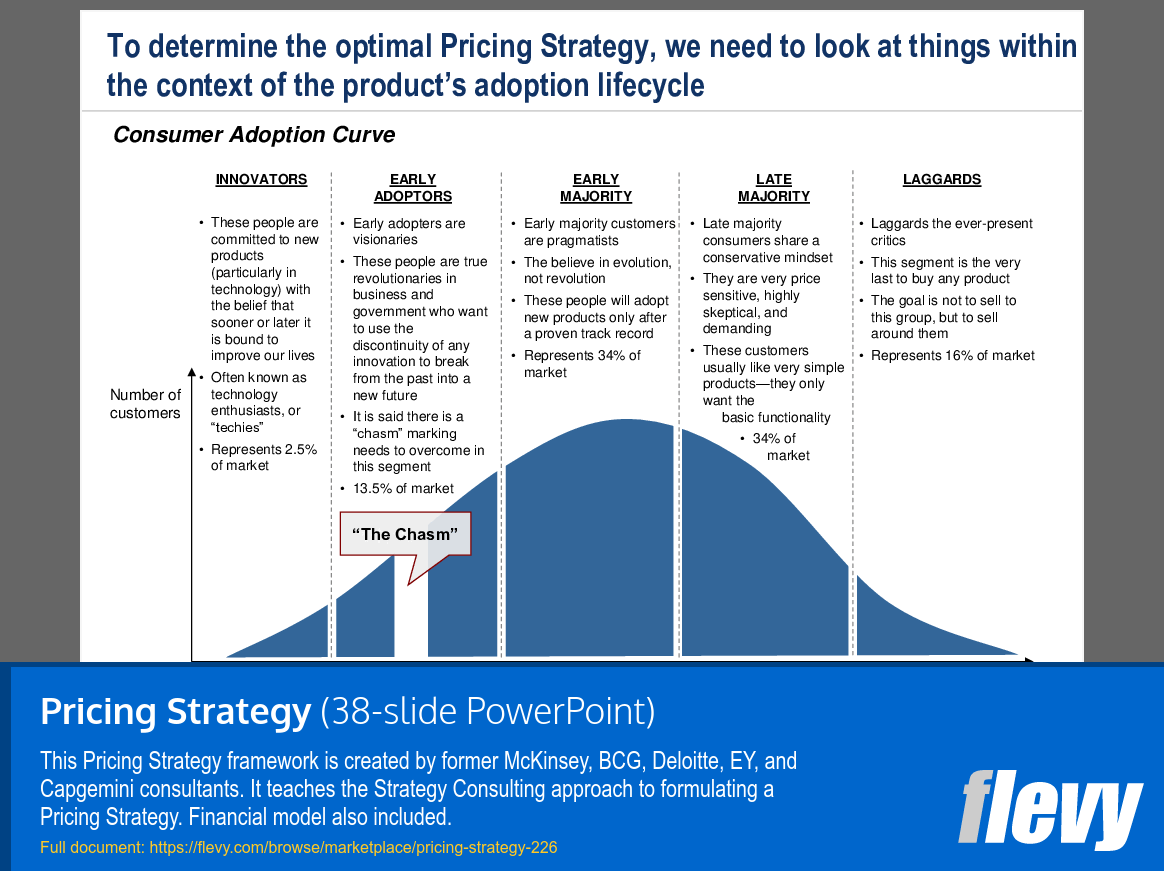
This PPT slide presents the Consumer Adoption Curve, a critical framework for understanding how different segments of customers adopt new products over time. It categorizes customers into 5 distinct groups: Innovators, Early Adopters, Early Majority, Late Majority, and Laggards, each representing a percentage of the overall market.
Innovators, making up 2.5% of the market, are characterized as technology enthusiasts who embrace new products with the belief that they will enhance their lives. Early Adopters, representing 13.5%, are visionaries who are willing to take risks and advocate for revolutionary changes in business and government. They are crucial for bridging the gap between innovation and broader market acceptance, often referred to as “The Chasm.”
The Early Majority, which constitutes 34% of the market, consists of pragmatists who prefer proven solutions. They adopt new products only after they have demonstrated a successful track record. This group is essential for achieving substantial market penetration. The Late Majority, also 34%, is more conservative and price-sensitive, often requiring simple, functional products. They tend to be skeptical and demanding, making them a challenging segment to engage.
Finally, Laggards, representing 16% of the market, are the last to adopt any product. They are often critical of new innovations and require strategies that focus on accommodating their needs rather than direct selling. Understanding these segments is vital for determining optimal pricing strategies and effectively positioning products in the market.
This PPT slide outlines a structured approach to determining the appropriate price point after establishing a pricing strategy. It is divided into 3 main sections: Data Collection, Analysis & Insights, and Pricing.
The Data Collection section emphasizes the challenges associated with gathering pricing data, highlighting that it often comes from diverse sources. Key methods listed include customer surveys, market research reports, historical sales data, and competitive intelligence. This variety underscores the importance of a comprehensive data-gathering strategy to inform pricing decisions.
Moving to Analysis & Insights, the slide stresses the necessity of making sense of the collected data. It points out that rational documentation of assumptions is critical in this phase. The visual representation of data, likely a graph or chart, suggests that analysis will involve interpreting trends and relationships between price and revenue. This analytical phase is crucial for deriving actionable insights from the data.
The final section, Pricing, succinctly states the goal: to set the price point. It poses 3 essential questions that guide this decision-making process: identifying the price point that maximizes profit, the one that maximizes market share, and the price point aimed at capturing the early market. These questions are pivotal as they direct focus towards strategic pricing objectives that align with overall business goals.
This slide serves as a roadmap for executives looking to refine their pricing strategy, ensuring that decisions are data-driven and strategically sound. The structured approach outlined here can help mitigate risks associated with pricing decisions and enhance market positioning.
This PPT slide outlines a framework for determining a pricing strategy, focusing on price sensitivity. It emphasizes the importance of defining key inputs and assumptions that will guide the pricing model. The section titled "INPUTS/ASSUMPTIONS" lists several critical metrics, including Total Possible Score, Lowest Possible Score, Price Elasticity Score, Elasticity Factor Upper Bound, Point of Perfect Elasticity, and Threshold of No Elasticity.
The Total Possible Score is set at 15, indicating the maximum score achievable based on selected price sensitivity drivers. The Lowest Possible Score is noted as 5, which serves as a baseline for evaluating pricing effectiveness. Price Elasticity Score is indicated at 13, reflecting the responsiveness of demand to price changes. The Elasticity Factor Upper Bound is set at 150%, suggesting a limit on how much elasticity can be factored into the pricing model.
Point of Perfect Elasticity is listed as 12, which denotes the optimal point where price changes do not affect demand. The Threshold of No Elasticity is at 5.50%, indicating a minimum price point below which demand remains unaffected. The Calculated Elasticity Factor is derived at 117%, providing a quantitative measure of price sensitivity.
The slide also instructs users to modify assumptions in the yellow cells, highlighting the dynamic nature of these inputs. This flexibility allows for tailored pricing strategies based on specific market conditions and business objectives. Understanding these metrics is crucial for making informed pricing decisions that align with overall business strategy.
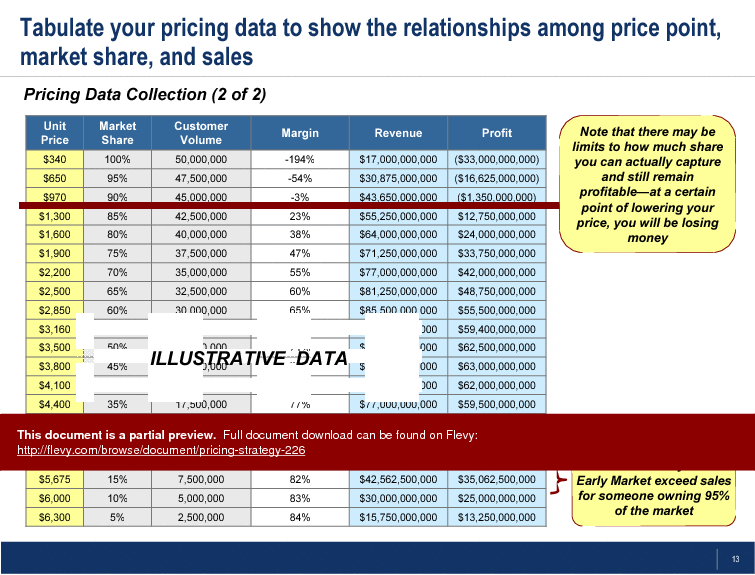
This PPT slide presents a detailed tabulation of pricing data, illustrating the interplay between unit price, market share, customer volume, margin, revenue, and profit. Each row corresponds to a different unit price, ranging from $340 to $6,000, with associated metrics that provide insight into how pricing decisions impact overall financial performance.
At the highest price point of $340, the market share is maximized at 100%,, but this comes with a significant negative margin, indicating that while volume is high, profitability is severely compromised. As prices increase, market share decreases,, but margins and revenue fluctuate, revealing a complex relationship. For instance, at a price of $1,300, the margin is 23%, generating a profit of approximately $12.75 million, which is a notable improvement compared to lower price points.
The data also highlights a critical observation regarding pricing strategy: there are limits to market share capture without sacrificing profitability. As prices rise, the slide notes that a point will be reached where lowering prices further leads to losses, emphasizing the need for a balanced approach to pricing.
The illustrative nature of the data suggests that these figures are not absolute, but serve as a guide for decision-making. The annotations on the slide further reinforce the importance of understanding the dynamics of pricing and market share, particularly the implications of early market sales versus established market positions. This analysis is crucial for executives considering adjustments to their pricing strategies, as it underscores the need to align pricing with both market conditions and profitability objectives.
This Pricing Strategy framework is created by former McKinsey, BCG, Deloitte, EY, and Capgemini consultants. It teaches the Strategy Consulting approach to formulating a Pricing Strategy. Financial model also included.
We are a team of management consultants trained by top tier global consulting firms (including McKinsey, BCG, Deloitte, EY, Capgemini) with a collective experience of several decades. We specialize in business frameworks based on real-life consulting engagements.
We have served 100s of clients that range from Fortune 500 companies to tech startups to
... [read more] $1B+ private companies.
Utilize our consulting frameworks to apply structured thinking & analysis to address your business challenges, uncover strategic insights, and implement workable solutions. Our PowerPoint presentations follow traditional consulting slide design formats, starting with a clear slide headline. Easily customize and repurpose our slides for your own business presentations.
Beyond business frameworks & methodologies, we also offer PowerPoint templates and other business templates. Our templates are professionally designed and have been used in thousands of deliverables & work products across hundreds of clients.
The average daily rate of a McKinsey consultant is $6,625 (not including expenses). The average price of a Flevy document is $65.
Trusted by over 10,000+ Client Organizations
Since 2012, we have provided best practices to over 10,000 businesses and organizations of all sizes, from startups and small businesses to the Fortune 100, in over 130 countries.
Read Customer Testimonials
"I like your product. I'm frequently designing PowerPoint presentations for my company and your product has given me so many great ideas on the use of charts, layouts, tools, and frameworks. I really think the templates are a valuable asset to the job."
– Roberto Fuentes Martinez, Senior Executive Director at Technology Transformation Advisory
"I am extremely grateful for the proactiveness and eagerness to help and I would gladly recommend the Flevy team if you are looking for data and toolkits to help you work through business solutions."
– Trevor Booth, Partner, Fast Forward Consulting
"FlevyPro has been a brilliant resource for me, as an independent growth consultant, to access a vast knowledge bank of presentations to support my work with clients. In terms of RoI, the value I received from the very first presentation I downloaded paid for my subscription many times over! The
quality of the decks available allows me to punch way above my weight – it's like having the resources of a Big 4 consultancy at your fingertips at a microscopic fraction of the overhead.
"
– Roderick Cameron, Founding Partner at SGFE Ltd
"If you are looking for great resources to save time with your business presentations, Flevy is truly a value-added resource. Flevy has done all the work for you and we will continue to utilize Flevy as a source to extract up-to-date information and data for our virtual and onsite presentations!"
– Debbi Saffo, President at The NiKhar Group
"I have found Flevy to be an amazing resource and library of useful presentations for lean sigma, change management and so many other topics. This has reduced the time I need to spend on preparing for my performance consultation. The library is easily accessible and updates are regularly provided. A wealth of great information."
– Cynthia Howard RN, PhD, Executive Coach at Ei Leadership
"[Flevy] produces some great work that has been/continues to be of immense help not only to myself, but as I seek to provide professional services to my clients, it gives me a large "tool box" of resources that are critical to provide them with the quality of service and outcomes they are expecting."
– Royston Knowles, Executive with 50+ Years of Board Level Experience
"Flevy is our 'go to' resource for management material, at an affordable cost. The Flevy library is comprehensive and the content deep, and typically provides a great foundation for us to further develop and tailor our own service offer."
– Chris McCann, Founder at Resilient.World
"FlevyPro provides business frameworks from many of the global giants in management consulting that allow you to provide best in class solutions for your clients."
– David Harris, Managing Director at Futures Strategy
Download our free compilation of 50+ Strategy & Transformation slides and templates. Frameworks include McKinsey 7-S, Balanced Scorecard, Disruptive Innovation, BCG Curve, and many more.
Download our free compilation of 50+ Strategy & Transformation slides and templates. Frameworks include McKinsey 7-S, Balanced Scorecard, Disruptive Innovation, BCG Curve, and many more.